Documentation Revision Date: 2024-09-12
Dataset Version: 1
Summary
This dataset contains 525 cloud optimized GeoTIFF (.tif) files. There are three files for each ABoVE tile.
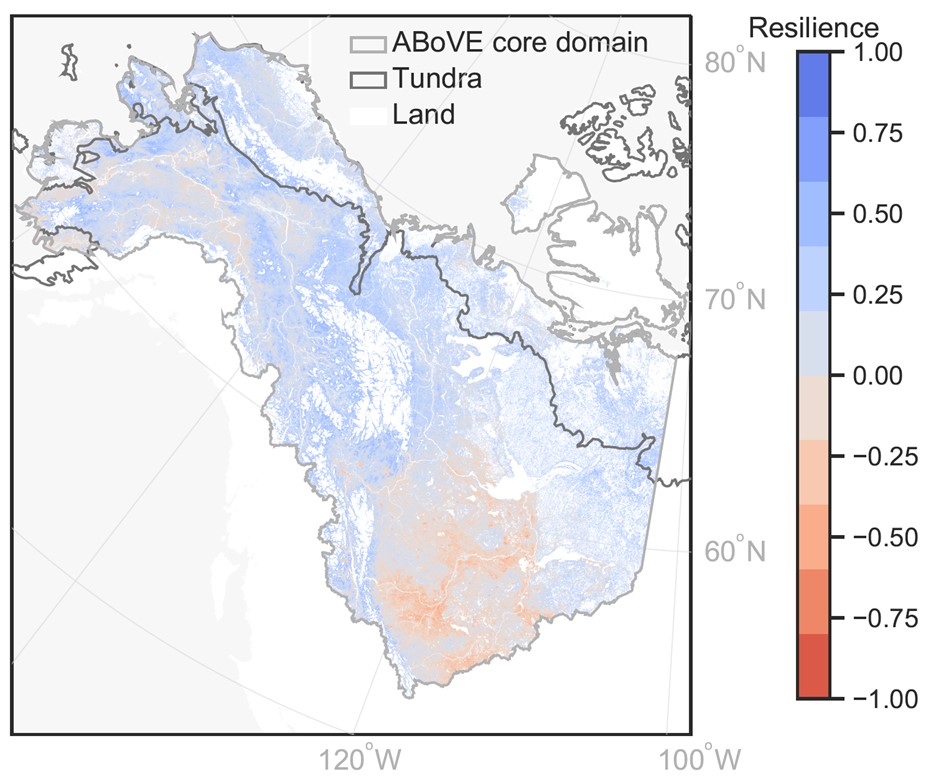
Figure 1. The map of vegetation resilience for the year 2019 in the ABoVE core domain.
Citation
Zhang, Y., and Y. Liu. 2024. MODIS-derived Annual Vegetation Resilience, 2000-2019. ORNL DAAC, Oak Ridge, Tennessee, USA. https://doi.org/10.3334/ORNLDAAC/2374
Table of Contents
- Dataset Overview
- Data Characteristics
- Application and Derivation
- Quality Assessment
- Data Acquisition, Materials, and Methods
- Data Access
- References
Dataset Overview
This dataset provides estimates of vegetation resilience in the Arctic Boreal Vulnerability Experiment (ABoVE) core domain at annual time steps for 2000-2019 and at 300-m spatial resolution. Vegetation resilience is defined as the recovery rate from deviations, due to climate perturbations or disturbances, to the equilibrium state. It is quantified as the negative temporal lag-1 autocorrelation of Enhanced Vegetation Index (EVI). Using a time series of MODIS EVI, the vegetation resilience was estimated using a Bayesian dynamic linear model. The mapped vegetation resilience was derived from Terra EVI products (MOD13Q1v061) across 175 ABoVE B grid tiles over the ABoVE core domain. The estimated mean resilience, upper boundary, and lower boundary results are provided for each tile.
Project: ABoVE
The Arctic-Boreal Vulnerability Experiment (ABoVE) is a NASA Terrestrial Ecology Program field campaign being conducted in Alaska and western Canada, for 8 to 10 years, starting in 2015. Research for ABoVE links field-based, process-level studies with geospatial data products derived from airborne and satellite sensors, providing a foundation for improving the analysis, and modeling capabilities needed to understand and predict ecosystem responses to, and societal implications of, climate change in the Arctic and Boreal regions.
Related Publication
Zhang, Y., J.A. Wang, L.T. Berner, S.J. Goetz, K. Zhao, and Y. Liu. 2024. Warming and disturbances affect arctic-boreal vegetation resilience across northwestern North America. Nature Ecology & Evolution (in review).
Related Dataset
Loboda, T.V., E.E. Hoy, and M.L. Carroll. 2019. ABoVE: Study Domain and Standard Reference Grids, Version 2. ORNL DAAC, Oak Ridge, Tennessee, USA. https://doi.org/10.3334/ORNLDAAC/1527
Acknowledgement
This research was funded by NASA's Arctic-Boreal Vulnerability Experiment (grant 80NSSC22K1249).
Data Characteristics
Spatial Coverage: Alaska and western Canada
ABoVE Reference Locations
Domain: Core ABoVE
Spatial Resolution: 300 m
Temporal Coverage: 2000-01-01 to 2019-12-31
Temporal Resolution: Annual estimates
Study Area: Latitude and longitude are given in decimal degrees.
| Site (Region) | Westernmost Longitude | Easternmost Longitude | Northernmost Latitude | Southernmost Latitude |
|---|---|---|---|---|
| Alaska and Canada | -170.0058 | -98.9740 | 76.2257 | 50.2590 |
This dataset contains 525 cloud optimized GeoTIFF (.tif) files. There are three files for each ABoVE tile (Table 1).
The files are named Bh<XX>v<ZZ>_ABoVE_resilience_<bound>.tif, where
- <XX> is the horizontal tile location on the ABoVE moderate resolution (B cell) reference grid,
- <ZZ> is the vertical tile location on the ABoVE moderate resolution (B cell) reference grid,
- <bound> designates the "lower_boundary" or "upper_boundary" of the mean estimate.
Table 1. File descriptions.
| File name | Description |
|---|---|
| Bh<XX>v<ZZ>_ABoVE_resilience.tif | Estimated mean vegetation resilience for tile Bh<XX>v<ZZ>. One band for each year from 2000 to 2019. |
| Bh<XX>v<ZZ>_ABoVE_resilience_lower_boundary.tif | Estimated lower boundary (mean minus standard deviation) of vegetation resilience for tile Bh<XX>v<ZZ>. One band for each year from 2000 to 2019. |
| Bh<XX>v<ZZ>_ABoVE_resilience_upper_boundary.tif | Estimated upper boundary (mean plus standard deviation) of vegetation resilience for tile Bh<XX>v<ZZ>. One band for each year from 2000 to 2019. |
GeoTIFF characteristics
- Coordinate system: NAD 1983 Albers Canada, units = m, (EPSG:102001, the standard ABoVE projection)
- Spatial resolution: 300 m
- Dimensions: 600 rows x 600 columns
- Bands: 20 bands, each corresponds to an annual estimate for 2000 to 2019 (e.g., band 1 is for 2000, band 2 is 2001, etc.)
- Pixel values: vegetation resilience index; unitless values from -1.0 to +1.0.; however, values in lower and upper boundaries may exceed these limits.
- Nodata value: -9999
- Data type: Float32
Application and Derivation
The dataset provides information on the spatiotemporal pattern of vegetation resilience for the entire ABoVE domain at 300-m resolution over 20 years. These estimates may be used for studies of disturbance-recovery dynamics of vegetation in arctic and boreal biomes.
Quality Assessment
The uncertainty of the vegetation resilience maps were measured using the standard deviation from the posterior estimates. In this dataset, three files were provided for each ABoVE tile: annual maps of estimated mean vegetation resilience, annual maps of estimated lower boundary of vegetation resilience, and annual maps of estimated upper boundary of vegetation resilience (e.g., Figure 2).
Specifically, at each 16-day time step, the posterior distribution of vegetation resilience was estimated from the prior distribution and likelihood. The 16-day time series of lower/upper boundary of vegetation resilience was defined as the mean minus/plus the standard deviation. The time series of annual vegetation resilience is calculated as the average of 16-day values over June, July and August. Note that the data for the spin-up years 2000-2002 are recommended to be discarded due to large uncertainties.
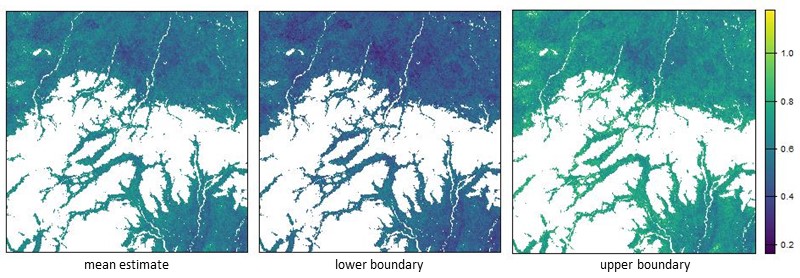
Figure 2. Estimated vegetation resilience for 2009 for ABoVE tile Bh04v05 with lower and upper boundaries of the estimate. Each map is 180 km across.
Data Acquisition, Materials, and Methods
The 16-day Terra Enhanced Vegetation Index (EVI) products (MOD13Q1v061) from 2000 to 2019 were reprojected into the ABoVE standard Alber’s Equal-Area projection (300 m grid, EPSG 102001) and were gridded into 180 km x 180 km ABoVE standard B grid tiles. The vegetation resilience is defined as the recovery rate from deviations, due to climate perturbations or disturbances, to the equilibrium state. Vegetation resilience was quantified as the negative temporal lag-1 autocorrelation of EVI.
The dynamic linear model setup was adapted from Liu et al. (2019) as follows:
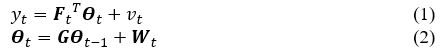
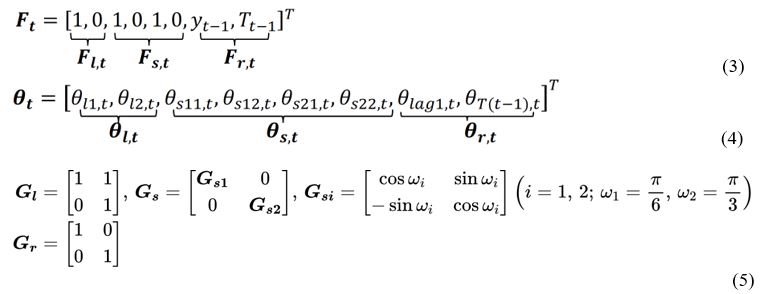
where yt is the observed EVI at each 16-day time step t after removing the long-term mean at a pixel. The model disentangles the temporal variation of yt into Gaussian observational noise (vt) and three components, i.e., the mean and trend component y(l,t), the seasonality component y(s,t), and the regression component y(r,t), giving yt = y(l,t) + y(s,t) + y(r,t) + vt. Correspondingly, Ft (Eq. 3) is a vector consisting of known constants and regressors used to aggregate the three components in the state vector Θt (Eq. 4). Specifically, F(l,t) aggregates the mean and trend component Θ(l,t), where Θ(l1,t) and Θ(l2,t) describe the mean of y(l,t) and its change from t-1 to t, respectively, representing the equilibrium state that could adapt to observations to account for shifted equilibrium regime after vegetation changes; F(s,t) aggregates the seasonal cycle Θ(s,t) described by two Fourier components with periods of one year and a half year; and F(r,t) includes EVI at the previous time step (y(t-1)) and the z-score of mean air temperature (T(t-1)), which yields y(r,t) when multiplied with the regression coefficients Θ(r,t) = (Θ(lag1,t), Θ(T(t-1),t) )T. The lag-1 autocorrelation of EVI (Θ(lag1,t)) was of particular interest, and -Θ(lag1,t) was used to measure resilience. The state vector Θt evolves from t-1 to t based on an evolution matrix G = diag(Gl,Gs,Gr), where the mean and trend (Gl), seasonality (Gs), and regression Gr components consist of known constants (Eq. 5).
Bayesian inference was used to estimate the resilience embedded in Θt at each time step. Specifically, Θt was assumed to follow a multivariate Gaussian distribution. The same non-informative priors as described in Liu et al. (2019) were used for Θ(t=0) and the noise. At each time step t, the posterior distribution of Θt, p(Θt | y1,...,y(t-1),yt) was estimated based on the Bayes theorem by combining the prior of Θt, i.e., p(Θt |y1,...,y(t-1)), derived from historical observations (y1,...,y(t-1)), and the likelihood of observing yt, i.e., p(yt |Θt y1,...,y(t-1)) (Eq. 6).

At each 16-day time step, the posterior estimates of Θt is a multivariate t distribution with mean vector m and covariance C. The estimated mean and standard deviation of vegetation resilience are the mean and standard deviation of -Θ(lag1,t), respectively. The 16-day time series of lower/upper boundary of vegetation resilience is defined as the mean minus/plus the standard deviation. The time series of annual vegetation resilience is calculated as the average of 16-day values over June, July and August.
See Zhang et al. (2024, in review) for further details.
Data Access
These data are available through the Oak Ridge National Laboratory (ORNL) Distributed Active Archive Center (DAAC).
MODIS-derived Annual Vegetation Resilience, 2000-2019
Contact for Data Center Access Information:
- E-mail: uso@daac.ornl.gov
- Telephone: +1 (865) 241-3952
References
Liu, Y., M. Kumar, G.G. Katul, and A. Porporato. 2019. Reduced resilience as an early warning signal of forest mortality. Nature Climate Change 9:880–885. https://doi.org/10.1038/s41558-019-0583-9
Loboda, T.V., E.E. Hoy, and M.L. Carroll. 2019. ABoVE: Study Domain and Standard Reference Grids, Version 2. ORNL DAAC, Oak Ridge, Tennessee, USA. https://doi.org/10.3334/ORNLDAAC/1527
Zhang, Y., J.A. Wang, L.T. Berner, S.J. Goetz, K. Zhao, and Y. Liu. 2024. Warming and disturbances affect arctic-boreal vegetation resilience across northwestern North America. Nature Ecology & Evolution (in review).