Documentation Revision Date: 2025-06-10
Dataset Version: 3
Summary
AVIRIS-NG is the Airborne Visible/Infrared Imaging Spectrometer-Next Generation instrument. Measurements were conducted during flights over the Arctic-Boreal Vulnerability Experiment (ABoVE) domain during summer months from June to August in 2017, 2018, 2019, 2021, and 2022. In this Version 3, the L2 reflectance files for all years were processed (or reprocessed if previously published) with an updated and consistent reflectance algorithm. For years 2018 and 2019, Level 1 radiance data are unchanged from the V2 files and are provided in this V3.
The data include flight lines covering areas of interest to the ABoVE campaign over much of Alaska as well as the Yukon and Northwest Territories in northwestern Canada. These data will allow researchers to characterize ecosystem structure and function near the peak of the growing season. The AVIRIS-NG imaging spectroscopy dataset represents one part of a multi-sensor airborne sampling campaign conducted by eleven different aircraft teams for ABoVE.
Due to a recognized error in 2017 files, both L1B radiance and L2 reflectance files are being reprocessed and are not yet included in this V3 release. Corrected 2017 L1 and L2 files will be added when available.
This dataset includes 2,521 data files. There are 1,673 files in ENVI binary image format (compressed in *.tar.gz format), 843 RGB composite image images in JPEG or PNG format, and 5 shapefiles (compressed in *.zip archives) providing the boundaries for the imagery captured for each flight line.
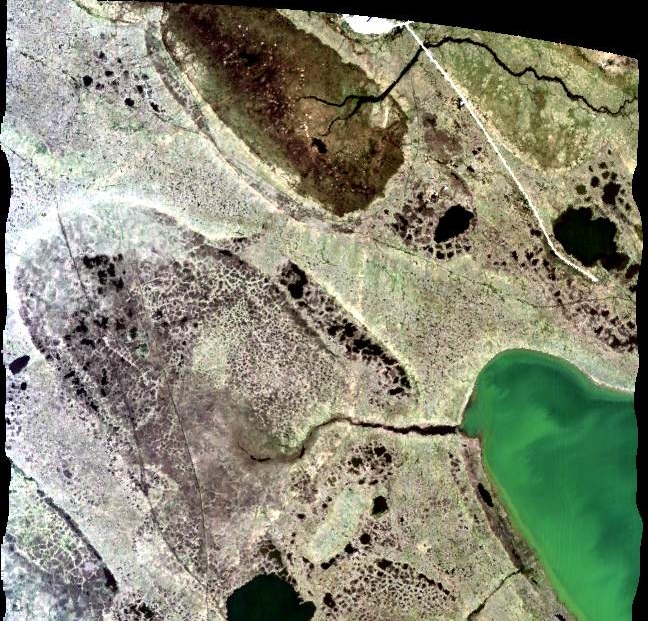
A portion of the quicklook image from flight line ang20170714t212855 over Barrow, Alaska on July 14, 2017. Two sites (AB_B10_L001_FL175_PipelineLake and AB_B10_L003_FL175_PipelineLake) of interest to the ABoVE project are visible. Flight altitude was approximately 5,400 m with very thin cirrus cloud cover.
Citation
Miller, C.E., R.O. Green, D.R. Thompson, A.K. Thorpe, M. Eastwood, I.B. Mccubbin, W. Olson-Duvall, M. Bernas, C.M. Sarture, S. Nolte, L.M. Rios, M.A. Hernandez, B.D. Bue, and S.R. Lundeen. 2024. ABoVE: AVIRIS-NG Imaging Spectroscopy for Alaska, Canada, and Iceland, 2017-2022, V3. ORNL DAAC, Oak Ridge, Tennessee, USA. https://doi.org/10.3334/ORNLDAAC/2362
Table of Contents
- Dataset Overview
- Data Characteristics
- Application and Derivation
- Quality Assessment
- Data Acquisition, Materials, and Methods
- Data Access
- References
- Dataset Revisions
Dataset Overview
This dataset supersedes previously published Level 2 surface reflectance ABoVE AVIRIS-NG files (Miller et al., 2022) as well as previously unpublished L1 radiance and L2 reflectance for 2021 and 2022. AVIRIS-NG is the Airborne Visible/Infrared Imaging Spectrometer-Next Generation instrument. Measurements were conducted during flights over the Arctic-Boreal Vulnerability Experiment (ABoVE) domain during summer months from June to August in 2018, 2019, 2021, and 2022. In this Version 3, the L2 reflectance files for all years were processed (or reprocessed if previously published) with an updated and consistent reflectance algorithm to enable accurate time series evaluations. For years 2018 and 2019, Level 1 radiance data are unchanged from the V2 files and provided in this V3. Flights in 2021 occurred over Iceland. AVIRIS-NG measures reflected radiance in 425 bands at 5-nanometer (nm) intervals in the visible to shortwave infrared spectral range between 380 and 2510 nm. Measurements are radiometrically and geometrically calibrated and provided at approximately 5-m spatial resolution. The data include flight lines covering areas of interest to the ABoVE campaign over much of Alaska and northwestern Canada. These data will allow researchers to characterize ecosystem structure and function near the peak of the growing season. This dataset represents one part of a multi-sensor airborne sampling campaign conducted by eleven different aircraft teams for ABoVE. The imagery data are provided in ENVI format along with a RGB composite image for each flight line and shapefiles showing imagery boundaries.
The L2 reflectance files in this publication were reprocessed with an updated reflectance algorithm and replace Version 2 of this dataset.
Project: Arctic-Boreal Vulnerability Experiment
The Arctic-Boreal Vulnerability Experiment (ABoVE) is a NASA Terrestrial Ecology Program field campaign being conducted in Alaska and western Canada, for 8 to 10 years, starting in 2015. Research for ABoVE links field-based, process-level studies with geospatial data products derived from airborne and satellite sensors, providing a foundation for improving the analysis, and modeling capabilities needed to understand and predict ecosystem responses to, and societal implications of, climate change in the Arctic and Boreal regions.
Related Publication
Miller, Charles E., Robert O. Green, David R. Thompson, Andrew J. Thorpe, Michael L. Eastwood, Ian B. McCubbin, Winston Oslon-Duvall, Michael A. Bernas, Charles M. Sarture, Luis M. Rios, M. A. Hernandez, Brian D. Bue, Sarah R. Lundeen, Ryan Pavlick, John W. Chapman, Philip G. Brodrick, Regina F. Eckert, Red Willow Coleman, Latha Baskaran, Clayton Elder, Philip A. Townsend, Kyle R. Kovach, Shawn P. Serbin, Karl F. Huemmrich, Peter R. Nelson, Uma Bhatt, Matthew J. Macander, Debjani Singh, Michele Thornton, Daryl Yang, Isla Myers-Smith, Scott J. Goetz, Elizabeth Hoy, Elizabeth Larson, Dan Hodkinson, Hank Margolis, Michael Falkowski, Andrew Applejohn, Peter C. Griffith. Airborne imaging spectroscopy surveys of Alaska and northwestern Canada 2017-2023, Nature Scientific Data, (2025) 12:692. https://doi.org/10.1038/s41597-025-04898-w
Related Dataset
Miller, C.E., R.O. Green, D.R. Thompson, A.K. Thorpe, M. Eastwood, I.B. Mccubbin, W. Olson-Duvall, M. Bernas, C.M. Sarture, S. Nolte, L.M. Rios, M.A. Hernandez, B.D. Bue, and S.R. Lundeen. 2022. ABoVE: Hyperspectral Imagery AVIRIS-NG, Alaskan and Canadian Arctic, 2017-2019 V2. ORNL DAAC, Oak Ridge, Tennessee, USA. https://doi.org/10.3334/ORNLDAAC/2009
- This is version 2 of this dataset. L1B and L2 files for 2017 are available herein.
Acknowledgements:
This study was funded by NASA's Arctic-Boreal Vulnerability Experiment (Grant number: NNX17AE44G).
Data Characteristics
Spatial Coverage: Alaskan and Canadian Arctic within the ABoVE Domain (2017-2019, 2022); Iceland (2021)
Spatial Resolution: Approximately 5 meter
Temporal Coverage: 2017-06-24 to 2022-08-19; growing seasons of 2017, 2018, 2019, 2021, and 2022
Temporal Resolution: Areas were surveyed once during a given year
Study Area (All latitude and longitude are given in decimal degrees)
| Study Area | Northern Extent | Western Extent | Eastern Extent | Southern Extent |
|---|---|---|---|---|
|
Alaska and Canada |
71.380 | -166.651 | -93.104 | 53.529 |
| Iceland | 66.044 | -22.380 | -16.459 | 63.488 |
Data File Information
This dataset includes 2,521 data files. There are 1,673 files in ENVI binary image format (compressed in *.tar.gz format), 843 RGB composite image images in JPEG or PNG format, and 5 shapefiles (compressed in *.zip archives) providing the boundaries for the imagery captured for each flight line.
Level 1 (L1) radiance and Level 2 (L2) reflectance measurements are provided in separate gzip compressed TAR files, and the data are provided in ENVI format.
Files for each flight line use a specific base filename prefix: angYYYYMMDDthhmmss, which encodes the date and time of the flight. This prefix is used for the TAR filenames and the filenames for the ENVI files contained therein.
- YYYY : Year of flight
- MM : Month of flight
- DD : Day of flight
- hh: UTC hour at start of flight
- mm: UTC minute at start of flight
- ss: UTC second at start of flight
File Naming Conventions
- L1 radiance: angYYYYMMDDthhmmss.tar.gz
- L2 reflectance: angYYYYMMDDthhmmss_rfl.tar.gz, where "rfl" denotes reflectance
- RGB composite image: angYYYYMMDDthhmmss_RGB.jpeg or angYYYYMMDDthhmmss_rdn_VVVV_img.png, where VVVV is the version number.
- Image boundaries: above_avirisng_boundaries_YYYY.zip, where YYYY indicates year of sampling: 2017, 2018, 2019, 2021, or 2022. These Zip archives hold shapefiles with polygons outlining image footprints.
Example file names for a single flight:
- ang20170624t181530_RGB.jpeg
- ang20170624t181530.tar.gz
- ang20170624t182330_rfl.tar.gz
ENVI file user notes:
- The binary ENVI image files have no extension and are accompanied by a header file (*.hdr) of the same name in text format. The header files should remain in the same directory as the image files for the data to be displayed properly.
- Header files provide spatial and spectral metadata related to the image file such as the number of lines, samples, channels, data ignore value, and map projection.
- No Data are coded as -9999
L1 Radiance Files (e.g. ang20170817t185348.tar.gz)
Each TAR contains six pairs of ENVI binary image files (no extension) and accompanying header files (*.hdr). In the filenames, "rdn" indicates radiance, and VVVV is the versioning number (e.g., "v2p9").
1) Calibrated radiance data: angYYYYMMDDtHHNNSS_rdn_VVVV_img (& .hdr)
- Level 1 calibrated radiance from AVIRIS-NG
- Units: microwatts per centimeter squared per nanometer per steradian (µW cm-2 nm-1 sr-1)
- 425 bands
- 5-nm intervals in the visible to shortwave infrared spectral range from 380 to 2510 nm
2) Geometric lookup table (GLT): angYYYYMMDDtHHNNSS_rdn_VVVV_glt (& .hdr)
- Provides information about which original pixel occupies which output pixel in the final product
- Positive values indicate real data; negative values indicate nearest-neighbor filled data
- 2 bands:
- Sample number
- Original line number
3) Input geometry file: angYYYYMMDDtHHNNSS_rdn_VVVV_igm (& .hdr)
- Contains UTM ground locations in meters for each pixel in the corresponding unorthocorrected radiance image
- See map info line in header file for UTM zone.
- 3 bands:
- UTM easting (m)
- UTM northing (m)
- Estimated ground elevation at each pixel center (m)
4) Pixel location file: angYYYYMMDDtHHNNSS_rdn_VVVV_loc (& .hdr)
- Latitude/longitude pixel locations in WGS84 for each pixel in the corresponding unorthocorrected radiance image
- 3 bands:
- WGS84 longitude (decimal degrees)
- WGS84 latitude (decimal degrees)
- Estimated ground elevation at each pixel center (m)
5) Observation parameters (unorthocorrected): angYYYYMMDDtHHNNSS_rdn_VVVV_obs (& .hdr)
- Observation parameters in the raw spatial format; matches corresponding unorthocorrected radiance image.
- 11 bands:
- path length (sensor-to-ground in meters)
- to-sensor-azimuth (0 to 360 degrees clockwise from N)
- to-sensor-zenith (0 to 90 degrees from zenith)
- to-sun-azimuth (0 to 360 degrees clockwise from N)
- to-sun-zenith (0 to 90 degrees from zenith)
- solar phase (degrees between to-sensor and to-sun vectors in principal plane)
- slope (local surface slope as derived from DEM in degrees)
- aspect (local surface aspect 0 to 360 degrees clockwise from N)
- cosine i (apparent local illumination factor based on DEM slope and aspect and to-sun vector, -1 to 1)
- UTC time (decimal hours for mid-line pixels)
- Earth-sun distance (AU)
6) Orthocorrected observation parameters: angYYYYMMDDtHHNNSS_rdn_VVV_obs_ort (& .hdr)
- Observation parameter file that has been rendered using the GLT and matches the orthocorrected imagery.
- 11 bands (same as unorthocorrected; see above)
L2 Reflectance Files (e.g. ang20170817t185348_rfl.tar.gz)
Each TAR contains one ENVI binary file (no extension) and its accompanying header file (*.hdr): angYYYYMMDDtHHNNSS_rfl (& .hdr)
- Orthocorrected and atmospherically corrected surface reflectance (Gao et al., 1993; Thompson et al., 2015)
- 425 bands in 5-nm intervals in the visible to shortwave infrared spectral range from 380 to 2510 nm
Application and Derivation
Spectra measured by AVIRIS-NG are used to identify, measure, and monitor constituents of the Earth's surface and atmosphere. Ecological applications include species composition, structure, and function; chlorophyll, leaf water, lignin, cellulose, pigment, and non-photosynthetic constituent content.
AVIRIS-NG was flown over the ABoVE domain (Figure 2) to characterize ecosystem structure and function near the height of the growing season during June - July of 2017 and July - August of 2018, 2019, and 2022. In August 2021, flights occurred over Iceland (Figure 2).
Quality Assessment
All AVIRIS-NG data are processed by the AVIRIS-NG instrument ground data system at NASA Jet Propulsion Laboratory. Anomalies that were not detected by pre- and post-flight diagnostics are detected through sensor performance evaluation based on a preliminary analysis of the data.
Pixels that were infilled through nearest neighbor interpolation are denoted by a negative value in the GLT file for each flight line (see Section 2).
Valid values for L2 reflectance range 0.0 to 1.0.
Data Acquisition, Materials, and Methods
Airborne Visible/Infrared Imaging Spectrometer-Next Generation (AVIRIS-NG) is an imaging spectrometer that measures reflected radiance at 5-nm intervals in the visible to shortwave infrared spectral range from 380-2510 nm. AVIRIS-NG was built to support NASA science and applications measuring spectra as images that record the interaction of light with matter. These spectra are used to identify, measure, and monitor constituents of the Earths surface and atmosphere.
See Thompson et al. (2015) and Gao et al. (1993) for an explanation of L2 surface reflectance derivation from AVIRIS L1 radiance measurements.
AVIRIS-NG was flown on a King Air B200 between June and August 2017 and again in July and August 2018 and July and August 2019 as part of an extensive airborne campaign designed to provide data useful for characterizing ecosystem structure and function near the height of the growing season. Flight locations and additional metadata can be viewed at the AVIRIS-NG Data Portal. Flight paths are depicted in Figure 2.
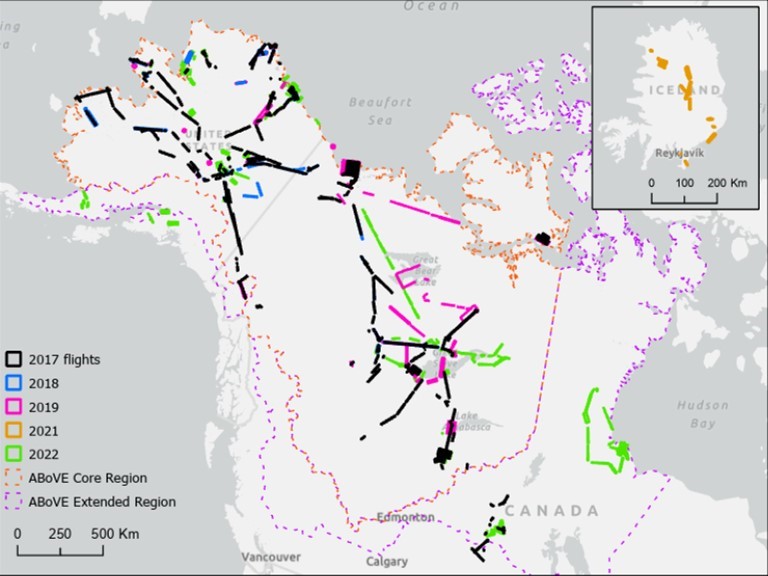
Figure 2. ABoVE flight paths of the AVIRIS-NG instrument during 2017, 2018, 2019, 2021, and 2022. Filghts in 2021 occurred over Iceland (inset).
The ABoVE AVIRIS-NG data enabled numerous studies during Phases 1 and 2 of the ABoVE project. Examples include assessing boreal forest fuel loading (Badola et al., 2022; Smith et al., 2021); methane emissions from wetlands (Elder et al., 2020; Elder et al., 2021; Baskaran et al., 2022), beaver hydraulic engineering (Clark et al., 2023), tundra fire burned areas (Yoseph et al., 2023), and tar sands oil production facilities (Borchardt et al., 2021). The ABoVE team has also made significant progress comparing vegetation classifications and traits derived from AVIRIS-NG compared to the values retrieved from centimeter-resolution uncrewed aerial vehicle (UAV) sensors (Nelson et al., 2022; Wang et al., 2023; Yang et al., 2023). Many additional studies and multi-sensor synthesis efforts are underway as part of Phase 3 activities.
Data Access
These data are available through the Oak Ridge National Laboratory (ORNL) Distributed Active Archive Center (DAAC).
ABoVE: AVIRIS-NG Imaging Spectroscopy for Alaska, Canada, and Iceland, 2017-2022, V3
Contact for Data Center Access Information:
- E-mail: uso@daac.ornl.gov
- Telephone: +1 (865) 241-3952
References
Badola, A., S.K. Panda, D.A. Roberts, C.F. Waigl, R.R. Jandt, and U.S. Bhatt. 2022. A novel method to simulate AVIRIS-NG hyperspectral image from Sentinel-2 image for improved vegetation/wildfire fuel mapping, boreal Alaska. International Journal of Applied Earth Observation and Geoinformation 112:102891. https://doi.org/10.1016/j.jag.2022.102891
Baskaran, L., C. Elder, A.A. Bloom, S. Ma, D. Thompson, and C.E. Miller. 2022. Geomorphological patterns of remotely sensed methane hot spots in the Mackenzie Delta, Canada. Environmental Research Letters 17:015009. https://doi.org/10.1088/1748-9326/ac41fb
Borchardt, J., K. Gerilowski, S. Krautwurst, H. Bovensmann, A.K. Thorpe, D.R. Thompson, C. Frankenberg, C.E. Miller, R.M. Duren, and J.P. Burrows. 2021. Detection and quantification of CH4 plumes using the WFM-DOAS retrieval on AVIRIS-NG hyperspectral data. Atmospheric Measurement Techniques 14:1267-1291. https://doi.org/10.5194/amt-14-1267-2021
Clark, J.A., K.D. Tape, L. Baskaran, C. Elder, C. Miller, K. Miner, J.A. O’Donnell, and B.M. Jones. 2023. Do beaver ponds increase methane emissions along Arctic tundra streams? Environmental Research Letters 18:075004. https://doi.org/10.1088/1748-9326/acde8e
Elder, C.D., D.R. Thompson, A.K. Thorpe, P. Hanke, K.M. Walter Anthony, and C.E. Miller. 2020. Airborne mapping reveals emergent power law of arctic methane emissions. Geophysical Research Letters 47:e2019GL085707. https://doi.org/10.1029/2019GL085707
Elder, C.D., D.R. Thompson, A.K. Thorpe, H.A. Chandanpurkar, P.J. Hanke, N. Hasson, S.R. James, B.J. Minsley, N.J. Pastick, D. Olefeldt, K.M. Walter Anthony, and C.E. Miller. 2021. Characterizing methane emission hotspots from thawing permafrost. Global Biogeochemical Cycles 35:e2020GB006922. https://doi.org/10.1029/2020GB006922
Gao, B.-C., K.B. Heidebrecht, and A.F. H. Goetz. 1993. Derivation of scaled surface reflectances from AVIRIS data. Remote Sensing of Environment 44:165–178. https://doi.org/10.1016/0034-4257(93)90014-O
Miller, Charles E., Robert O. Green, David R. Thompson, Andrew J. Thorpe, Michael L. Eastwood, Ian B. McCubbin, Winston Oslon-Duvall, Michael A. Bernas, Charles M. Sarture, Luis M. Rios, M. A. Hernandez, Brian D. Bue, Sarah R. Lundeen, Ryan Pavlick, John W. Chapman, Philip G. Brodrick, Regina F. Eckert, Red Willow Coleman, Latha Baskaran, Clayton Elder, Philip A. Townsend, Kyle R. Kovach, Shawn P. Serbin, Karl F. Huemmrich, Peter R. Nelson, Uma Bhatt, Matthew J. Macander, Debjani Singh, Michele Thornton, Daryl Yang, Isla Myers-Smith, Scott J. Goetz, Elizabeth Hoy, Elizabeth Larson, Dan Hodkinson, Hank Margolis, Michael Falkowski, Andrew Applejohn, Peter C. Griffith. Airborne imaging spectroscopy surveys of Alaska and northwestern Canada 2017-2023, Nature Scientific Data, (2025) 12:692. https://doi.org/10.1038/s41597-025-04898-w
Miller, C.E., R.O. Green, D.R. Thompson, A.K. Thorpe, M. Eastwood, I.B. Mccubbin, W. Olson-Duvall, M. Bernas, C.M. Sarture, S. Nolte, L.M. Rios, M.A. Hernandez, B.D. Bue, and S.R. Lundeen. 2022. ABoVE: Hyperspectral Imagery AVIRIS-NG, Alaskan and Canadian Arctic, 2017-2019 V2. ORNL DAAC, Oak Ridge, Tennessee, USA. https://doi.org/10.3334/ORNLDAAC/2009
Nelson, P., D. Paradis, and W. Hantson. 2021. Scaling ground-based hyperspectral scans to AVIRIS next gen using UAV-based VNIR imaging spectroscopy for mapping arctic and boreal plants in Alaska. ESS Open Archive. https://doi.org/10.1002/essoar.10508608.1
Smith, C.W., S.K. Panda, U.S. Bhatt, and F.J. Meyer. 2021. Improved Boreal Forest Wildfire Fuel Type Mapping in Interior Alaska Using AVIRIS-NG Hyperspectral Data. Remote Sensing 13:897. https://doi.org/10.3390/rs13050897
Thompson, D.R., B.C. Gao, R.O. Green, P.E. Dennison, D.A. Roberts, and S. Lundeen. 2015. Atmospheric correction for global mapping spectroscopy: ATREM advances for the HyspIRI preparatory campaign. Remote Sensing of Environment 167:64-77. https://doi.org/10.1016/j.rse.2015.02.010
Wang, C., T.M. Pavelsky, E.D. Kyzivat, F. Garcia-Tigreros, E. Podest, F. Yao, X. Yang, S. Zhang, C. Song, T. Langhorst, W. Dolan, M.R. Kurek, M.E. Harlan, L.C. Smith, D.E. Butman, R.G. M. Spencer, C.J. Gleason, K.P. Wickland, R.G. Striegl, and D.L. Peters. 2023. Quantification of wetland vegetation communities features with airborne AVIRIS-NG, UAVSAR, and UAV LiDAR data in Peace-Athabasca Delta. Remote Sensing of Environment 294:113646. https://doi.org/10.1016/j.rse.2023.113646
Yang, D., B.D. Morrison, W. Hanston, A. McMahon, L. Baskaran, D.J. Hayes, C.E. Miller, and S.P. Serbin. 2023. Integrating very-high-resolution UAS data and airborne imaging spectroscopy to map the fractional composition of Arctic plant functional types in Western Alaska. Remote Sensing of Environment 286:113430. https://doi.org/10.1016/j.rse.2022.113430
Yoseph, E., E. Hoy, C.D. Elder, S.M. Ludwig, D.R. Thompson, and C.E. Miller. 2023. Tundra fire increases the likelihood of methane hotspot formation in the Yukon–Kuskokwim Delta, Alaska, USA. Environmental Research Letters 18:104042. https://doi.org/10.1088/1748-9326/acf50b
Dataset Revisions
| Version | Release Date | Revision Notes |
|---|---|---|
| 3.0 | 2024-09-27 | L2 reflectance files for 2018 and 2019 were reprocessed using an updated reflectance algorithm for this version. L1B radiance files for 2018-2019 were not changed and are same as in version 2. L1B and L2 data were added for 2021 and 2022. |
| 2.0 | 2022-11-17 | This dataset (Miller et al., 2022) was revised on November 17, 2022 to include additional flight lines. In addition, data providers reprocessed all L2 ABoVE data from 2017-2019 seasons using an updated reflectance algorithm. As a result, all Level 2 files were replaced with this release. RGB images and boundary shapefiles were moved from companion files to distribution with the main dataset. https://doi.org/10.3334/ORNLDAAC/2009 |
| 1.2 | - | This dataset was revised in May 2021 to include flights from the 2019 ABoVE airborne campaign. There were no changes to the previously provided data from 2017 and 2018 flights. |
| 1.1 | - | This dataset was revised in Feb. 2019 to include flights from the 2018 ABoVE airborne campaign. There were no changes to the previously provided data from 2017 flights. |
| 1.0 | 2018-04-23 | Included flights for 2017 from the 2017 ABoVE airborne campaign. |