Documentation Revision Date: 2021-05-26
Dataset Version: 1.2
Summary
This dataset includes 1,695 data files for 556 flight lines in ENVI binary image format (compressed in *.tar.gz format) and six zipped companion files containing: 1) an RGB composite image for each flight line, and 2) a shapefile providing the boundaries for the imagery captured for each flight line for flights in 2017, 2018 and 2019.
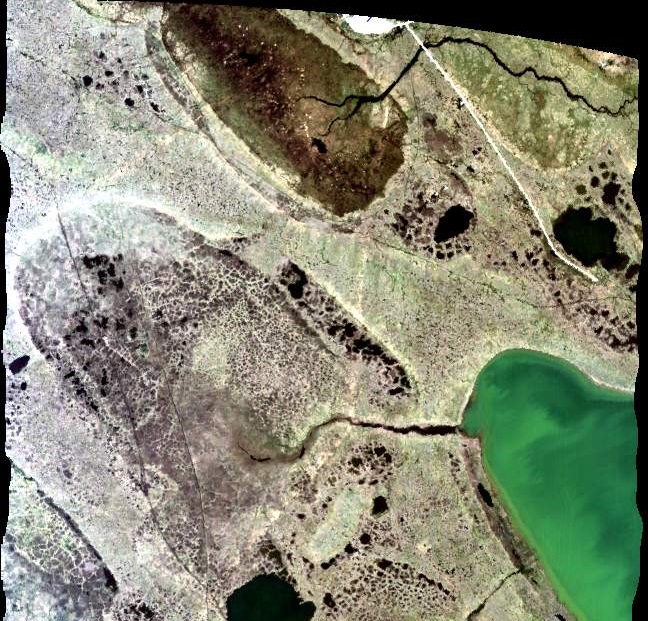
Figure 1. A portion of the quicklook image from flight line ang20170714t212855 over Barrow, Alaska on July 14, 2017. Two sites (AB_B10_L001_FL175_PipelineLake and AB_B10_L003_FL175_PipelineLake) of interest to the ABoVE project are visible. Flight altitude was approximately 5,400 m with very thin cirrus cloud cover.
Citation
Miller, C.E., R.O. Green, D.R. Thompson, A.K. Thorpe, M. Eastwood, I.B. Mccubbin, W. Olson-duvall, M. Bernas, C.M. Sarture, S. Nolte, L.M. Rios, M.A. Hernandez, B.D. Bue, and S.R. Lundeen. 2019. ABoVE: Hyperspectral Imagery from AVIRIS-NG, Alaskan and Canadian Arctic, 2017-2019. ORNL DAAC, Oak Ridge, Tennessee, USA. https://doi.org/10.3334/ORNLDAAC/1569
Table of Contents
- Dataset Overview
- Data Characteristics
- Application and Derivation
- Quality Assessment
- Data Acquisition, Materials, and Methods
- Data Access
- References
- Dataset Revisions
Dataset Overview
This dataset provides Level 1 radiance and Level 2 surface reflectance measured by the Airborne Visible/Infrared Imaging Spectrometer-Next Generation (AVIRIS-NG) instrument during flights over the Arctic-Boreal Vulnerability Experiment (ABoVE) domain from June to August 2017 and July to August 2019. AVIRIS-NG measures reflected radiance at 5-nanometer (nm) intervals in the visible to shortwave infrared spectral range between 380 and 2510 nm. Measurements are radiometrically and geometrically calibrated and provided at approximately 5-meter spatial resolution. The data include 556 flight lines covering areas of interest to the ABoVE campaign over much of Alaska and western Canada. These data will allow researchers to characterize ecosystem structure and function near the height of the growing season. This dataset represents one part of a multisensor airborne sampling campaign conducted by eleven different aircraft teams for ABoVE.
Project: Arctic-Boreal Vulnerability Experiment
The Arctic-Boreal Vulnerability Experiment (ABoVE) is a NASA Terrestrial Ecology Program field campaign based in Alaska and western Canada between 2016 and 2021. Research for ABoVE links field-based, process-level studies with geospatial data products derived from airborne and satellite sensors, providing a foundation for improving the analysis and modeling capabilities needed to understand and predict ecosystem responses and societal implications.
Acknowledgements:
This study was funded by NASA's Arctic-Boreal Vulnerability Experiment (Grant number: NNX17AE44G).
Data Characteristics
Spatial Coverage: Flights over the Alaskan and Canadian Arctic within the ABoVE Domain
Spatial Resolution: approximately 5-meter
Temporal Coverage: 2017-06-24 to 2019-08-04
Temporal Resolution: Areas were surveyed once
Study Area (These coordinates are the approximate locations of the study sites and may not match the extent of the data files. All latitude and longitude are given in decimal degrees.)
| Site | Northern Extent | Western Extent | Eastern Extent | Southern Extent |
|---|---|---|---|---|
|
ABoVE Domain |
71.380 | -166.651 | -103.404 | 52.160 |
Data File Information
There are 1,695 compressed tar archives (TAR; *.tar.gz) providing data from the AVIRIS-NG instrument for the 556 flight lines included in this dataset. Level 1 (L1) radiance measurements and Level 2 (L2) reflectance measurements are provided for each flight in ENVI binary image format. L1 and L2 measurements for each flight line are contained in separate TAR files.
Example TAR filenames:
- L1 radiance: ang20170817t185348.tar.gz
- L2 reflectance: ang20170817t185348rfl.tar.gz
TAR archive contents:
The ENVI image files have no extension and are accompanied by a header file (*.hdr) of the same name in text format. The header files should remain in the same directory as the image files for the data to be displayed properly. Header files provide spatial and spectral metadata related to the image file such as the number of lines, samples, channels, etc. Please see the Harris Geospatial reference for the ENVI file format for more detailed information on the header files.
Each TAR contains a README describing the content of the L1 and L2 ENVI files. There are minor discrepancies between the filenames listed in the README and the actual ENVI image filenames. Use the file descriptions outlined below for reference.
File Naming Convention
Each flight line uses a specific base filename prefix: angYYYYMMDDtHHNNSS. The datetime codes outlined below apply to TAR filenames and the filenames for the ENVI files contained within.
- YYYY : Year of flight
- MM : Month of flight
- DD : Day of flight
- HH : UTC hour at start of flight
- NN : UTC minute at start of flight
- SS : UTC second at start of flight
ENVI file user notes:
- NoData are coded as -9999
- No L2 reflectance data is provided for the flight line ang20170713t210131 due to an error during processing from L1 to L2.
L1 Radiance Files
(e.g. ang20170817t185348.tar.gz)
Each TAR contains six pairs of ENVI binary image files (no extension) and accompanying header files (*.hdr) related to Level 1 measurements from the AVIRIS-NG instrument:
1) Calibrated radiance data: angYYYYMMDDtHHNNSS_rdn_VVV_img (& .hdr)
- Level 1 calibrated radiance from AVIRIS-NG
- Units: microwatts per centimeter squared per nanometer per steradian (µW cm-2 nm-1 sr-1)
- 425 bands
- 5-nm intervals in the visible to shortwave infrared spectral range from 380 to 2510 nm
2) Geometric lookup table (GLT): angYYYYMMDDtHHNNSS_rdn_VVV_glt (& .hdr)
- Provides information about which original pixel occupies which output pixel in the final product
- Positive values indicate real data; negative values indicate nearest-neighbor filled data
- 2 bands:
- Sample number
- Original line number
3) Input geometry file: angYYYYMMDDtHHNNSS_rdn_VVV_igm (& .hdr)
- Contains UTM ground locations in meters for each pixel in the corresponding unorthocorrected radiance image
- 3 bands:
- UTM easting (m)
- UTM northing (m)
- Estimated ground elevation at each pixel center (m)
4) Pixel location file: angYYYYMMDDtHHNNSS_rdn_VVV_loc (& .hdr)
- Latitude/longitude pixel locations in WGS84 for each pixel in the corresponding unorthocorrected radiance image
- 3 bands:
- WGS84 longitude (decimal degrees)
- WGS84 latitude (decimal degrees)
- Estimated ground elevation at each pixel center (m)
5) Observation parameters (unorthocorrected): angYYYYMMDDtHHNNSS_rdn_VVV_obs (& .hdr)
- Observation parameters in the raw spatial format; matches corresponding unorthocorrected radiance image.
- 11 bands:
- path length (sensor-to-ground in meters)
- to-sensor-azimuth (0 to 360 degrees clockwise from N)
- to-sensor-zenith (0 to 90 degrees from zenith)
- to-sun-azimuth (0 to 360 degrees clockwise from N)
- to-sun-zenith (0 to 90 degrees from zenith)
- solar phase (degrees between to-sensor and to-sun vectors in principal plane)
- slope (local surface slope as derived from DEM in degrees)
- aspect (local surface aspect 0 to 360 degrees clockwise from N)
- cosine i (apparent local illumination factor based on DEM slope and aspect and to-sun vector, -1 to 1)
- UTC time (decimal hours for mid-line pixels)
- Earth-sun distance (AU)
6) Orthocorrected observation parameters: angYYYYMMDDtHHNNSS_rdn_VVV_obs_ort (& .hdr)
- Observation parameter file that has been rendered using the GLT and matches the orthocorrected imagery.
- 11 bands (same as unorthocorrected; see above)
L2 Reflectance Files
(e.g. ang20170817t185348rfl.tar.gz)
Each TAR contains two pairs of ENVI binary image files (no extension) and accompanying header files (*.hdr) related to Level 2 measurements from the AVIRIS-NG instrument:
1) Orthocorrected and atmospherically corrected reflectance data: angYYYYMMDDtHHNNSS_corr_VVV_img (& .hdr)
- Atmospherically corrected water-leaving reflectance (Gao et al. 1993; Thompson et al. 2015)
- 425 bands
- 5-nm intervals in the visible to shortwave infrared spectral range from 380 to 2510 nm
2) Orthocorrected water absorption data: angYYYYMMDDtHHNNSS_h2o_VVV_img (& .hdr)
- Retrieved column water vapor and optical absorption paths for liquid H2O and ice
- 3 bands:
- Column water vapor (cm)
- Total liquid H2O absorption path (cm)
- Total ice absorption path (cm)
Companion Files
An RGB composite image is provided in JPEG format for each flight line (556 total) in three companion zip archives above_aviris_quicklooks_<YYYY>.zip and a shapefile containing the flight line boundaries is provided in three companion zip archives above_aviris_boundaries_<YYYY>.zip, where <YYYY> is the year of the flight campaign.
Application and Derivation
Spectra measured by AVIRIS-NG are used to identify, measure, and monitor constituents of the Earth's surface and atmosphere. Ecological applications include species composition, structure, and function; chlorophyll, leaf water, lignin, cellulose, pigment, and non-photosynthetic constituent content.
AVIRIS-NG was flown during June, July, and August of 2017, July and August of 2018, and July and August of 2019 over the ABoVE domain to characterize ecosystem structure and function near the height of the growing season.
Quality Assessment
All AVIRIS-NG data are processed by the AVIRIS-NG instrument ground data system at NASA Jet Propulsion Laboratory. Anomalies that were not detected by pre- and post-flight diagnostics are detected through sensor performance evaluation based on a preliminary analysis of the data.
Pixels that were infilled through nearest neighbor interpolation are denoted by a negative value in the GLT file for each flight line (see Section 2).
Data Acquisition, Materials, and Methods
Airborne Visible/Infrared Imaging Spectrometer-Next Generation (AVIRIS-NG) is an imaging spectrometer that measures reflected radiance at 5-nm intervals in the visible to shortwave infrared spectral range from 380-2510 nm. AVIRIS-NG was built to support NASA science and applications measuring spectra as images that record the interaction of light with matter. These spectra are used to identify, measure, and monitor constituents of the Earths surface and atmosphere.
See Thompson et al. (2015) and Gao et al. (1993) for an explanation of L2 surface reflectance derivation from AVIRIS L1 radiance measurements.
AVIRIS-NG was flown on a King Air B200 between June and August 2017 and again in July and August 2018 and July and August 2019 as part of an extensive airborne campaign designed to provide data useful for characterizing ecosystem structure and function near the height of the growing season. Flight locations and additional metadata can be viewed at the AVIRIS-NG Data Portal. Flight paths are depicted on the map in Figure 2.
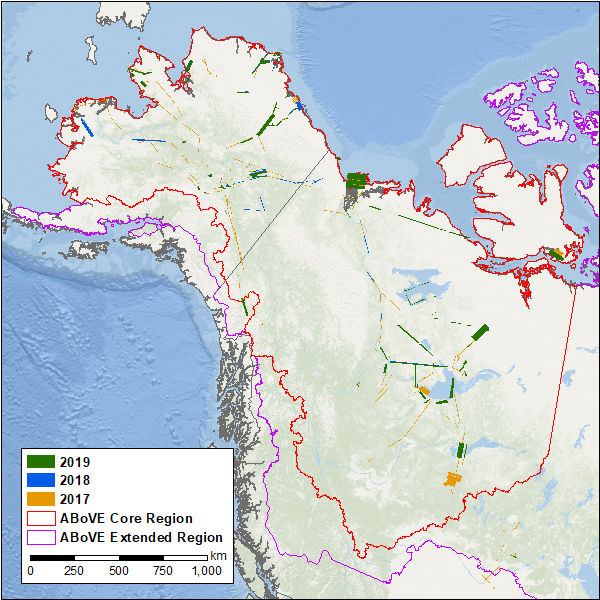
Figure 2. ABoVE flight paths of the AVIRIS-NG instrument during 2017, 2018 and 2019.
Data Access
These data are available through the Oak Ridge National Laboratory (ORNL) Distributed Active Archive Center (DAAC).
ABoVE: Hyperspectral Imagery from AVIRIS-NG, Alaskan and Canadian Arctic, 2017-2019
Contact for Data Center Access Information:
- E-mail: uso@daac.ornl.gov
- Telephone: +1 (865) 241-3952
References
Gao, B.C., K.H. Heidebrecht, and A.F.H. Goetz. 1993. Derivation of scaled surface reflectances from AVIRIS data, Remote Sens. Env., 44, 165-178. https://doi.org/10.1016/0034-4257(93)90014-O
Thompson, D.R., B.C. Gao, R.O. Green, P.E. Dennison, D.A. Roberts, and S. Lundeen. 2015. Atmospheric Correction for Global Mapping Spectroscopy: ATREM Advances for the HyspIRI Preparatory Campaign. Remote Sens. of Env., 167: 64-77. https://doi.org/10.1016/j.rse.2015.02.010
Dataset Revisions
Version 1.2: This dataset was revised in May 2021 to include flights from the 2019 ABoVE airborne campaign. There were no changes to the previously provided data from 2017 and 2018 flights.
Version 1.1: This dataset was revised in Feb. 2019 to include flights from the 2018 ABoVE airborne campaign. There were no changes to the previously provided data from 2017 flights.
Version 1.0: Included flights for 2017 from the 2017 ABoVE airborne campaign.