Documentation Revision Date: 2022-05-04
Dataset Version: 1
Summary
There are 40 data files in ICARTT format (*.ict) included in this dataset
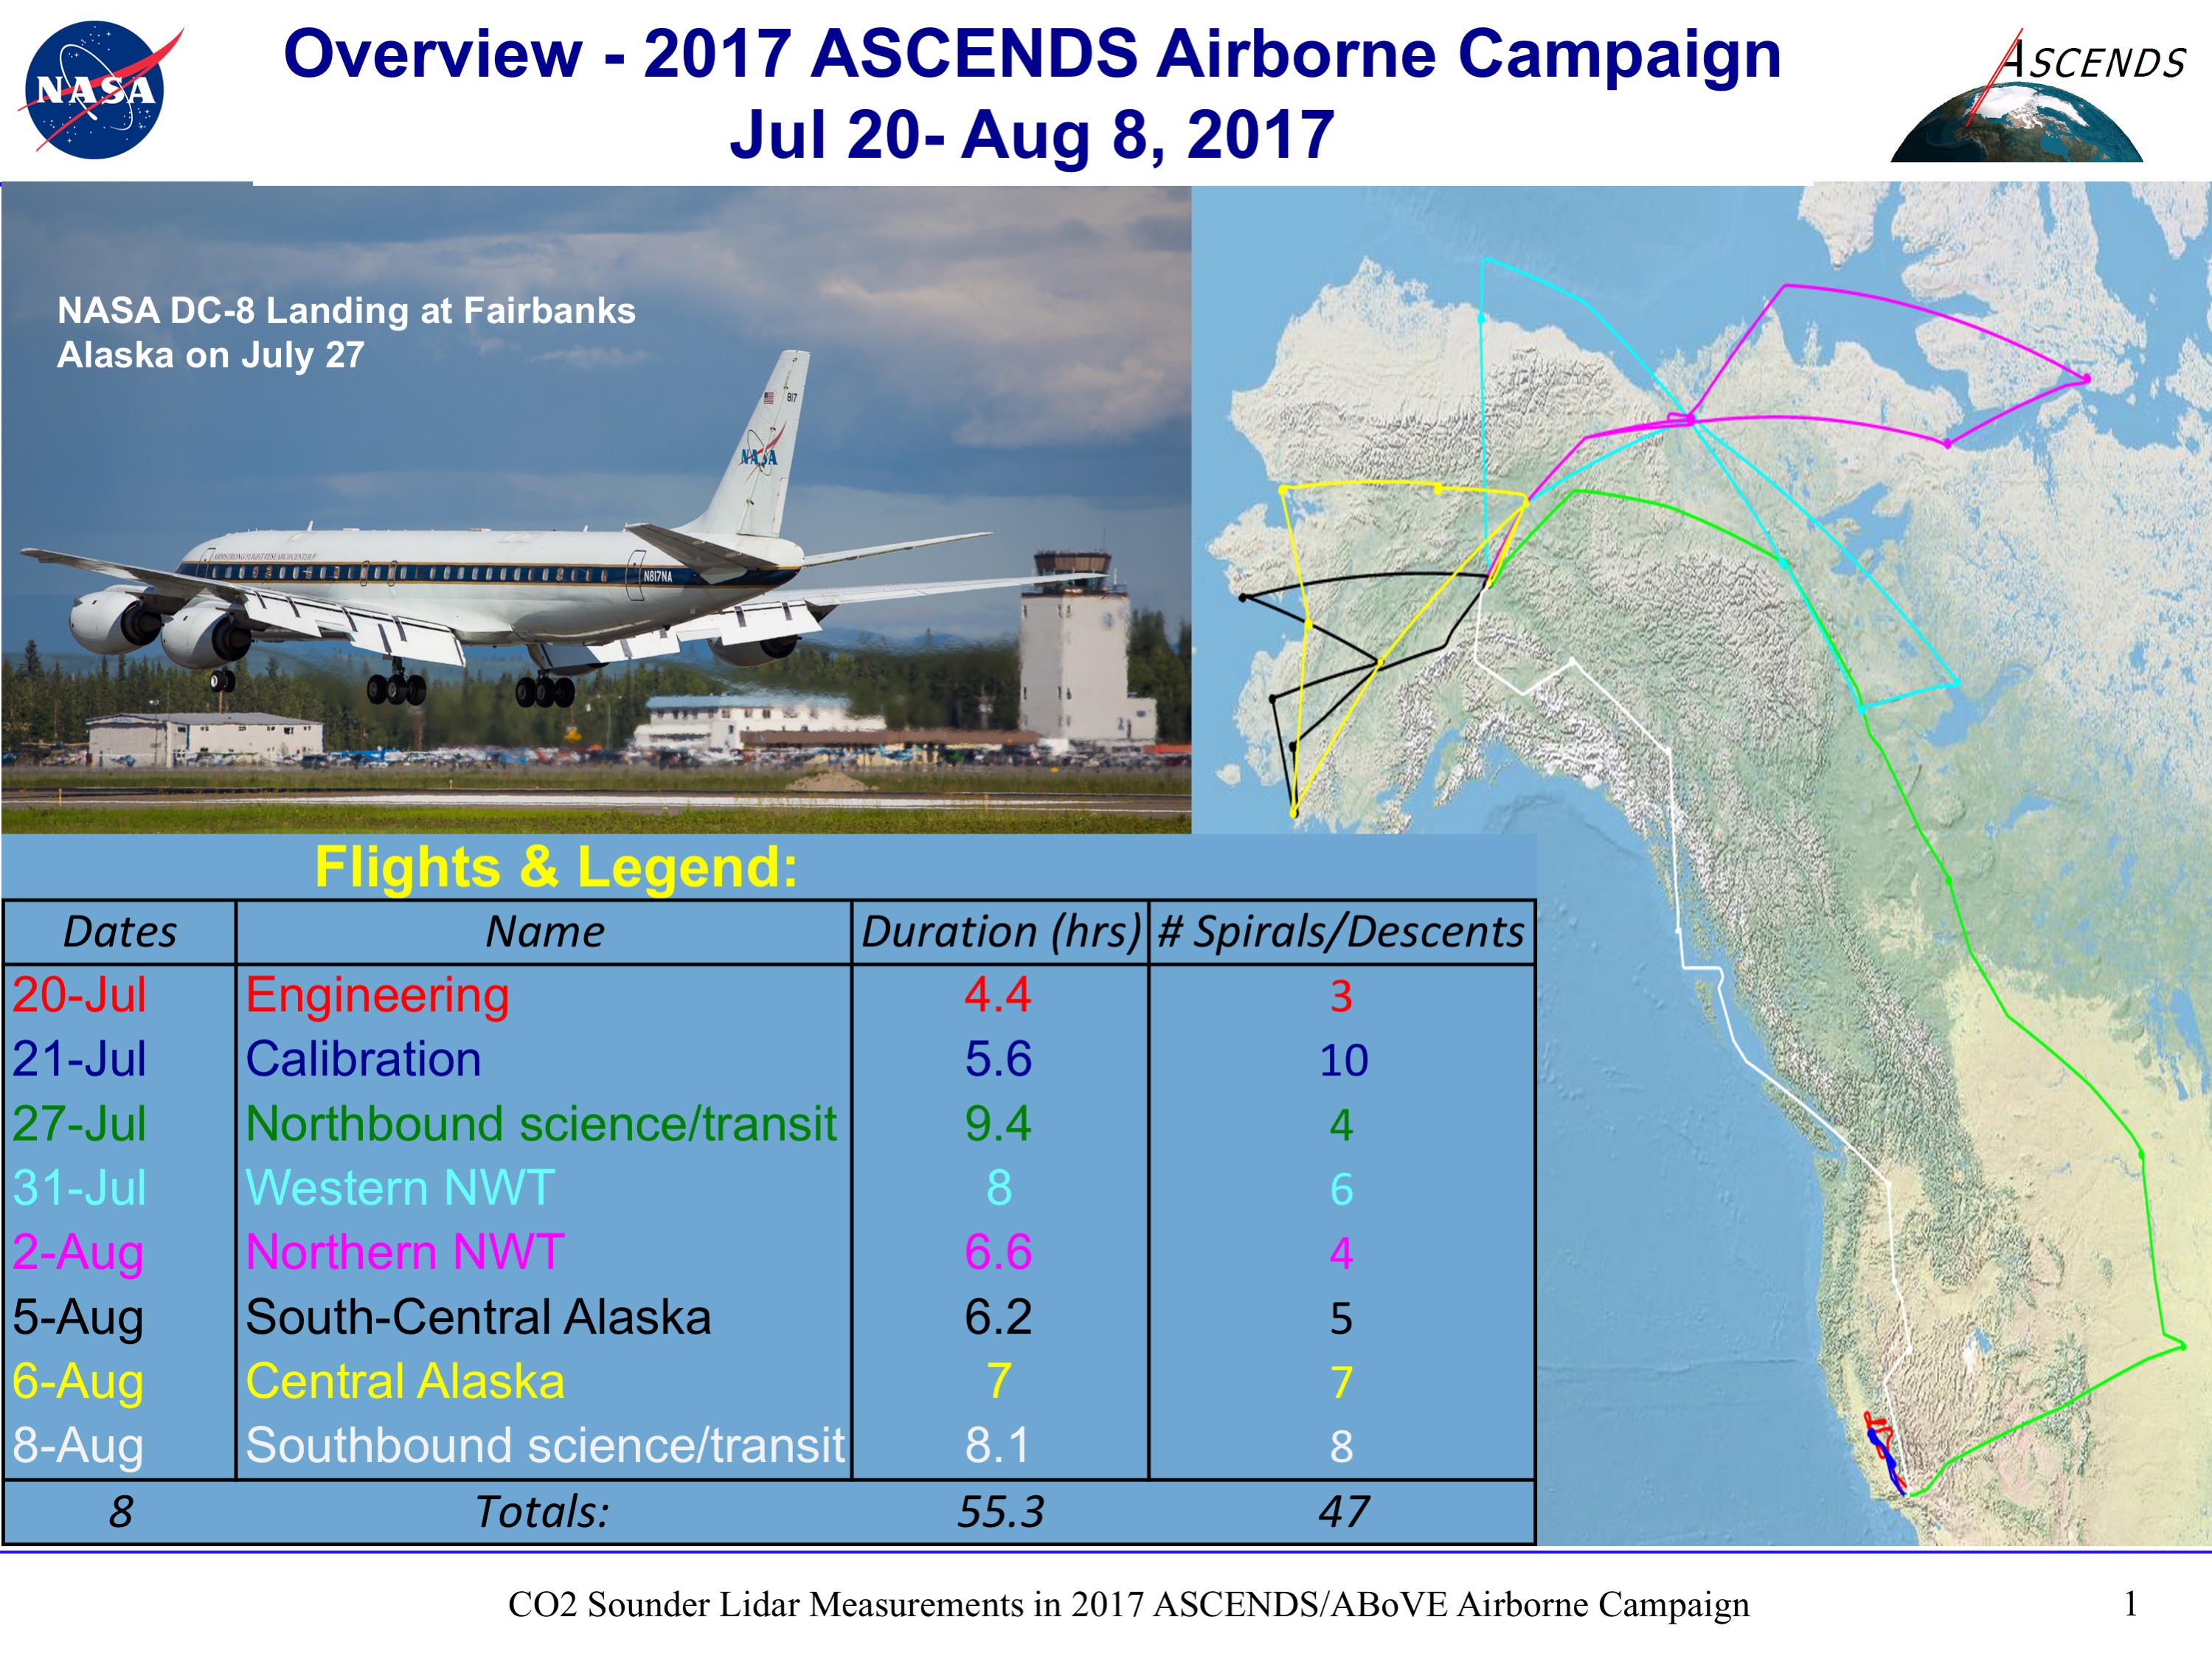
Figure 1. A map showing the ground tracks for the airborne campaign, with a table summarizing each flight. The colors in the table match those shown in the ground tracks.
Citation
Abshire, J.B., J. Mao, H. Riris, S.R. Kawa, and X. Sun. 2022. ABoVE/ASCENDS: Active Sensing of CO2, CH4, and Water Vapor, Alaska and Canada, 2017. ORNL DAAC, Oak Ridge, Tennessee, USA. https://doi.org/10.3334/ORNLDAAC/2050
Table of Contents
- Dataset Overview
- Data Characteristics
- Application and Derivation
- Quality Assessment
- Data Acquisition, Materials, and Methods
- Data Access
- References
Dataset Overview
This dataset provides in situ airborne measurements of atmospheric carbon dioxide (CO2), methane (CH4), and water vapor concentrations, plus air temperature, pressure, relative humidity, and wind speed values over Alaska and the Yukon and Northwest Territories of Canada during 2017-07-20 to 2017-08-08. Measurements were taken on board a DC-8 aircraft during this Active Sensing of CO2 Emissions over Nights, Days, and Seasons (ASCENDS) airborne deployment over portions of the Arctic-Boreal Vulnerability Experiment (ABoVE) domain. CO2 and CH4 were measured with NASA's Atmospheric Vertical Observations of CO2 in the Earth's Troposphere (AVOCET) instrument. Water vapor and relative humidity were measured with Diode Laser Hydrometer. Measurements of column-averaged dry-air mixing ratio CO2 measurements (XCO2) were taken with the CO2 Sounder Lidar instrument. The airborne CO2 Sounder is a pulsed, multi-wavelength Integrated Path Differential Absorption lidar. It estimates XCO2 in the nadir path from the aircraft to the scattering surface by measuring the shape of the 1572.33 nm CO2 absorption line. The data were collected to capture the spatial and temporal dynamics of the northern high latitude carbon cycle as part of ABoVE.
Project: Arctic-Boreal Vulnerability Experiment
The Arctic-Boreal Vulnerability Experiment (ABoVE) is a NASA Terrestrial Ecology Program field campaign based in Alaska and western Canada between 2016 and 2021. Research for ABoVE links field-based, process-level studies with geospatial data products derived from airborne and satellite sensors, providing a foundation for improving the analysis and modeling capabilities needed to understand and predict ecosystem responses and societal implications.
Related Dataset
Sun, X., P.T. Kolbeck, J.B. Abshire, S.R. Kawa, and J. Mao. 2022. ABoVE/ASCENDS: Atmospheric Backscattering Coefficient Profiles from CO2 Sounder, 2017. ORNL DAAC, Oak Ridge, Tennessee, USA. https://doi.org/10.3334/ORNLDAAC/2051
- Provides backscatter profiles from associated measurements of XCO2.
Related Publications
Abshire, J. B., A.K. Ramanathan, H. Riris, G.R. Allan, X. Sun, W.E. Hasselbrack, J. Mao, S. Wu, J. Chen, K. Numata, S.R. Kawa, M.Y.M. Yang, and J. DiGangi. 2018. Airborne measurements of CO2 column concentrations made with a pulsed IPDA lidar using multiple-wavelength-locked laser and HgCdTe APD detector. Atmospheric Measurement Techniques (AMT) 11:2001-2025. https://doi.org/10.5194/amt-11-2001-2018
Allan, G.R., J.B. Abshire, H. Riris, J. Mao, W.E. Hasselbrack, K. Numata, J. Chen, R. Kawa, M. Rodriguez, and M. Stephen. 2018. Lidar measurements of CO2 column concentrations in the Arctic region of North America from the ASCENDS 2017 airborne campaign. SPIE Proceedings volume 10779, Lidar Remote Sensing for Environmental Monitoring XVI, 1077906 (24 October 2018). https://doi.org/10.1117/12.2325908
Sun, X., J.B. Abshire, A. Ramanathan, S.R. Kawa, and J. Mao. 2021. Retrieval algorithm for the column CO2 mixing ratio from pulsed multi-wavelength lidar measurements. Atmospheric Measurement Techniques 14:3909–3922. https://doi.org/10.5194/amt-14-3909-2021
Data Characteristics
Spatial Coverage: Alaska, U.S.; Yukon Territory and Northwest Territories, Canada
ABoVE Reference Locations
Domain: Core and extended
State/Territory: Alaska; Yukon; Northwest Territories
Grid cells: Ah000v000, Ah000v001, Ah001v000, Ah001v001, Ah001v002, Ah002v001, Ah002v002
Spatial Resolution: Point locations. At an aircraft speed of 170 knots (87.5 m/s), one 10-second averaging interval covers a distance of ~875 m. Profiles cover a vertical range from the surface up to 6 km altitude.
Temporal Coverage: 2017-07-20 to 2017-08-08 with 8 single-day flights during the period.
Temporal Resolution: Measurement data have been averaged at 10-second intervals.
Study Areas: Latitude and longitude are given in decimal degrees.
| Site | Westernmost Longitude | Easternmost Longitude | Northernmost Latitude | Southernmost Latitude |
|---|---|---|---|---|
| Alaska and Canada | -165.6848 | -98.0895 | 71.2752 | 34.5893 |
Data File Information
There are 40 data files in ICARTT format (*.ict) included in this dataset, and the files conform to the ICARTT File Format Standards V1.1. The files are named ASCENDS-AAAA-BBB_DC8_YYYYMMDD_RC.ict, where
- AAAA is "AVOCET", "CO2SOUNDER", "DLH", or "Hskping",
- BBB is "CO2", "CH4", or "XCO2",
- YYYYMMDD is the date of flight in YYYY = year, MM = month, DD = day, and
- C is the revision number for the file.
Table 1. File names and descriptions.
| File Name | Descriptions |
|---|---|
| ASCENDS-AVOCET-CH4_DC8_YYYYMMDD_RC.ict | Measurements of methane (CH4) from the Atmospheric Vertical Observations of CO2 in the Earth's Troposphere (AVOCET) instrument. |
| ASCENDS-AVOCET-CO2_DC8_YYYYMMDD_RC.ict | Measurements of carbon dioxide (CO2) from AVOCET. |
| ASCENDS-CO2SOUNDER-XCO2_DC8_YYYYMMDD_RC.ict | Measurements of column-averaged dry-air mixing ratios (XCO2) from the CO2 Sounder Lidar instrument. |
| ASCENDS-DLH_DC8_YYYYMMDD_RC.ict | Measurements of water vapor and humidity from the Diode Laser Hydrometer instrument. |
| Ascends-Hskping_DC8_YYYYMMDD_RC.ict | Meteorological and navigation measurements from the DC-8 platform. |
Data File Details
The no_data value is -9999 for all files, except the file ASCENDS-DLH_DC8_YYYYMMDD_R0.ict which has a no_data value of -999.9.
Table 2. Variable names and descriptions in files named ASCENDS-AVOCET-CH4_DC8_YYYYMMDD_R0.ict and ASCENDS-AVOCET-CO2_DC8_YYYYMMDD_R0.ict.
| Variable | Units | Description |
|---|---|---|
| Start_UTC | s | Start UTC time of day in seconds |
| Stop_UTC | s | Stop UTC time of day in seconds |
| Mid_UTC | s | Mean UTC time of day in seconds |
| CH4_ppmv | ppmv | Methane dry mixing ratio |
| CO2_ppmv | ppmv | Carbon dioxide dry mixing ratio |
Table 3. Variable names and descriptions in files named ASCENDS-CO2SOUNDER-XCO2_DC8_YYYYMMDD_R0.ict.
| Variable | Units | Description |
|---|---|---|
| Start_UTC | s | Seconds from midnight UTC on flight date |
| XCO2_Sounder | ppm | Column-averaged dry-air mixing ratio of CO2 (XCO2) |
| Sigma_XCO2_Sounder | ppm | Standard deviation for XCO2 average |
| Lidar_Surface_Latitude | degrees_north | Surface latitude |
| Lidar_Surface_Longitude | degrees_east | Surface longitude |
| Lidar_Range | m | Distance to reflective surface |
| Lidar_Off_nadir_Angle | degrees | Angle from lidar beam to aircraft nadir |
| Lidar_Surface_Elevation | m | Mean seal level of reflective surface |
| Aircraft_Latitude | degrees_north | Aircraft latitude |
| Aircraft_Longitude | degrees_east | Aircraft longitude |
| Aircraft_Altitude | m | GPS height above mean sea level |
| Aircraft_Pitch_Angle | degrees | Aircraft pitch |
| Aircraft_Roll_Angle | degrees | Aircraft roll |
Table 4. Variable names and descriptions in files named ASCENDS-DLH_DC8_YYYYMMDD_R0.ict.
| Variable | Units | Description |
|---|---|---|
| Time_UTC | s | Seconds since midnight UTC on flight date |
| H2O_ppmv | ppmv | Water vapor mixing ratio |
| RHi_pct | percent | Relative humidity with respect to ice |
| RHw_pct | percent | Relative humidity with respect to liquid |
Table 5. Variable names and descriptions in files named Ascends-Hskping_DC8_YYYYMMDD_R0.ict.
| Variable | Units | Description |
|---|---|---|
| Start_UTC | s | Seconds since midnight UTC on flight date |
| Day_Of_Year | d | Day of year, beginning January 1 |
| Latitude | degrees_north | Latitude |
| Longitude | degrees_east | Longitude |
| MSL_GPS_Altitude | m | Sensor height above mean sea level |
| HAE_GPS_Altitude | m | Sensor height above WGS84 ellipsoid |
| Pressure_Altitude | ft | Aircraft altitude from air pressure |
| Radar_Altitude | ft | Aircraft altitude from radar |
| Ground_Speed | m s-1 | Aircraft ground speed |
| True_Air_Speed | kts | Air speed in knots |
| Indicated_Air_Speed | kts | Air speed in knots |
| Mach_Number | mach | Air speed in mach number |
| Vertical_Speed | m s-1 | Vertical speed |
| True_Heading | degrees | Aircraft heading, 0-360 degrees, clockwise from +y |
| Track_Angle | degrees | Aircraft track, 0-360 degrees, clockwise from +y |
| Drift_Angle | degrees | Aircraft drift, +/-180 degrees, clockwise from +y |
| Pitch_Angle | degrees | Aircraft pitch, +/-180 degrees, up+ |
| Roll_Angle | degrees | Aircraft roll, +/-180 degrees, right+ |
| Static_Air_Temp | degrees Celsius | Air temperature |
| Potential_Temp | degrees Kelvin | Air temperature |
| Dew_Point | degrees Celsius | Dew point temperature |
| Total_Air_Temp | degrees Celsius | Air temperature |
| IR_Surf_Temp | degrees Celsius | Surface temperature |
| Static_Pressure | mb | Air pressure |
| Cabin_Pressure | mb | Air pressure |
| Wind_Speed | m s-1 | Wind speed, limited to where Roll_Angle <= 5 degrees |
| Wind_Direction | degrees | Wind direction, 0-360 degrees, clockwise from +y |
| Solar_Zenith_Angle | degrees | Solar zenith angle |
| Aircraft_Sun_Elevation | degrees | Aircraft sun elevation angle |
| Sun_Azimuth | degrees | Sun azimuth angle |
| Aircraft_Sun_Azimuth | degrees | Aircraft-sun azimuth angle |
| Mixing_Ratio | g kg-1 | Atmospheric mixing ratio |
| Part_Press_Water_Vapor | mb | Partial pressure of water vapor |
| Sat_Vapor_Press_H2O | mb | Saturated vapor pressure over liquid water |
| Sat_Vapor_Press_Ice | mb | Saturated vapor pressure over ice |
| Relative_Humidity | percent | Relative humidity with respect to water |
Application and Derivation
These data contribute to our understanding and predictive capabilities for modeling the land-atmospheric exchange of CO2 and CH4 in the ABoVE study region.
Quality Assessment
The CO2 Sounder instrument was calibrated during an engineering flight under known atmospheric conditions and with the vertical profile of CO2 mixing ratios measured by in situ AVOCET sensor during the flight's spiral-down maneuvers (Abshire et al., 2018).
During this deployment, the CO2 Sounder lidar results show better than 1 ppm agreement between most lidar and in situ measurements during flights, both north-south and east-west gradients in XCO2, and local features in XCO2, including one caused by wildfires.
The standard deviations for each 10-second average XCO2 value are included in the files named ASCENDS-DLH_DC8_YYYYMMDD_R0.ict.
Data Acquisition, Materials, and Methods
Data were collected during eight flights over the ABoVE region during the period 2017-07-20 to 2017-08-08. In situ concentrations of atmospheric carbon dioxide and methane were measured with an infrared absorption spectrometer on NASA's Atmospheric Vertical Observations of CO2 in the Earth's Troposphere (AVOCET) instrument. Water vapor and relative humidity were measured with Diode Laser Hydrometer.
Column-averaged dry-air CO2 mixing ratio (XCO2) measurements were taken with the CO2 Sounder Lidar instrument (Abshire et al., 2017). This airborne lidar employs an integrated path differential absorption (IPDA) lidar technique to measure the range and pulse energy to ground or to cloud tops at 30 fixed-wavelength samples. It estimates the XCO2 in the nadir path from the aircraft to the scattering surface by measuring the shape of the 1572.33 nm CO2 absorption line. For each 1-second integration, the retrieval algorithm (Sun et al., 2021) solves for scattering surface elevation and XCO2 by using radiative transfer calculations, the aircraft altitude, range to the surface, and atmospheric conditions. This lidar has been successfully used in several airborne campaigns. Over desert surfaces, XCO2 measurements with a 1-second integration time have standard deviations of <1 ppm. Observations were averaged to a 10-second interval and are reported with the standard deviation of the average.
The flights included 47 spiral-down maneuvers conducted in locations over California, the Northwest Territories Canada, the Arctic Ocean, and Alaska, along with the transit flights from California to Alaska and return. Each spiral maneuver allowed comparing the XCO2 retrievals from the lidar against those computed from CO2 measured at the aircraft. In addition to the XCO2 measurement, the lidar receiver also recorded the time-resolved atmospheric backscatter signal strength continuously as the laser pulses propagate through the atmosphere. Backscatter measurements are available in an associated dataset (Sun et al., 2022).
This deployment allowed a new opportunity to assess airborne lidar measurements of XCO2 made in a diverse set of conditions, including those in the Arctic. See Abshire et al. (2018) and Allan et al. (2018) for more information about this research.
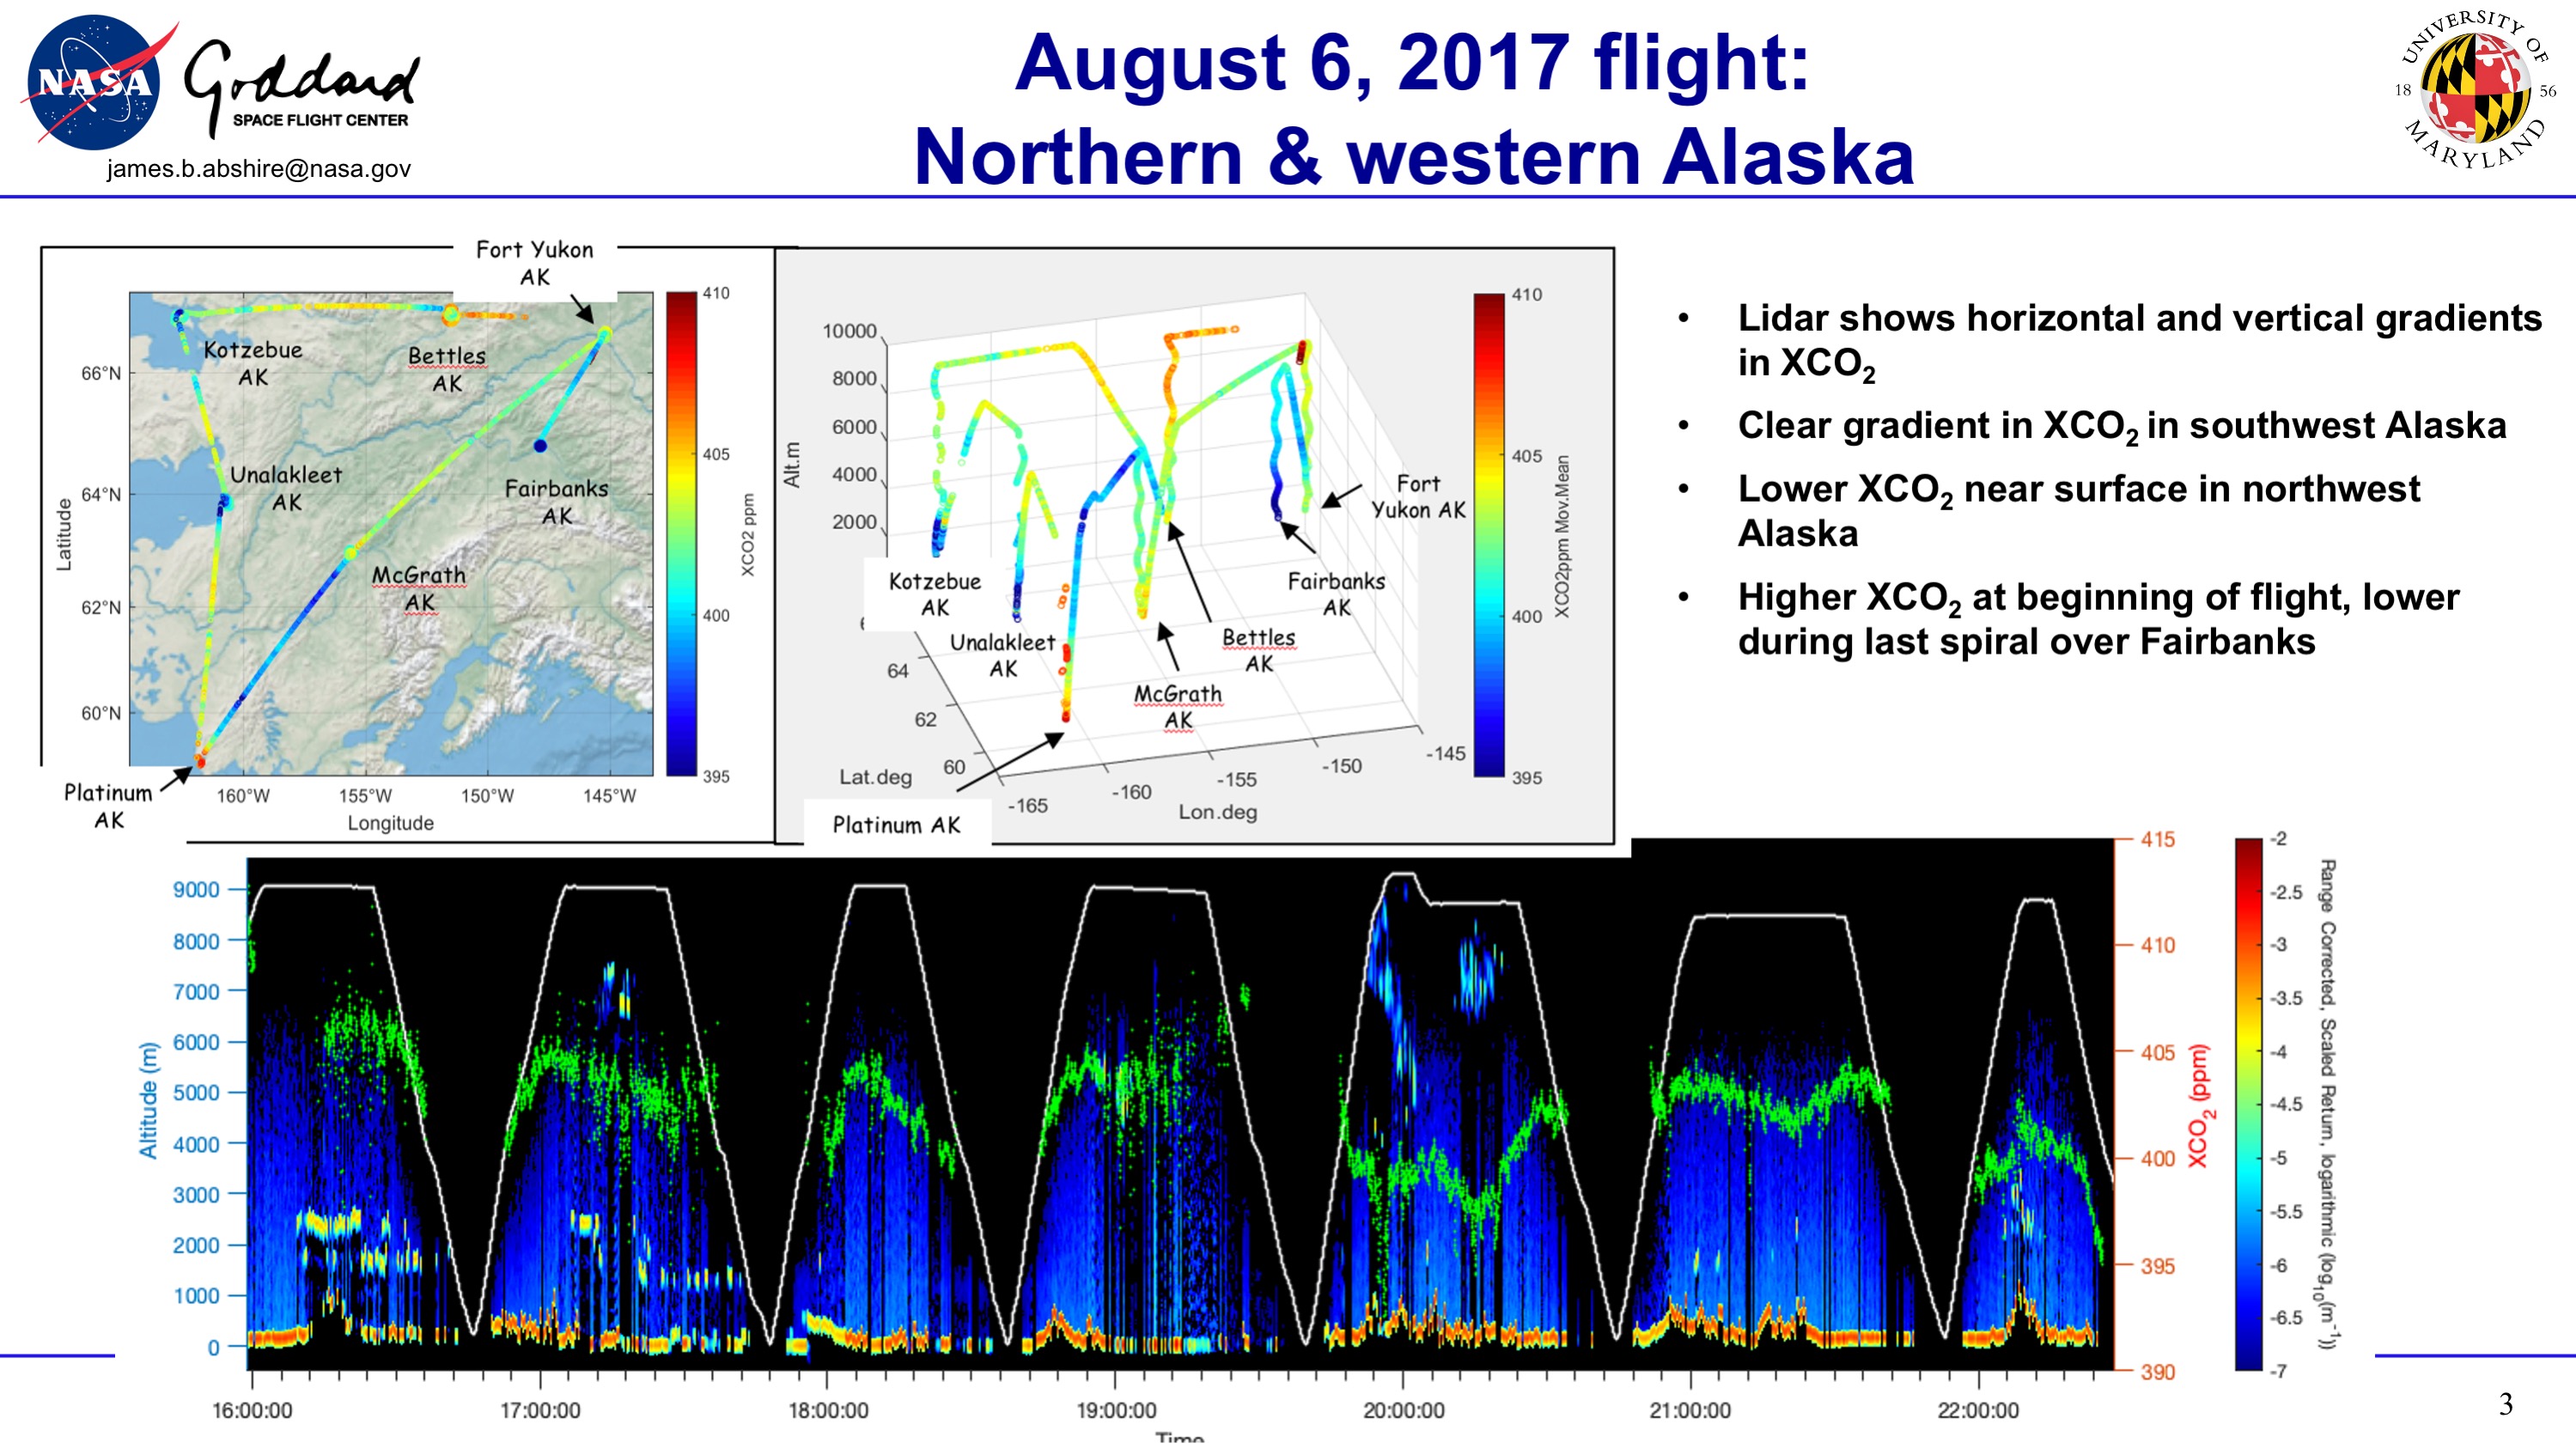
Figure 2. Column-averaged dry-air mixing ratio carbon dioxide (XCO2) concentrations measured by the airborne CO2 Sounder instrument on 06 August 2017 during a flight over Alaska.
Data Access
These data are available through the Oak Ridge National Laboratory (ORNL) Distributed Active Archive Center (DAAC).
ABoVE/ASCENDS: Active Sensing of CO2, CH4, and Water Vapor, Alaska and Canada, 2017
Contact for Data Center Access Information:
- E-mail: uso@daac.ornl.gov
- Telephone: +1 (865) 241-3952
References
Abshire, J. B., A.K. Ramanathan, H. Riris, G.R. Allan, X. Sun, W.E. Hasselbrack, J. Mao, S. Wu, J. Chen, K. Numata, S.R. Kawa, M.Y.M. Yang, and J. DiGangi. 2018. Airborne measurements of CO2 column concentrations made with a pulsed IPDA lidar using multiple-wavelength-locked laser and HgCdTe APD detector. Atmospheric Measurement Techniques 11:2001-2025. https://doi.org/10.5194/amt-11-2001-2018
Allan, G.R., J.B. Abshire, H. Riris, J. Mao, W.E. Hasselbrack, K. Numata, J. Chen, R. Kawa, M. Rodriguez, and M. Stephen. 2018. Lidar measurements of CO2 column concentrations in the Arctic region of North America from the ASCENDS 2017 airborne campaign. SPIE Proceedings volume 10779, Lidar Remote Sensing for Environmental Monitoring XVI, 1077906 (24 October 2018). https://doi.org/10.1117/12.2325908
Sun, X., J.B. Abshire, A. Ramanathan, S.R. Kawa, and J. Mao. 2021. Retrieval algorithm for the column CO2 mixing ratio from pulsed multi-wavelength lidar measurements. Atmospheric Measurement Techniques 14:3909–3922. https://doi.org/10.5194/amt-14-3909-2021
Sun, X., P.T. Kolbeck, J.B. Abshire, S.R. Kawa, and J. Mao. 2022. ABoVE/ASCENDS: Atmospheric Backscattering Coefficient Profiles from CO2 Sounder, 2017. ORNL DAAC, Oak Ridge, Tennessee, USA. https://doi.org/10.3334/ORNLDAAC/2051