Documentation Revision Date: 2026-04-22
Dataset Version: 1
Summary
This dataset holds 1476 files in cloud optimized GeoTIFF format.
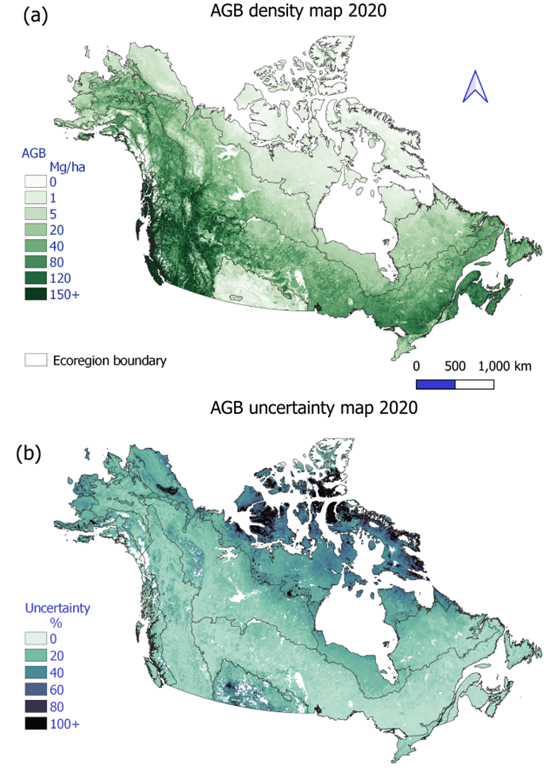
Figure 1. Aboveground biomass (AGB) density (a) and percentage uncertainty (b) for year 2020 for the study domain covering the high latitudes of North America.
Citation
Liang, W., K.T. Hu, O. van Lier, P. Tompalski, M.A. Friedl, J.T. Randerson, D.C. Morton, B.M. Rogers, A. Burrell, M.J. Macander, D. Yang, J. Lu, E. Bullock, Y. Zhang, X. Zhu, and J.A. Wang. 2025. ABoVE: Landsat-derived Annual Aboveground Biomass Density and Uncertainty, 1984-2022. ORNL DAAC, Oak Ridge, Tennessee, USA. https://doi.org/10.3334/ORNLDAAC/2465
Table of Contents
- Dataset Overview
- Data Characteristics
- Application and Derivation
- Quality Assessment
- Data Acquisition, Materials, and Methods
- Data Access
- References
- Dataset Revisions
Dataset Overview
This dataset provides annual aboveground biomass (AGB) maps and associated uncertainty maps for Alaska and Canada from 1984 to 2022 at ~30 m resolution (0.00027 degrees). The dataset was derived using predictors from synthetic spectral features from Landsat Collection 2 and Continuous Change Detection and Classification algorithm. Extensive collections of ground plots (n = 45,002) and airborne lidar data (n = 421,942) were compiled for reference AGB in order to calibrate AGB models using Extreme Gradient Boosting (XGBoost) per ecoregion. Fifty AGB predictions were derived, of which the mean and standard deviation was used as per-pixel AGB prediction and uncertainty, respectively. The dataset can promote better understanding of carbon dynamics across arctic and boreal regions of North America.
Project: Arctic-Boreal Vulnerability Experiment
The Arctic-Boreal Vulnerability Experiment (ABoVE) is a NASA Terrestrial Ecology Program field campaign being conducted in Alaska and western Canada, for 8 to 10 years, starting in 2015. Research for ABoVE links field-based, process-level studies with geospatial data products derived from airborne and satellite sensors, providing a foundation for improving the analysis, and modeling capabilities needed to understand and predict ecosystem responses to, and societal implications of, climate change in the Arctic and Boreal regions.
Related Publication:
Liang, W., K.-T. Hu, O. van Lier, P. Tompalski, M. Friedl, J.T. Randerson, D. Morton, B.M. Rogers, A. Burrell, M. Macander, D. Yang, E. Bullock, J. Lu, Y. Zhang, X. Zhu, M. Lara, and J.A. Wang. 2025. New generation of Landsat-derived annual aboveground biomass maps for Arctic and Boreal North America, 1984-2022. In preparation.
Acknowledgments:
This research was funded by the NASA's Terrestrial Ecology- Arctic and Boreal Vulnerability Experiment (grant 80NSSC23K0140).
Data Characteristics
Spatial Coverage: Arctic and Boreal regions of Canada and Alaska, USA
ABoVE Reference Locations: 492 "B" cells.
Spatial Resolution: 0.00027 degree, ~30 m
Temporal Coverage: 1984 to 2022
Temporal Resolution: Annual
Study Area (All latitude and longitude are given in decimal degrees)
| Study Area | Northernmost Extent | Westernmost Extent | Easternmost Extent | Southernmost Extent |
|---|---|---|---|---|
| Alaska and Canada | 82.3001 | -171.8441 | -52.6616 | 41.9212 |
Data File Information
This dataset holds 1476 files in cloud optimized GeoTIFF format that hold estimates of aboveground biomass (AGB), uncertainty, and quality flags. The data are tiled using the "B" cells of the ABoVE standard reference grid (Loboda et al., 2019). There are three files for each of 492 B grid cells.
The file naming system is ABoVE_Landsat_<metric>_<tile>.tif, where
- <metric> is "AGB" (aboveground biomass estimate), "AGB_Uncert" (uncertainty for AGB) , or "AGB_QualFlag" (quality flag for AGB estimate)
- <tile> is the designated "B" cell for the ABoVE reference grid (e.g., "Bh000v006")
Example file names for one tile: ABoVE_Landsat_AGB_Bh002v001.tif, ABoVE_Landsat_AGB_QualFlag_Bh002v001.tif, and
ABoVE_Landsat_AGB_Uncert_Bh002v001.tif
GeoTIFF characteristics
- Coordinate system: geographic coordinates (longitude, latitude), WGS 84 datum, EPSG: 4326
- Spatial resolution: 0.00027 degree (approximately ~30 m)
- Data type: Int32
- Pixels values: see Table 1 for description, units, and scale factor.
- No data value: -999, which typically indicates pixels with ocean or permanent snow/ice cover.
Table 1. Variables in GeoTIFF files
| File name component | Description | Scale factor* | Units | Bands |
|---|---|---|---|---|
| AGB | Annual mean estimates of aboveground biomass (AGB) for 1984 - 2022, one band per year | 0.01 | Mg ha-1 | 39 |
| AGB-Uncert | Uncertainty in annual estimates of AGB, one band per year | 0.01 | Mg ha-1 | 39 |
| AGB_QualFlag | Quality flags for each pixel: -999 = not flagged, 1 = abnormally high AGB increase rate, 2 = unrealistic increase in AGB after fire and not corrected, 3 = unrealistic increase in AGB after fire but corrected, and 4 = agricultural cover |
1 | - | 1 |
*Multiply the pixel values by the scale factor to obtain the estimated AGB values.
Application and Derivation
This dataset provides annual AGB and uncertainty maps for almost 40 years at continental scale for arctic boreal regions of North America with ~30 m resolution. The data can capture abrupt AGB changes caused by disturbances and gradual AGB changes caused by recovery or growth. Therefore, these maps can advance understanding of the impacts of climate change and disturbances on aboveground carbon stocks spatially and interannually over the past four decades. The maps can help project the future AGB for better climate change mitigation and biodiversity conservation planning for mapped areas. These data can be used to quantify the amount and change of AGB, to derive AGB loss and recovery caused by fire and harvest disturbances, and to be used as input for earth system models to simulate future aboveground carbon stock and dynamics under different climate change scenarios.
Quality Assessment
The assessment of accuracy was done using a large dataset of ground plot and airborne lidar measurements across Canada and Alaska. Testing data were held out to evaluate map accuracy by major plant functional type. The overall accuracy of the AGB maps for the whole study region has R2 = 0.74 and Bias = -5.0% (Table 1). The average percent bias for all plant functional types is below <15% (Table 2).
Table 2. Map accuracy by land cover type. Land cover is based on map from Hu et al. (2025).
| Land Cover | R2 | Bias (%) | MAE | Testing sample size |
|---|---|---|---|---|
| Deciduous forest | 0.45 | -11.30 | 37.70 | 82 |
| Evergreen forest | 0.67 | -7.10 | 34.60 | 659 |
| Mixed forest | 0.49 | -3.50 | 41.40 | 91 |
| Shrub & Herb | 0.35 | 12.70 | 10.80 | 709 |
| Wetland | 0.62 | -5.90 | 13.40 | 135 |
| All | 0.74 | -5.00 | 23.30 | 1676 |
In terms of uncertainty, defined as standard deviation of 50 AGB predictions, pixels with lower AGB density generally have higher percentage uncertainty (Figure 2). In terms of uncertainty percentage, defined as (std dev of 50 predictions) / (mean of 50 predictions), the mean uncertainty percentage was 15% for pixels with AGB >25 Mg ha-1 and was >25% for pixels with AGB <25 Mg ha-1.
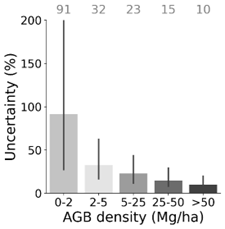
Figure 2. Mean and 95% interval (2.5% - 97.5%) of percent uncertainty per AGB level for the entire study area. The numbers above the bars indicate the mean percent uncertainty.
Data Acquisition, Materials, and Methods
Study area and Landsat data
The study area included Canada and Alaska and covered roughly 11.3 million km2. The study area was defined by the ABoVE B-level Standard Reference Grid (Loboda et al., 2019), which excludes the Aleutian Islands. To produce annual wall-to-wall AGB and uncertainty maps, the primary predictors were derived from the Continuous Change Detection and Classification (CCDC) algorithm (Zhu and Woodcock, 2014) fitted on Landsat Collection 2 Surface Reflectance (EROS 2020a, 2020b, 2020c). The CCDC algorithm uses harmonic models fit to each band in the multispectral time series of Landsat reflectance values at each pixel. For each pixel-year, 65 seasonal spectral features were derived from the fitted CCDC (Wang et al., 2021). For reference AGB, AGB estimates from extensive collections of ground plots and airborne Lidar data were used. In total, 45,002 ground plots were compiled with 75,838 observations (including repeated field surveys), and 421,942 reference data plots were derived from airborne Lidar for model training and testing.
Model calibration
Fifty XGBoost models per ecoregion were calibrated using ecoregions from Ecoregion Level I of North America (CEC, 1997). The training data were balanced based on the land cover distribution (Hu et al., 2025; Latifovic et al., 2016) within each ecoregion to ensure the training data was representative of the study region. To produce wall-to-wall uncertainty maps, both sampling uncertainty and uncertainty in AGB values of the training data were considered. Sampling uncertainty was estimated by choosing different sets of training data. Uncertainty in AGB values was estimated by using Monte Carlo simulations to add random errors to the original AGB values. Both types of uncertainty were added to the training data before calibrating the XGBoost models. The mean and standard deviation of the 50 predictions were taken as the per-pixel AGB prediction and uncertainty estimation, respectively.
Intended uses
This dataset was produced to provide reliable estimates of AGB stock and change during the past four decades to improve understanding of how climate change and disturbances impact the carbon cycle in Arctic-boreal North America. These data can be used to 1) quantify aboveground carbon stock and change during 1984-2022, 2) estimate AGB growth rate, 3) estimate disturbance-caused AGB dynamics, including fire and harvest disturbances, and 4) relate AGB density and change from our dataset with underlying drivers such as climatic factors, disturbances, and global warming. See Liang et al. (2025) for more information on the accuracy of the time series in estimating these processes.
Limitations and Quality flag layer to ensure data quality
Total woody AGB, including both live and dead pools, was mapped in non-tundra regions. Total AGB, including both woody and non-woody pools, was mapped in the tundra region.
A quality flag layer (Table 1) was created to flag pixels with potential problematic predictions due to 1) abnormally high AGB increase rate compared to increase rates from all other years (4.0% of all pixels), 2) unrealistic AGB increase right after fire that were not amended via postprocessing (0.3% of pixels), 3) unrealistic AGB increased right after fire that were amended via postprocessing (0.8% of pixels), and 4) agricultural pixels (2.2% of all pixels), identified using the LC map from Global Land Analysis & Discovery (Potapov et al., 2022). The details are described in Supplementary materials from Liang et al. (2025).
Users should consider excluding pixels with value 2 in the quality flag layer; these pixels showed unrealistic AGB increase after fire and did not get fixed through postprocessing. If not interested in AGB loss caused by land cover change from forest to agriculture, exclude pixels with value 4. These maps cannot realistically predict AGB for agricultural areas due to lack of ground-derived AGB from agricultural lands. To characterize temporal AGB changes, especially at fine spatial scales (i.e., landscape or local scale), remove pixels with value 1 in quality flag layer as these pixels showed abnormally high AGB increase rate.
Data Access
These data are available through the Oak Ridge National Laboratory (ORNL) Distributed Active Archive Center (DAAC).
ABoVE: Landsat-derived Annual Aboveground Biomass Density and Uncertainty, 1984-2022
Contact for Data Center Access Information:
- E-mail: uso@daac.ornl.gov
- Telephone: +1 (865) 241-3952
References
CEC. 1997. Ecological regions of North America: Toward a common perspective. Commission for Environmental Cooperation, Montreal, Quebec, Canada.
EROS. 2020a. Landsat 4-5 Thematic Mapper Level-2, Collection 2. U.S. Earth Resources Observation and Science (EROS) Center, Geological Survey. https://doi.org/10.5066/P9IAXOVV
EROS. 2020b. Landsat 7 Enhanced Thematic Mapper Plus Level-2, Collection 2. Earth Resources Observation and Science (EROS) Center, U.S. Geological Survey. https://doi.org/10.5066/P9C7I13B
EROS. 2020c. Landsat 8-9 Operational Land Imager / Thermal Infrared Sensor Level-2, Collection 2. Earth Resources Observation and Science (EROS) Center, U.S. Geological Survey. https://doi.org/10.5066/P9OGBGM6
Hu, K.T., J.A. Wang, M.A. Friedl, W. Liang, J. Kim, X. Zhu, D.C. Morton, and J.T. Randerson. 2025, January 1. ABoVE: Landsat-derived Annual Dominant Land Cover in Boreal North America, 1986-2020. ORNL Distributed Active Archive Center. https://doi.org/10.3334/ORNLDAAC/2423
Latifovic, R., C. Homer, R. Ressl, D. Pouliot, S.N. Hossain, R.R. Colditz, I. Olthof, C.P. Giri, and A. Victoria. 2016. North American land-change monitoring system. In C.P. Giri (ed). Remote sensing of land use and land cover: principles and applications. CRC Press; Boca Raton, Florida, U.S.
Liang, W., K.-T. Hu, O. van Lier, P. Tompalski, M. Friedl, J.T. Randerson, D. Morton, B.M. Rogers, A. Burrell, M. Macander, D. Yang, E. Bullock, J. Lu, Y. Zhang, X. Zhu, M. Lara, and J.A. Wang. 2025. New generation of Landsat-derived annual aboveground biomass maps for Arctic and Boreal North America, 1984-2022. In preparation.
Loboda, T.V., E.E. Hoy, and M.L. Carroll. 2017. ABoVE: Study Domain and Standard Reference Grids, Version 2. ORNL DAAC, Oak Ridge, Tennessee, USA. https://doi.org/10.3334/ORNLDAAC/1527
Potapov, P., M.C. Hansen, A. Pickens, A. Hernandez-Serna, A. Tyukavina, S. Turubanova, V. Zalles, X. Li, A. Khan, F. Stolle, N. Harris, X.-P. Song, A. Baggett, I. Kommareddy, and A. Kommareddy. 2022. The Global 2000-2020 Land Cover and Land Use Change Dataset Derived From the Landsat Archive: First Results. Frontiers in Remote Sensing 3. https://doi.org/10.3389/frsen.2022.856903
Wang, J.A., A. Baccini, M. Farina, J.T. Randerson, and M.A. Friedl. 2021. Disturbance suppresses the aboveground carbon sink in North American boreal forests. Nature Climate Change 11:435–441. https://doi.org/10.1038/s41558-021-01027-4
Zhu, Z., and C.E. Woodcock. 2014. Continuous change detection and classification of land cover using all available Landsat data. Remote Sensing of Environment 144:152–171. https://doi.org/10.1016/j.rse.2014.01.011
Dataset Revisions
| Version | Release Date | Revision Notes |
|---|---|---|
| 1.0 | 2026-01-19 |
Pixels with nan values (-2147483648) were replaced with the declared nodata value (-999) in eight files: |
| 1.0 | 2025-11-14 | First publication |