Documentation Revision Date: 2022-01-10
Dataset Version: 1
Summary
SIF measurements can provide information on the functional status of vegetation including light-use efficiency and global primary productivity that can be used for global carbon cycle modeling and agricultural applications. The SCIAMACHY SIF product is inherently noisy owing to low signal levels and has undergone only a limited amount of validation.
There are 3,230 data files in netCDF (*.nc) format included in this dataset.
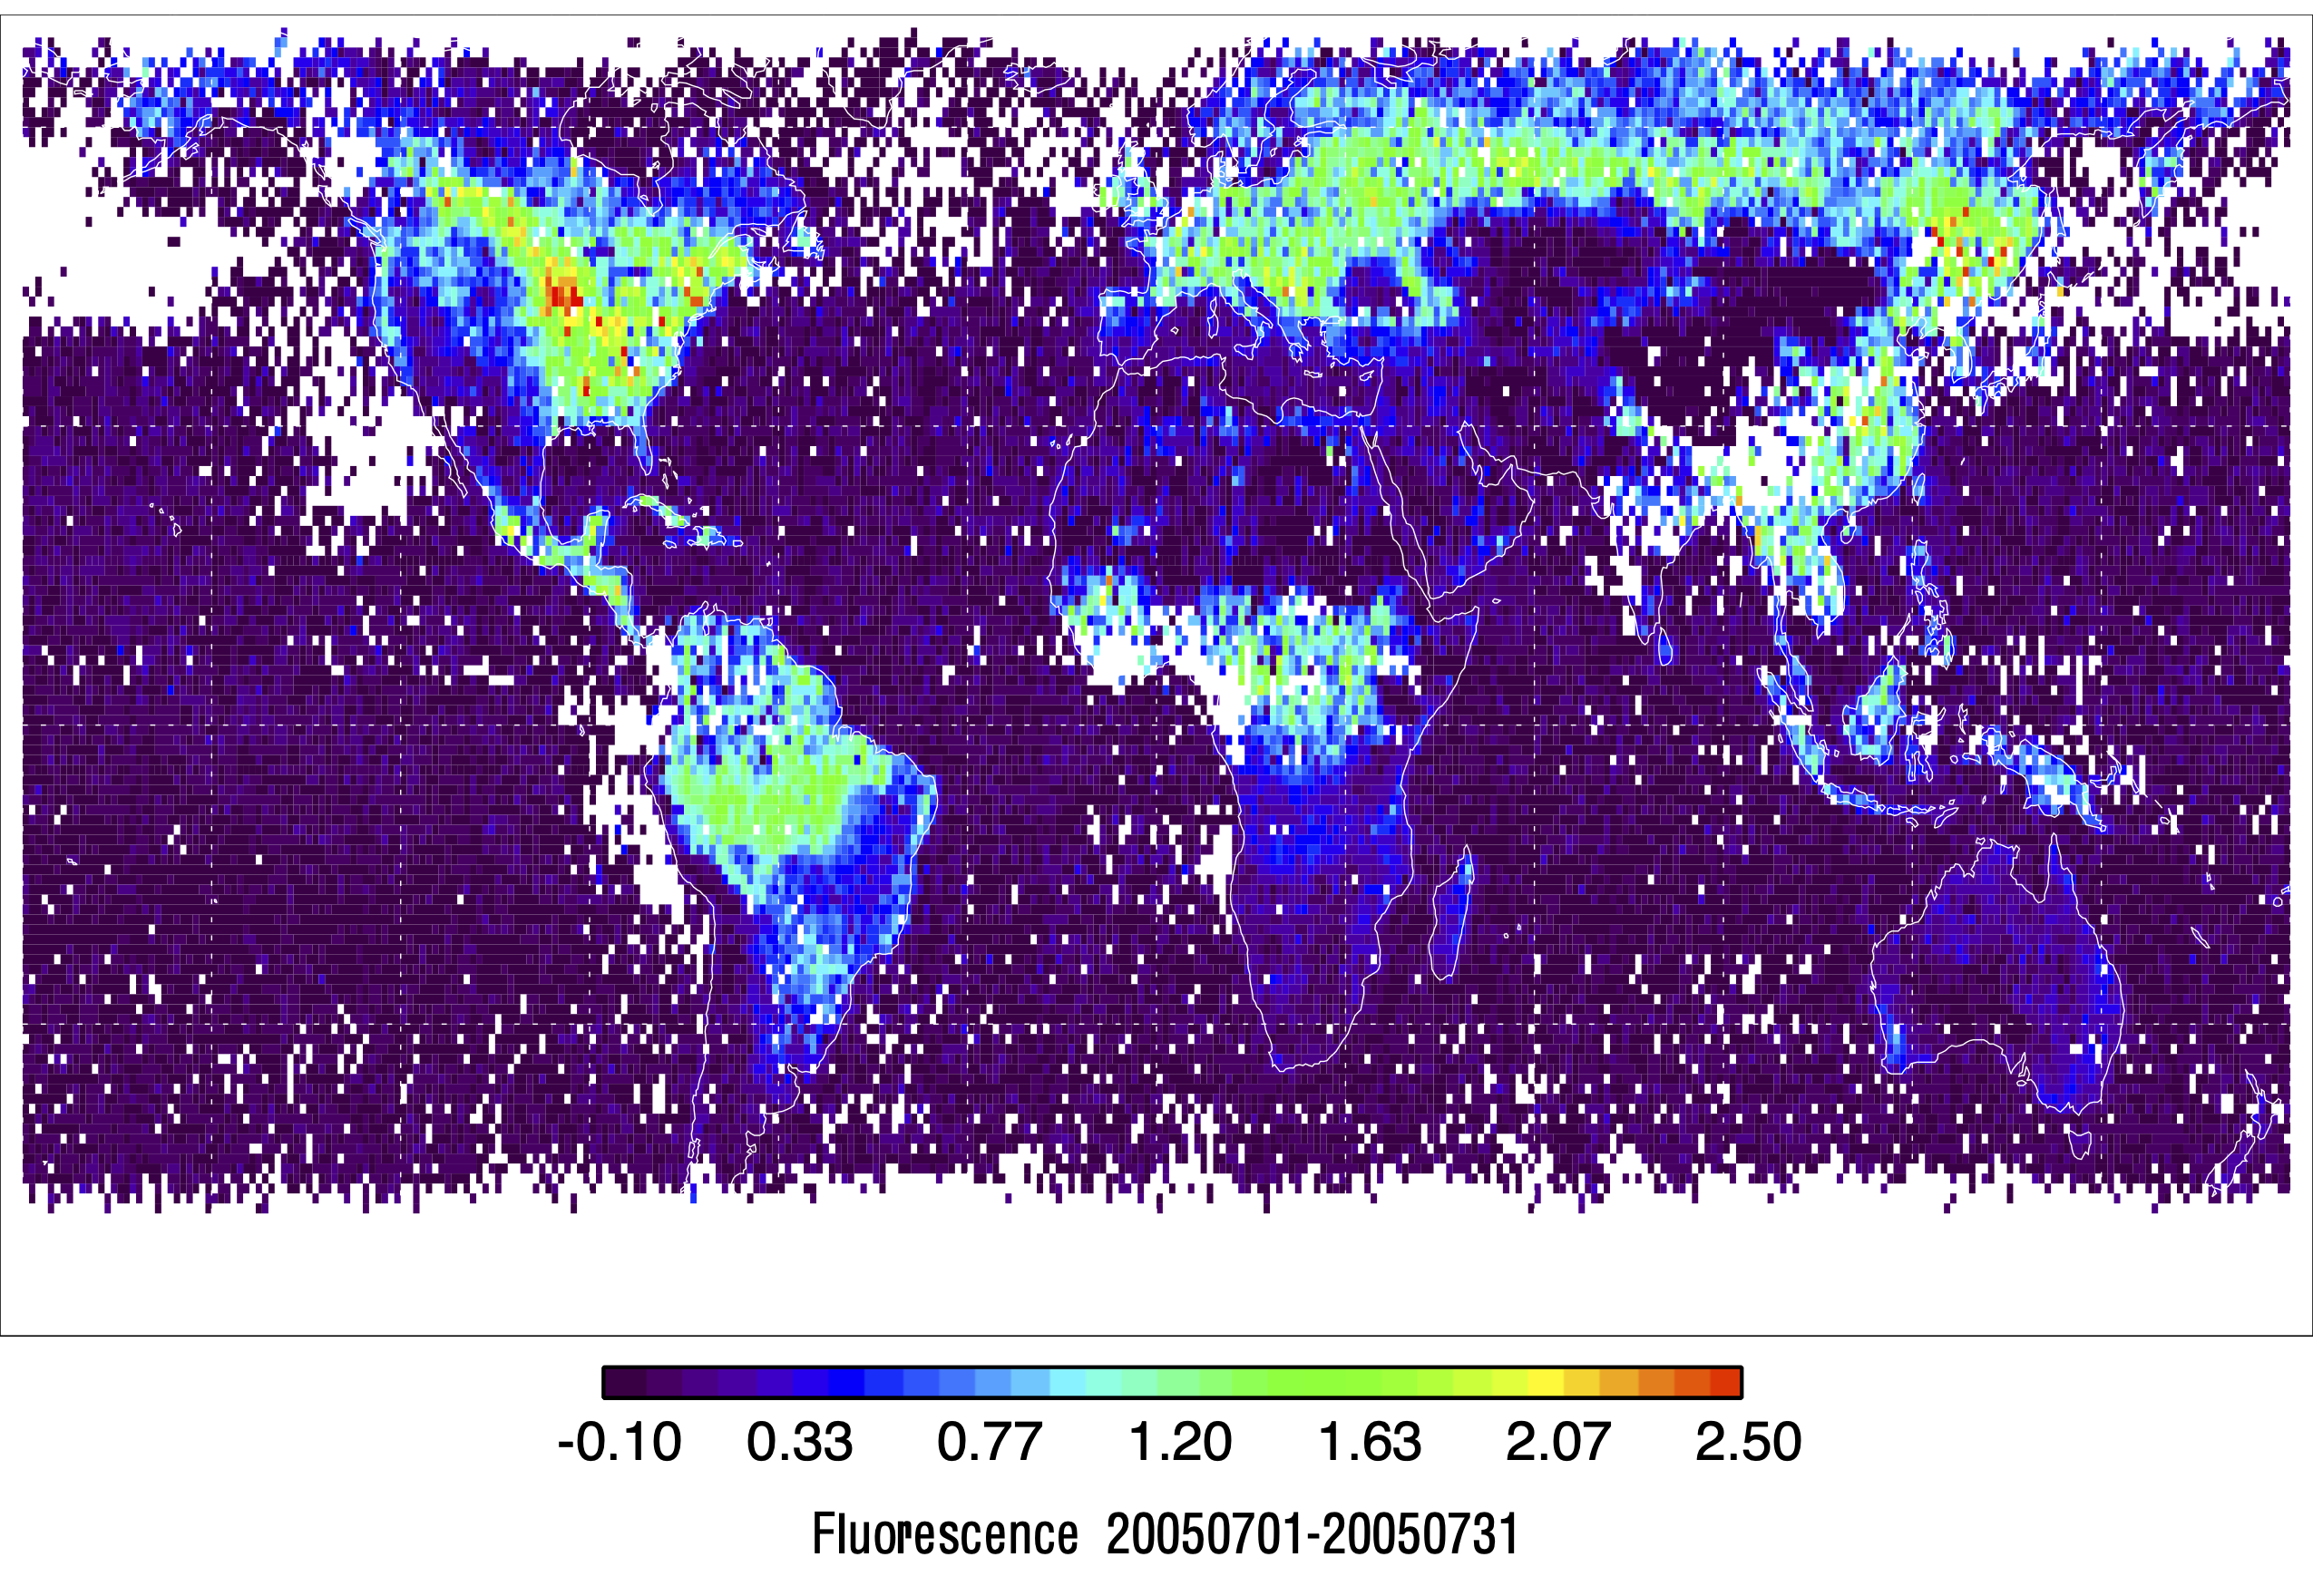
Figure 1. Gridded SIF estimates derived from this current L2 SCIAMACHY SIF dataset at 1-degree resolution for July, 2005.
Citation
Joiner, J., Y. Yoshida, P. Koehler, C. Frankenberg, and N.C. Parazoo. 2021. L2 Solar-Induced Fluorescence (SIF) from SCIAMACHY, 2003-2012. ORNL DAAC, Oak Ridge, Tennessee, USA. https://doi.org/10.3334/ORNLDAAC/1871
Table of Contents
- Dataset Overview
- Data Characteristics
- Application and Derivation
- Quality Assessment
- Data Acquisition, Materials, and Methods
- Data Access
- References
Dataset Overview
This dataset provides Level 2 (L2) Solar-Induced Fluorescence (SIF) of chlorophyll estimates derived from the SCanning Imaging Absorption spectroMeter for Atmospheric CartograpHY (SCIAMACHY) instrument on the European Space Agency's (ESA's) Environmental satellite (Envisat) with ~0.5 nm spectral resolution and wavelengths between 734 and 758 nm. SCIAMACHY covers global land between approximately 70 and -57 degrees latitude on an orbital basis at a resolution of approximately 30 km x 240 km. Data are provided for the period from 2003-01-01 to 2012-04-08. Each file contains daily raw and bias-adjusted solar-induced fluorescence along with quality control information and ancillary data.
SIF measurements can provide information on the functional status of vegetation including light-use efficiency and global primary productivity that can be used for global carbon cycle modeling and agricultural applications. The SCIAMACHY SIF product is inherently noisy owing to low signal levels and has undergone only a limited amount of validation.
Project: Solar Induced Fluorescence Earth Science Data Record
This project is developing a global, observation-based Earth System Data Record (ESDR) for quantifying global vegetation solar induced fluorescence (SIF) and photosynthesis gross primary productivity (GPP) from 1996-2020. It was funded under the 2017 Making Earth System Data Records for Use in Research Environments (MEaSUREs) call (17-MEASURES-0032).
Related Datasets:
Additional SIF-ESDR datasets are available on the ORNL DAAC SIF-ESDR project page.
Acknowledgments:
This work was supported by the NASA Making Earth System Data Records for Use in Research Environments (MEaSUREs) program (grants NNX15AH95G, 17-MEASURES-0032)
Data Characteristics
Spatial Coverage: Global land (between approximately 70 and -57 degrees latitude)
Spatial Resolution: 30 km x 240 km footprint at nadir
Temporal Coverage: 2003-01-01 to 2012-04-08
Temporal Resolution: Daily
Study Area: Latitude and longitude are given in decimal degrees.
| Site | Northernmost Latitude | Southernmost Latitude | Easternmost Longitude | Westernmost Longitude |
|---|---|---|---|---|
| Global | 70 | -57.886959 | 180 | -180 |
Data File Information
There are 3,230 data files in netCDF (*.nc) format. Data are supplied in the CF Metadata Conventions 1.7-compliant trajectory data type.
Files are named NSIFv2.6.1.SCIA.YYYYMMDD_v2.9.1_all.nc (e.g., NSIFv2.6.2.SCIA.20030101_v2.9.1_all.nc), where YYYYMMDD represents the observation date. Data version is indicated at the end of the filename (i.e., v2.9.1).
Table 1. File names and descriptions.
| File Names | Description |
|---|---|
| NSIFv2.6.1.SCIA.YYYYMMDD_v2.9.1_all.nc | Each file provides daily raw and bias-adjusted SIF on an orbital basis for land pixels. Variables are structured as GeoTrajectory, where the observations for a flight segment are connected along a one-dimensional track in space and with time increasing monotonically along the track. |
Data File Details
Missing values are represented by -9999. Coordinate reference system is EPSG:4326.
Table 2. Variable names and descriptions.
| Variable Name | Units | Description |
|---|---|---|
| Cloud_Fraction | Effective cloud fraction MLER (mixed Lambertian-equivalent reflectivity) model | |
| Daily_Averaged_SIF | mW m-2 nm-1 sr-1 | SIF adjusted to daily average based on cosSZA |
| Delta_Time | seconds since 2000-01-01 00:00:00 | Time of data collection |
| Earth_Radius | km | Earth radius |
| Integration_Time | s | Sensor integration time |
| Iterations | Number of iterations in a retrieval | |
| Latitude | degree north | Latitude at center of pixel |
| Latitude_Corners | degree north | Latitudes of pixel corners |
| Longitude | degree east | Longitude at center of pixel |
| Longitude_Corners | degree east | Longitudes of pixel corners |
| Quality_Flag |
Pixel retrieval quality flags: For gridding data, recommended using pixels with a quality flag value of 2. |
|
| RAz | degree | Relative azimuth angle |
| Refl670 | Reflectance 670nm, not atmospherically corrected | |
| Refl780 | Reflectance 780nm, not atmospherically corrected | |
| Residual | percent | RMS over wavelengths of residual in percent of radiance |
| Satellite_Height | km | Satellite height |
| Scan_Number | Granule scan position | |
| SIF_740 | mW m-2 nm-1 sr-1 | Solar-induced fluorescence at 740nm |
| SIF_Unadjusted | mW m-2 nm-1 sr-1 | Raw SIF, no adjustment |
| SIF_Uncertainty | mW m-2 nm-1 sr-1 | SIF estimated uncertainty |
| Surface_Pressure | hPa | Surface Pressure from digital elevation map at STP |
| SZA | degree | Solar zenith angle |
| VZA | degree | Sensor zenith angle |
Application and Derivation
Measurements of solar-induced fluorescence (SIF) of chlorophyll can provide information on the functional status of vegetation including light-use efficiency and global primary productivity that can be used for global carbon cycle modeling and agricultural applications.
Quality Assessment
Uncertainties were assessed using machine learning over the ocean where SIF is expected to be zero. This produced error estimates resulting from instrument noise also as a function of sun-satellite geometry and latitude.
These dataset products are inherently noisy owing to low signal levels. Users should expect to see negative values; users should retain negative values and treat them like they would any other noisy dataset. For example, if fluorescence is zero, there should be a distribution of measurements centered about zero including negative values. Any attempts to remove negative values or force them to zero for the purpose of averaging will bias results.
This dataset has undergone a limited amount of validation (e.g., the same algorithm applied to the ERS-2 GOME dataset (Joiner et al., 2019) has been compared with ground-based data in Yang et al., (2015)). The output of far-red retrievals from GOME-2 has been compared with the filling-in signal near 758 nm from the GOSAT TANSO-FTS instrument that is derived from a simpler algorithm (Joiner et al., 2013) and with OCO-2 (Sun et al., 2018; Parazoo et al., 2019; Bacour et al., 2019) as well as with the GOME-2 retrievals from Köhler et al. (2015). The retrieval performed well when compared with results using simulated data from thousands of realizations (Joiner et al., 2013).
Data Acquisition, Materials, and Methods
Level 2 (L2) SIF estimates were derived from reflectance measured by the SCanning Imaging Absorption spectroMeter for Atmospheric CartograpHY (SCIAMACHY) instrument on the European Space Agency’s (ESA’s) European Environmental Satellite (Envisat) satellite with ~0.5 nm spectral resolution and wavelengths between 734 and 758 nm. This dataset's products were written as L2 orbital files for the day and orbit specified in the filename similarly to the related ERS-2 GOME dataset (Joiner et al., 2019).
The retrievals use a principal component analysis technique to account for absorption and scattering in the atmosphere (Joiner et al., 2013; 2016). Similar approaches have been used with different details in the fitting window and number of principal components used (Köhler et al., 2015) as also documented in Parazoo et al. (2019). Other retrievals might give different overall magnitudes but provide similar spatial and temporal variability. Note that Envisat had an equator crossing time of 10:00 AM which is a one-half hour later than the EUMETSAT Met-Op satellites that host the GOME-2 instruments. Other changes have been made to the algorithm since Joiner et al., 2013 (see Joiner et al., 2014, 2016).
Known Algorithm and Instrument Features and Caveats
- Month-to-month (temporal) variations may incorporate instrumental effects.
- All relevant retrievals are retained in the L2 dataset and quality control is in the hands of the user (see below for further details).
- The SCIAMACHY instrument has a relatively large footprint, native resolution approximately 30 km x 60 km at nadir in the nominal nadir mode, but pixels at the relevant wavelengths have been averaged onboard so that the spatial footprint is degraded.
- Due to the large pixels, clouds and aerosol are present in nearly every observation. Although our retrieval approach can tolerate cloud contamination, clouds will screen the surface signal from the satellite view. Therefore, temporal and spatial variations in the data may also be due to cloud contamination. A cloud filtering approach is described in Joiner et al. (2012). For a more complete description of the errors, please see Joiner et al. (2013). Users may wish to apply additional cloud screening using the effective cloud fraction data field depending upon their application.
- Some issues with data at very high solar zenith angles (in winter at high latitudes) have been noted (fluorescence is slightly positive or negative when it is expected to be zero). Data with SZA >75° have been excluded.
- There has been no attempt as of yet to reconcile the differences between the SIF from GOME-2 on MetOp-A and –B, ERS-2 GOME (Joiner et al., 2019), and SCIAMACHY. There are calibration differences that produce SIF differences between the datasets. Users are advised to proceed with caution if both data sets are used together. Analysis of all datasets is ongoing.
- SIF values are sensitive to the absolute calibration of the solar irradiances. The SCIAMACHY instrument degraded during its lifetime. The datasets use the latest available version of SCIAMACHY Level 1B (L1B) data (radiances and irradiances). The data have not been analyzed for potential false trends caused by instrument degradation and, therefore, are NOT recommended for long-term trend analysis.
- The data have been corrected for small zero-level offset problems (Köhler et al., 2015; Joiner et al., 2016) using a machine learning approach (Joiner et al., 2020). Both the corrected and uncorrected data are provided. As the bias correction is not perfect, small biases still remain, particularly over high albedo (high radiance), non-vegetated surfaces such as the Sahara desert. One change from Joiner et al. (2016) is that a machine learning approach (a neural network) is used to estimate the biases; this produces a smoother bias field as a function of latitude than the previous regression approach.
- The quality control values are 2 = good retrievals with cloud fraction <30%, 1 = good retrievals with cloud fraction >30%, and 0 = retrievals not passing various quality control checks.
- For gridding data, it is recommended to use pixels with a quality control value of 2.
- Estimated daily-averaged SIF values based on a single observation are provided. The estimates use an approximate clear sky PAR proxy (cosine of the solar zenith angle) at the observation time and a similar clear-sky PAR weighting for all other hours. This is similar to what is provided in related datasets.
- The cross-track position (Scan_Number) is provided as the position within a nadir block of data. Note that this is different from what is provided in the ERS-2 GOME product (Joiner et al., 2019).
- Several fields, such as sun-satellite geometry are provided directly as given in the L1B data and others (Delta_Time) are computed from the L1B data.
Data Access
These data are available through the Oak Ridge National Laboratory (ORNL) Distributed Active Archive Center (DAAC).
L2 Solar-Induced Fluorescence (SIF) from SCIAMACHY, 2003-2012
Contact for Data Center Access Information:
- E-mail: uso@daac.ornl.gov
- Telephone: +1 (865) 241-3952
References
Bacour, C., F. Maignan, P. Peylin, N. MacBean, V. Bastrikov, J. Joiner, P. Köhler, L. Guanter, and C. Frankenberg. 2019. Differences Between OCO-2 and GOME-2 SIF Products From a Model-Data Fusion Perspective. Journal of Geophysical Research: Biogeosciences 124:3143–3157. https://doi.org/10.1029/2018JG004938
Joiner, J., L. Guanter, R. Lindstrot, M. Voigt, A.P. Vasilkov, E.M. Middleton, K.F. Huemmrich, Y. Yoshida, and C. Frankenberg. 2013. Global monitoring of terrestrial chlorophyll fluorescence from moderate-spectral-resolution near-infrared satellite measurements: methodology, simulations, and application to GOME-2. Atmospheric Measurement Techniques 6(10):2803–2823. https://doi.org/10.5194/amt-6-2803-2013
Joiner, J., Y. Yoshida, A.P. Vasilkov, K. Schaefer, M. Jung, L. Guanter, Y. Zhang, S. Garrity, E.M. Middleton, K.F. Huemmrich, L. Gu, and L. Belelli Marchesini. 2014. The seasonal cycle of satellite chlorophyll fluorescence observations and its relationship to vegetation phenology and ecosystem atmosphere carbon exchange. Remote Sensing of Environment 152:375–391. https://doi.org/10.1016/j.rse.2014.06.022
Joiner, J., Y. Yoshida, L. Guanter, and E.M. Middleton. 2016. New methods for the retrieval of chlorophyll red fluorescence from hyperspectral satellite instruments: simulations and application to GOME-2 and SCIAMACHY. Atmospheric Measurement Techniques 9(8):3939–3967. https://doi.org/10.5194/amt-9-3939-2016
Joiner, J., Y. Yoshida, P. Köhler, C. Frankenberg, and N.C. Parazoo. 2019. L2 Daily Solar-Induced Fluorescence (SIF) from ERS-2 GOME, 1995-2003. ORNL DAAC, Oak Ridge, Tennessee, USA. https://doi.org/10.3334/ORNLDAAC/1758
Köhler, P., L. Guanter, and J. Joiner. 2015. A linear method for the retrieval of sun-induced chlorophyll fluorescence from GOME-2 and SCIAMACHY data. Atmospheric Measurement Techniques 8(6):2589–2608. https://doi.org/10.5194/amt-8-2589-2015
Parazoo, N.C., C. Frankenberg, P. Köhler, J. Joiner, Y. Yoshida, T. Magney, Y. Sun, and V. Yadav. 2019. Towards a Harmonized Long-Term Spaceborne Record of Far-Red Solar-Induced Fluorescence. Journal of Geophysical Research: Biogeosciences 124(8):2518–2539. https://doi.org/10.1029/2019jg005289
Sun, Y., C. Frankenberg, M. Jung, J. Joiner, L. Guanter, P. Köhler, and T. Magney. 2018. Overview of Solar-Induced chlorophyll Fluorescence (SIF) from the Orbiting Carbon Observatory-2: Retrieval, cross-mission comparison, and global monitoring for GPP. Remote Sensing of Environment 209:808–823. https://doi.org/10.1016/j.rse.2018.02.016
Yang, X., J. Tang, J.F. Mustard, J.-E. Lee, M. Rossini, J. Joiner, J.W. Munger, A. Kornfeld, and A.D. Richardson. 2015. Solar-induced chlorophyll fluorescence that correlates with canopy photosynthesis on diurnal and seasonal scales in a temperate deciduous forest. Geophysical Research Letters 42:2977–2987. https://doi.org/10.1002/2015GL063201