Documentation Revision Date: 2024-03-07
Dataset Version: 1
Summary
This dataset holds 36 files in cloud optimized GeoTIFF format.
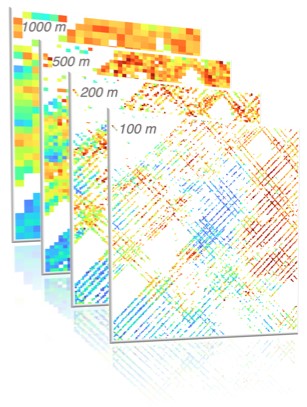
Figure 1. GEDI RH98 values (0-60 m) at 100-, 200-, 500-, and 1000-m resolutions around 8.9097 degrees N, -83.0326 degrees E.
Citation
Saatchi, S.S., and S. Favrichon. 2023. Global Vegetation Height Metrics from GEDI and ICESat2. ORNL DAAC, Oak Ridge, Tennessee, USA. https://doi.org/10.3334/ORNLDAAC/2294
Table of Contents
- Dataset Overview
- Data Characteristics
- Application and Derivation
- Quality Assessment
- Data Acquisition, Materials, and Methods
- Data Access
- References
Dataset Overview
This dataset provides global rasters of relative height metrics for vegetation from Global Ecosystem Dynamics Investigation (GEDI) L2A data and Ice, Cloud, and Land Elevation Satellite-2 (ICESat-2) L3A ATL08 data at 100-, 200-, 500-, and 1000-m spatial resolutions. The metrics include the relative heights RH98, RH90, RH75, and RH50, corresponding to the height at which the respective 98th, 90th, 75th, and 50th percentile of returned energy is reached relative to the ground. These metrics provide measures of vegetation canopy height and structure. The different relative height metrics were intercalibrated over the overlap area (50 - 52 degrees N). GEDI data were collected from 2019-2022, and ICESat2 data were from 2019-2021.
Project: Global Ecosystem Dynamics Investigation (GEDI)
The Global Ecosystem Dynamics Investigation (GEDI) produces high resolution laser ranging observations of the 3D structure of the Earth. GEDI’s precise measurements of forest canopy height, canopy vertical structure, and surface elevation greatly advance our ability to characterize important carbon and water cycling processes, biodiversity, and habitat. GEDI was funded as a NASA Earth Ventures Instrument (EVI) mission. It was launched to the International Space Station in December 2018 and completed initial orbit checkout in April 2019. The lower-level science data products (L1B, L2A, and L2B) are available from the Land Processes DAAC (https://lpdaac.usgs.gov/), and the higher-level products (L3, L4A, and L4B) are available from ORNL DAAC. L3 provides gridded canopy and land surface metrics. L4A and L4B provide aboveground biomass density at footprint and grid levels.
Acknowledgements
This research was funded by NASA'a Advancing Collaborative Connections for Earth System Science (ACCESS) Program (grant ACCESS19-0066 - Global Vegetation Structure).
Data Characteristics
Spatial Coverage: Global land
Spatial Resolution: 100, 200, 500, and 1000 m
Temporal Coverage: Derived from GEDI data from 2019-2022 and ICESat2 data from 2019-2021.
Temporal Resolution: One-time estimates
Study Area: Latitude and longitude are given in decimal degrees.
| Study Area | Westernmost Longitude | Easternmost Longitude | Northernmost Latitude | Southernmost Latitude |
|---|---|---|---|---|
| Global land | -180.0 | 180.0 | 90.0 | -90.0 |
Data file information
This dataset holds 36 files in cloud optimized GeoTIFF format.
The file naming convention is <instrument>_<metric>_<res>.tif, where
- <instrument>: "gedi" = Global Ecosystem Dynamics Investigation (GEDI) or "icesat" = Ice, Cloud, and Land Elevation Satellite-2 (ICESat-2)
- <metric>: "rh50", "rh75", "rh90", "rh98" or "count"
- <res>: spatial resolution of "100m:", "200m", "500m", or "1000m"
Example file name: gedi_rh50_100m.tif
Metrics
The "rh50", "rh75", "rh90", "rh98" metrics refer to the relative heights corresponding to the height at which the 98%, 90%, 75%, and 50% percentiles, respectively, of returned energy is reached relative to the ground. The unit is meters above the ground.
The "count" metric records the number of GEDI samples within the pixel. This metric is unitless.
GeoTIFF characteristics
- Coordinate system: geographic coordinates in WGS 84 datum (EPSG 4326)
- Pixel size varies with resolution: 0.000898 degree for "100m", 0.001797 degree for "200m" ,0.004491 degree for "500m", 0.008983 degree for "1000m" files.
- No_data value: -9999
- Data type: Int16 for "count" files and Float32 for "rh*" files.
Application and Derivation
Global vegetation is a critical variable influencing ecosystem dynamics and global carbon balance studies. With the increasing availability of space-borne LiDAR measurements, including those from instruments like the Global Ecosystem Dynamics Investigation, the opportunity to measure vegetation from space is expanding. However, the diversity of these instruments introduces challenges stemming from disparate spatial resolutions, distinct orbital patterns, and varying measurement properties.
This gridded, intercalibrated dataset supports comprehensive vegetation studies at a global extent. The sampling-based measurements provided by the LiDAR instruments provide sparse measurements. By aggregating the measurements to different resolutions, the estimates of the height improve, and the effect of geolocation errors are mitigated making the data suitable for analysis.
The relative height metrics provide data on vegetative structure. The RH98 metric represents the vegetation canopy, whereas the RH25, RH50, and RH75 metrics provide information on heights of subcanopy strata.
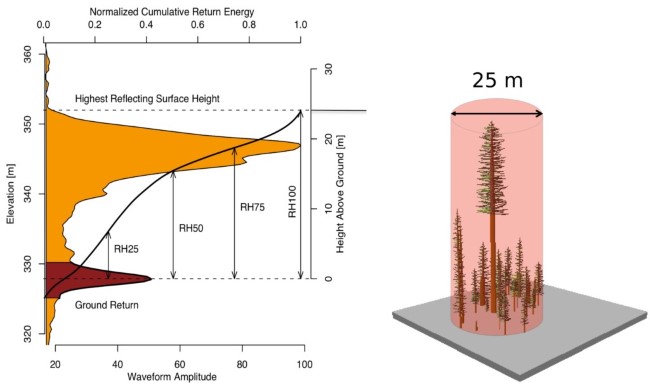
Figure 2. An idealized GEDI lidar waveform. Relative Height (RH) metrics give the height at which a certain quantile of returned energy is reached relative to the ground. Source: https://gedi.umd.edu/mission/technology
Quality Assessment
Uncertainty is inversely related to the number of aggregated shots (the "count" metric) inside each pixel. Filtering can be applied on a pixel level by using the count layer that provides the number of measurements used for each aggregation level. Low count values indicate that the mean value provided may not be representative of the overall grid cell average value. The intercalibration method proposed and applied to the ICESat-2 data provides a reduction in the bias between these two instruments measurements. However, there might still be discrepancies, as the inter-calibration area (overlap between 50 degrees N and 52 degrees N may not be representative of the various conditions encountered over the whole boreal domain.
Data Acquisition, Materials, and Methods
This dataset provides global rasters of L2A relative height metrics for vegetation from the Global Ecosystem Dynamics Investigation (GEDI) and from Ice, Cloud, and Land Elevation Satellite-2 (ICESat-2) at 100-, 200-, 500-, and 1000-m spatial resolutions.
The GEDI data were L2A Elevation and Height Metrics V002 (Dubajay et al., 2021) from 2019 to 2022.
The ICESat-2 data were based on the orbital measurements from ATLAS/ICESat-2 L3A ATL08, Land and Vegetation Height data product in 2019, 2020, and 2021, from April to October above 51 °N. (Neuenschwander et al., 2020). This data set contains along-track heights for the ground and canopy surfaces gridded at 100 m (available at: https://nsidc.org/data/atl08).
The GEDI data (from 51.6°S to 51.6°N) included relative height metrics at the 50th, 75th, 90th and 98th percentiles and were obtained from the 25-m resolution product (; Dubayah et al., 2021; Dubayah et al., 2020). The following filters are applied:
- Quality flag equal to 1
- Degrade flag in [0, 3, 8, 10, 13, 18, 20, 23, 28, 30, 38, 40, 43, 48, 60, 63, 68]
- Number of detected modes greater than 0
- Less than 10% water persistence
- Sensitivity above 0.92 in tropical regions (4,5,6)
- Sensitivity above 0.97 outside of the tropical regions
- The difference between the lowest mode and the Shuttle Radar Topography Mission reference elevation must be <75 m.
- Only the full power beam data is used
For each pixel at a resolution, the average number of observations falling inside that pixel is used.
Intercalibration
Due to the different definitions and mechanisms of lidar sensors between GEDI and ICESat-2, the same relative height (RH) metrics retrieved from ICESat-2 can have a systematic bias compared to the corresponding GEDI RH retrievals. To calibrate ICESat-2 height metrics to GEDI (removing the systematic error), height metrics from both GEDI and ICESat-2 datasets were extracted for the overlapping land regions over a 2-degree latitudinal band (50°N to 52°N). Using the 100-m pixels from both instruments, a set of gradient boosted tree models was developed to relate a whole ICESat-2 waveform to a given target GEDI relative height metric. Models were developed for four different land covers based on the Copernicus Landcover classification (Buchhorn et al., 2020):
- For the shrubs, herbaceous, moss, and croplands: 20, 30, 40, 60, 90, 100
- For the evergreen needle leaf forests: 111, 121
- For the deciduous needle leaf: 113, 123
- And one for the deciduous broad leaf and other forests: 114, 124, 125, 126
These models were then applied over the ICESat-2 data found in the arctic domain to reduce the bias in the ICESat-2 relative height metrics compared to those from GEDI.
User Note
Filtering can be applied on a pixel level by using the count layer that provides the number of measurements used for each aggregation level. Low values indicate that the mean value provided may not be representative of the overall grid cell average value.
The intercalibration method applied to the ICESat-2 data reduces the bias between these two instruments measurements. However, there might still be discrepancies because the intercalibration area (overlap between 50°N and 53°N) may not be representative of the various conditions encountered over the whole boreal domain.
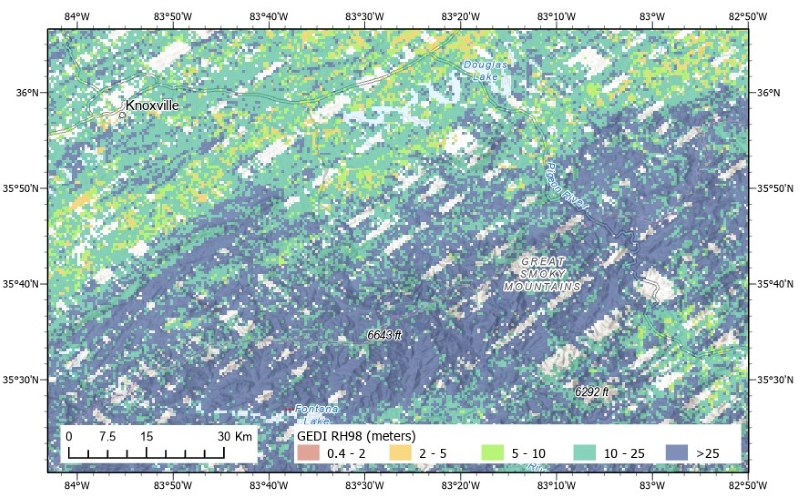
Figure 3. Estimated canopy height (RH98) from GEDI at 500-m resolution for the landscape south and east of Knoxville, Tennessee, U.S. This map depicts a portion of the Great Smoky Mountains National Park in eastern Tennessee and western North Carolina along with the Ridge-and-Valley Province of the Appalachian mountains located north and west of the national park. Source: gedi_rh98_500m.tif
Data Access
These data are available through the Oak Ridge National Laboratory (ORNL) Distributed Active Archive Center (DAAC).
Global Vegetation Height Metrics from GEDI and ICESat2
Contact for Data Center Access Information:
- E-mail: uso@daac.ornl.gov
- Telephone: +1 (865) 241-3952
References
Buchhorn, M., B. Smets, L. Bertels, B.D. Roo, M. Lesiv, N.-E. Tsendbazar, M. Herold, and S. Fritz. 2020. Copernicus Global Land Service: Land Cover 100m: collection 3: epoch 2019: Globe. Zenodo. https://doi.org/10.5281/zenodo.3939050
Dubayah, R., J.B. Blair, S. Goetz, L. Fatoyinbo, M. Hansen, S. Healey, M. Hofton, G. Hurtt, J. Kellner, S. Luthcke, J. Armston, H. Tang, L. Duncanson, S. Hancock, P. Jantz, S. Marselis, P.L. Patterson, W. Qi, and C. Silva. 2020. The Global Ecosystem Dynamics Investigation: High-resolution laser ranging of the Earth’s forests and topography. Science of Remote Sensing 1:100002. https://doi.org/10.1016/j.srs.2020.100002
Dubayah, R., M. Hofton, J. Blair, J. Armston, H. Tang, S. Luthcke. 2021. GEDI L2A Elevation and Height Metrics Data Global Footprint Level V002. Distributed by NASA EOSDIS Land Processes Distributed Active Archive Center, https://doi.org/10.5067/GEDI/GEDI02_A.002
Lee, J., S. Favrichon, S. Mauceri, Y. Yang, J. Armston, and S. Saatchi. 2023. Addressing underestimation in global forest structure mapping. https://doi.org/10.22541/essoar.167276451.10705079/v1
Neuenschwander, A.L., K.L. Pitts, B.P. Jelley, J. Robbins, B. Klotz, S. C. Popescu, R.F. Nelson, D. Harding, D. Pederson, and R. Sheridan. 2020. ATLAS/ICESat-2 L3A Land and Vegetation Height, version 3. NASA National Snow and Ice Data Center Distributed Active Archive Center. https://doi.org/10.5067/ATLAS/ATL08.003