Documentation Revision Date: 2024-02-29
Dataset Version: 1
Summary
There are 48 files in cloud-optimized GeoTIFF (COG) format with this dataset.
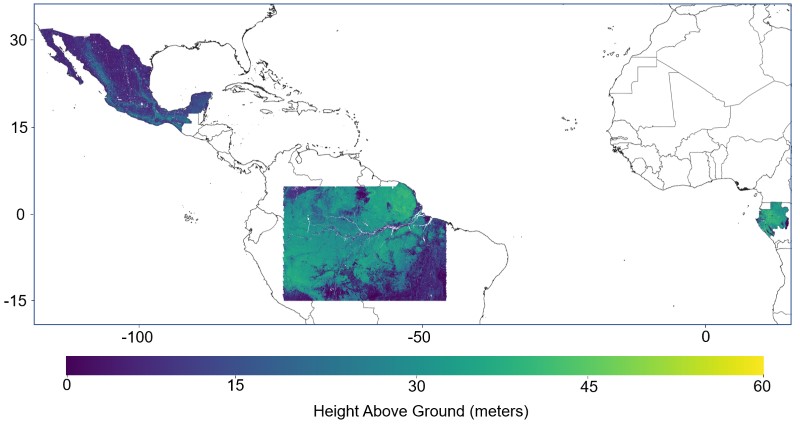
Figure 1. Forest canopy height from GEDI-TDX data fusion over Gabon, Mexico, French Guiana and the Amazon Basin. Source: height_mexico_25m.tif, height_gabon_25m.tif, height_frenchguiana_25m.tif, height_amazon_25m.tif
Citation
Dubayah, R.O., W. Qi, J. Armston, T. Fatoyinbo, K. Papathanassiou, M. Pardini, A. Stovall, C. Choi, and V. Cazcarra-Bes. 2023. Pantropical Forest Height and Biomass from GEDI and TanDEM-X Data Fusion. ORNL DAAC, Oak Ridge, Tennessee, USA. https://doi.org/10.3334/ORNLDAAC/2298
Table of Contents
- Dataset Overview
- Data Characteristics
- Application and Derivation
- Quality Assessment
- Data Acquisition, Materials, and Methods
- Data Access
- References
Dataset Overview
This dataset includes maps of canopy height and aboveground biomass at spatial resolutions of 25 m and 100 m for Mexico, Gabon, French Guiana, and the Amazon Basin. The GEDI-TanDEM-X (GTDX) fusion maps were created by combining data from NASA's Global Ecosystem Dynamics Investigation (GEDI) Version 2 footprint data (from 2019-04-18 to 2021-08-18) and TanDEM-X (abbreviated as TDX) Interferometric Synthetic Aperture Radar (InSAR) images (from 2011-01-06 to 2020-12-31). The GTDX canopy height maps were generated by using the TDX coherence maps to invert the TDX height and subsequently using GEDI canopy height as reference data to calibrate the inverted height. The GTDX aboveground biomass maps were produced based on a generalized hierarchical model-based (GHMB) framework that utilizes GEDI biomass as training data to establish models for estimating biomass based on the GTDX canopy height. The dataset also includes maps of canopy height uncertainty, biomass uncertainty, and ancillary data including a regional modeling parameter and forest disturbance. The uncertainty of GTDX canopy height was estimated for each pixel by propagating the GEDI-TDX model error to each GTDX pixel prediction. The uncertainty of GTDX aboveground biomass was estimated by considering the error in both the GEDI footprint biomass data and the GEDI-TDX model, and then applying it to each GTDX biomass pixel prediction. The regional model parameter indicates the size of the analysis window (2 to 50 km or country wide) used for each pixel. The forest disturbance information identifies pixels where disturbance occurred between 2011 and 2020, and provides the year of last disturbance.
Project: Global Ecosystem Dynamics Investigation (GEDI)
The Global Ecosystem Dynamics Investigation (GEDI) produces high resolution laser ranging observations of the 3D structure of the Earth. GEDI’s precise measurements of forest canopy height, canopy vertical structure, and surface elevation greatly advance our ability to characterize important carbon and water cycling processes, biodiversity, and habitat. GEDI was funded as a NASA Earth Ventures Instrument (EVI) mission. It was launched to the International Space Station in December 2018 and completed initial orbit checkout in April 2019. The lower-level science data products (L1B, L2A, and L2B) are available from the Land Processes DAAC (https://lpdaac.usgs.gov/), and the higher-level products (L3, L4A, and L4B) are available from ORNL DAAC. L3 provides gridded canopy and land surface metrics. L4A and L4B provide aboveground biomass density at footprint and grid levels.
Related publication
Qi, W., J. Armston, C. Choi, A. Stovall, S. Saarela, M. Pardini, L. Fatoyinbo, K. Papathanasiou, and R. Dubayah. 2023. Mapping large-scale pantropical forest canopy height by integrating GEDI lidar and TanDEM-X InSAR data. PREPRINT (Version 1) available at Research Square. https://doi.org/10.21203/rs.3.rs-3306982/v1
Acknowledgements
This research was funded by NASA's Global Ecosystem Dynamics Investigation (GEDI) mission (grant NNL15AA03C) and The Carbon Monitoring System (CMS, grant 80NSSC20K0023).
Data Characteristics
Spatial Coverage: Mexico, Gabon, French Guiana, and the Amazon Basin
Spatial Resolution: 25 m and 100 m
Temporal Coverage: The data cover the period 2011-01-06 to 2021-08-18.
Study Area: Latitude and longitude are given in decimal degrees.
| Study Area | Westernmost Longitude | Easternmost Longitude | Northernmost Latitude | Southernmost Latitude |
|---|---|---|---|---|
| Amazon Basin | -75.0 | -44.9 | 5.0 | -15.01 |
| French Guiana | -55.0 | -50.9 | 6.0 | 1.9 |
| Gabon | 9.0 | 15.1 | 3.0 | -4.1 |
| Mexico | -118.0 | -86.0 | 33.0 | 13.9 |
Data file information
There are 48 files in cloud-optimized GeoTIFF (COG) format with this dataset.
The data include canopy height, uncertainty of canopy height, aboveground biomass, uncertainty of aboveground biomass, regional model parameter, and forest disturbance record at spatial resolutions of both 25 m and 100 m for Mexico, Gabon, French Guiana, and the Amazon Basin (12 files for each study area).
The file naming convention is <variable>_<loc>_<res>.tif, where
- <variable> = "biomass", "biomass_uncertainty", "height", "height_uncertainty", "disturbance", or "model_selection" (see Table 1).
- <loc> = "amazon" (Amazon Basin), "frenchguiana" (French Guiana), "gabon" (Gabon), or "mexico" (Mexico).
- <res> = "25m" or "100m" spatial resolution
Table 1. GeoTIFF file types with descriptions.
| File name | Units | Description |
|---|---|---|
| biomass_<loc>_<res>.tif | Mg ha-1 | Aboveground biomass in forests; mean estimate |
| biomass_uncertainty_<loc>_<res>.tif | Mg ha-1 | Uncertainty in estimated aboveground biomass; standard error of mean estimate. |
| height_<loc>_<res>.tif | m | Forest canopy height in meters; mean estimate |
| height_uncertainty_<loc>_<res>.tif | m | Uncertainty in estimated forest canopy height; standard error of mean estimate. |
| disturbance_<loc>_<res>.tif | y | Year for last forest disturbance in 2011-2020. 0 = no disturbance. Values 1 to 10 = year of disturbance - 2010. For example., "2" indicates disturbance in 2012 |
| model_selection_<loc>_<res>.tif | 1 | Model parameter indicating size of analysis window used in calibration. Values 0 to 12 correspond to windows of 2 to 50 km across, in 4-km intervals. Value of 13 indicates a study area-wide window was used. |
GeoTIFF characteristics
- Coordinate system: geographic coordinates in WGS 84 datum (EPSG 4326)
- Pixel size: 0.00025 degree for 25-m resolution files, 0.001 for 100-m resolution files.
- No_data value: -9999
- Data type: Float32
Application and Derivation
GTDX canopy height and biomass products can be used to improve the quantification of terrestrial carbon stocks and change. They also have practical applications, such as estimating forest timber volume, assessing forest degradation, deforestation and regrowth, and modeling primary production, biodiversity and other key ecosystem variables. In addition, these data are essential for the production of jurisdictional forest biomass and carbon stock estimates, which can help these countries develop their National Determined Contribution reports for climate pledges under the Paris Agreement and help them achieve the UN Sustainable Development Goals.
Quality Assessment
Our GEDI-TDX (GTDX) canopy height product was compared against airborne laser scanning derived canopy height for accuracy analysis. RMSE was found to be 6-7 m at 100-m spatial resolution and 7-9 m at 25-m resolution across the four sites. Uncertainty was estimated for each pixel of the canopy height map based on model-based inference by propagating the GEDI-TDX model error to each pixel. Uncertainty of our GTDX biomass product was estimated for each pixel based on generalized hierarchical model based (GHMB) inference by accounting for the error in both the GEDI footprint biomass data and the GEDI-TDX model, and applying it to each GTDX biomass pixel prediction.
See Qi et al. (2023) for details.
Data Acquisition, Materials, and Methods
This dataset provides maps of canopy height and aboveground biomass at spatial resolutions of 25 m and 100 m for Mexico, Gabon, French Guiana, and the Amazon Basin. These GEDI-TanDEM-X (GTDX) fusion maps were created from NASA’s Global Ecosystem Dynamics Investigation (GEDI) Version 2 footprint data collected from 2019-04-18 to 2021-08-18, and TanDEM-X (TDX) Interferometric Synthetic Aperture Radar (InSAR) images acquired between 2011-01-06 and 2020-12-31 (Krieger et al., 2014; Lachaise et al., 2021).
GTDX canopy height maps were produced using TDX coherence, and GEDI L1B (Dubayah et al., 2021a) and L2A (Dubayah et al., 2021b) data products (filtered with quality flags and only retaining shots with a beam sensitivity > 0.95). The GEDI L1B product was used to estimate the mean vertical reflectivity of scatterers for inverting TDX canopy height. The RH98 metric of the GEDI L2A product was then used to establish adaptive-window linear calibration models with the inverted TDX height, using TDX vertical wavenumber as a correction factor. Uncertainty of GTDX canopy height was estimated for each pixel by propagating the GEDI-TDX model error to each pixel prediction. GTDX aboveground biomass maps were created within a generalized hierarchical model-based (GHMB) framework, which used GEDI biomass as training data to establish regionalized biomass-height models for GTDX canopy height. Uncertainty of aboveground biomass was estimated by considering both the error in the GEDI footprint biomass data and the GEDI-TDX model, and then applying it to each GTDX biomass pixel prediction.
Model calibration involved using a moving window that was adjusted dynamically for each map pixel. The size of the window was enlarged or reduced to ensure a sufficient number of GEDI samples given local landscape characteristics. If the window is too small, the models may be statistically unstable and the predictions noisy. Conversely, an excessively large window results in overgeneralized models that do not consider local conditions affecting canopy height in the pixel. The optimal window size depended on the spatial distribution of GEDI shots and the homogeneity of forest cover, forest structure, and terrain. The model_selection maps provide the window size used for each pixel. These sizes ranged from 2 km across to 50 km across to a window encompassing the entire study area or country.
Forest disturbances could explain some discrepancies between the TDX and GEDI data. Therefore, disturbed areas were identified from a global 2000-2020 land cover and land use change dataset derived from Landsat images (Potapov et al., 2022). The included disturbance maps indicate pixels that experienced forest disturbance between 2011-2020. These maps allow users to make informed decisions about using canopy height and biomass estimates for a particular location.
See Qi et al. (2023) for details of methodology and results from this project.
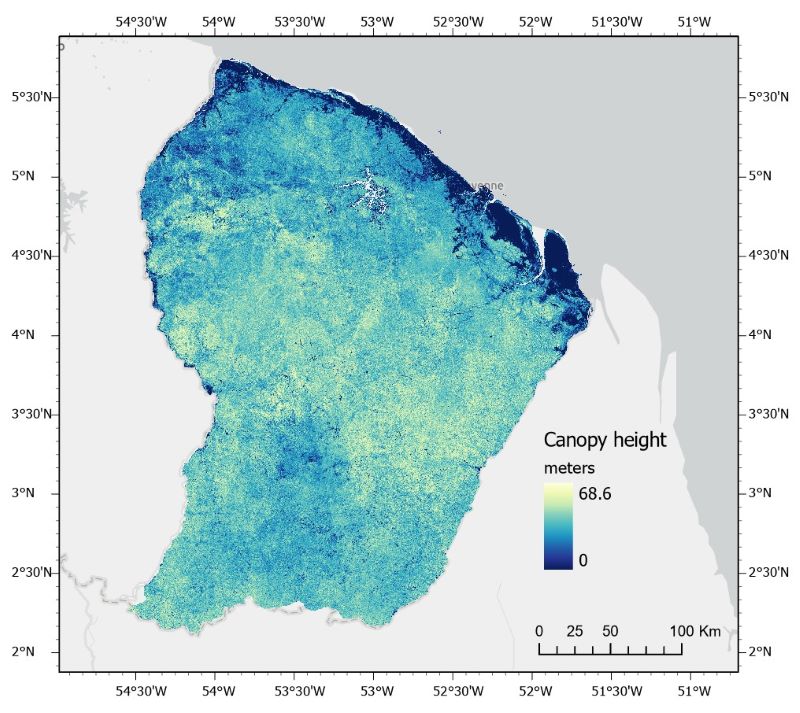
Figure 2. Forest canopy height for French Guiana estimated from fusion of GEDI and TanDEM-X data.
Data Access
These data are available through the Oak Ridge National Laboratory (ORNL) Distributed Active Archive Center (DAAC).
Pantropical Forest Height and Biomass from GEDI and TanDEM-X Data Fusion
Contact for Data Center Access Information:
- E-mail: uso@daac.ornl.gov
- Telephone: +1 (865) 241-3952
References
Dubayah, R., S. Luthcke, J. Blair, M. Hofton, J. Armston, and H. Tang. 2021a. GEDI L1B Geolocated Waveform Data Global Footprint Level V002. NASA EOSDIS Land Processes Distributed Active Archive Center. https://doi.org/10.5067/GEDI/GEDI01_B.002.
Dubayah, R., M. Hofton, J. Blair, J. Armston, H. Tang, and S. Luthcke. 2021b. GEDI L2A Elevation and Height Metrics Data Global Footprint Level V002. NASA EOSDIS Land Processes Distributed Active Archive Center. https://doi.org/10.5067/GEDI/GEDI02_A.002
Krieger, G., M. Zink, M. Bachmann, B. Bräutigam, D. Schulze, M. Martone, P. Rizzoli, U. Steinbrecher, J. Walter Antony, F. De Zan, I. Hajnsek, K. Papathanassiou, F. Kugler, M. Rodriguez Cassola, M. Younis, S. Baumgartner, P. López-Dekker, P. Prats, and A. Moreira. 2013. TanDEM-X: A radar interferometer with two formation-flying satellites. Acta Astronautica 89:83–98. https://doi.org/10.1016/j.actaastro.2013.03.008
Lachaise, M., M. Bachmann, T. Fritz, M. Huber, B. Schweisshelm, and B. Wessel. 2021. The TanDEM-X Change DEM: the new temporal DEM of the TanDEM-X Mission. Presented at the EUSAR 2021; 13th European Conference on Synthetic Aperture Radar. https://ieeexplore.ieee.org/document/9472607
Potapov, P., X. Li, A. Hernandez-Serna, A. Tyukavina, M.C. Hansen, A. Kommareddy, A. Pickens, S. Turubanova, H. Tang, C.E. Silva, J. Armston, R. Dubayah, J.B. Blair, and M. Hofton. 2021. Mapping global forest canopy height through integration of GEDI and Landsat data. Remote Sensing of Environment 253:112165. https://doi.org/10.1016/j.rse.2020.112165
Qi, W., J. Armston, C. Choi, A. Stovall, S. Saarela, M. Pardini, L. Fatoyinbo, K. Papathanasiou, and R. Dubayah. 2023. Mapping large-scale pantropical forest canopy height by integrating GEDI lidar and TanDEM-X InSAR data. Research Square. https://doi.org/10.21203/rs.3.rs-3306982/v1