Get Data
Revision Date: March 27, 2014
Summary:
This data set provides MODIS-derived surface biophysical climatologies of bidirectional distribution function (BRDF), BDRF/albedo, land surface temperature (LST), leaf area index (LAI), and evapotranspiration (ET) as separate files for each of the MODIS land cover types, and four radiative forcing data files for four scenarios of potential vegetation shifts in North America. Each biophysical variable has temporal periods that represent the average of all 8-day periods from the years 2000 – 2012. The data have a spatial resolution of 0.05 degree (~5 km) and a temporal resolution of eight days. Additionally, a file containing diffuse fraction of surface downward solar radiation (DiffuseFraction) at a monthly scale, and a file containing snow water equivalent (SWE) are provided. The extent of the data covers the land area of North America, from 20 to 60 degrees N.
The land-cover map used was synthesized from nine yearly 500-m MODIS land-cover layers (MCD12 Q1 Collection 5) for 2001-2008.
These high-resolution land data were originally developed for quantifying biophysical forcing from land-use changes associated with forestry activities, such as radiative forcing from altered surface albedo.
There are 67 files in this data set. Sixty-six files are provided in version 4, NetCDF format (nc4); sixty-one files are MODIS surface climatology variables, one file is for the calculation of SWE, and four files are radiative forcing data. One file provides the diffuse fraction of surface downward solar radiation, and it is in NetCDF (.NC) format.
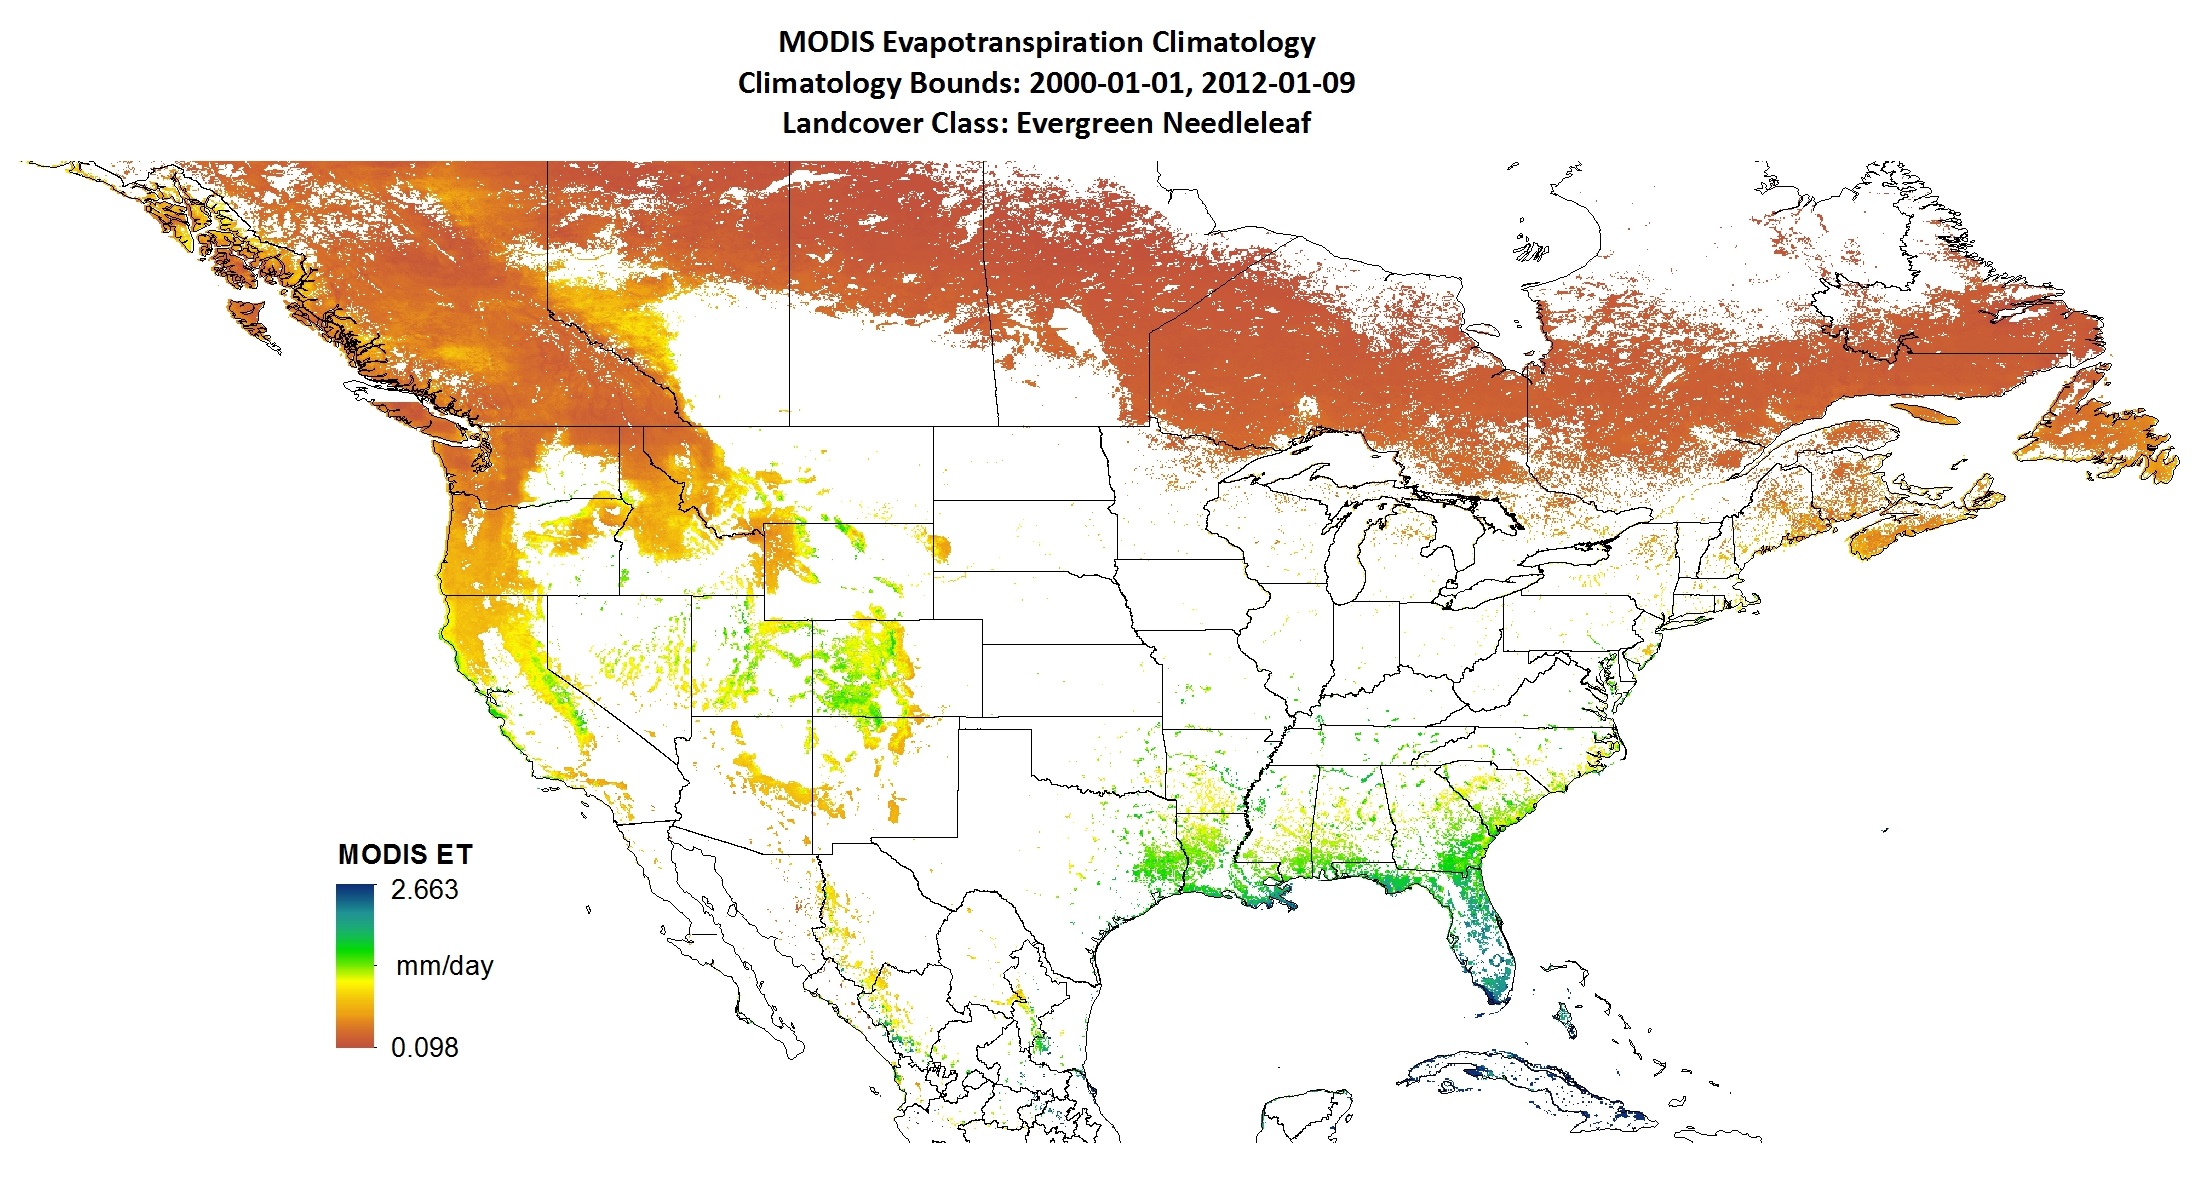
Figure 1. MODIS evapotranspiration climatology for evergreen needle leaf land cover. MODIS ET is averaged for the 8-day period Jan 1 – Jan 9 over the time period 2000 – 2012.
Data Citation:
Cite this data set as follows:
Zhao, K., and R.B. Jackson. 2014. MODIS-derived Biophysical Parameters for 5-km Land Cover, North America, 2000-2012. Data set. Available on-line [http://daac.ornl.gov] from Oak Ridge National Laboratory Distributed Active Archive Center, Oak Ridge, Tennessee, USA. http://dx.doi.org/10.3334/ORNLDAAC/1210
Table of Contents:
- 1 Data Set Overview
- 2 Data Characteristics
- 3 Applications and Derivation
- 4 Quality Assessment
- 5 Acquisition Materials and Methods
- 6 Data Access
- 7 References
1. Data Set Overview:
This MODIS-derived data set quantifies the biophysical forcing from land-use changes associated with vegetation shifts and forestry activities. The specific biophysical variables archived here include BRDF/albedo, land surface temperature, leaf area index, and evapotranspiration. The spatial extent of the data covers the land area of North America, spanning from 20 degrees N to 60 degrees N; the data have a spatial resolution of 0.05 degree and a temporal solution of eight days. The data set represents surface climatology and has been derived by averaging the MODIS standard land products over 2000-2012. Moreover, the data represent vegetation-specific biophysical variables for a total of 16 land covers (see Table 1 below).
This data set provides reliable observations that are valuable for surface biophysical modeling applications; especially for parameterzing and validating land surface conversion schemes. Radiative forcing data for potential vegetation shifts in North America, which were derived from this MODIS synthesis data, were also supplied here to demonstrate the applications of this MODIS-derived data set.
2. Data Characteristics:
There are 67 files in this data set. This includes 66 files in NetCDF format (nc.4, version 4). The bulk of these data are MODIS surface climatology variables (61 files). Also, there is one file for the calculation of snow water equivalent (SWE), and four files representing radiative forcing induced by albedo change from altered vegetation, also in NetCDF format (.nc4). In addition, there is one file that provides the diffuse fraction of surface downward solar radiation, and it is in NetCDF (.NC) format.
The naming convention for the NetCDF data files is:
MODIS_VAR_LC##.nc4
Where “VAR” is one of the four biophysical variables, (ALBEDO, ET (evapotranspiration), LST (land surface temperature), and LAI (leaf area index)) and “LC##” is a two-digit number representing land class.
Example file name: MODIS_ALBEDO_LC01.nc4
The particular land class code for “LC” is from the IGBP scheme and is summarized in Table 1.
Table 1. The IGBP land-class scheme
| LC | IGBP |
|---|---|
| 1 | Evergreen Needleleaf forest |
| 2 | Evergreen Broadleaf forest |
| 3 | Deciduous Needleleaf forest |
| 4 | Deciduous Broadleaf forest |
| 5 | Mixed forest |
| 6 | Closed shrublands |
| 7 | Open shrublands |
| 8 | Woody savannas |
| 9 | Savannas |
| 10 | Grasslands |
| 11 | Permanent wetlands |
| 12 | Croplands |
| 13 | Urban and built-up |
| 14 | Cropland/Natural vegetation mosaic |
| 15 | Snow and ice |
| 16 | Barren or sparsely |
The NetCDF files are self-describing and follow Climate and Forecasting (CF) metadata conventions. The CF standard provides an internal description of each data variable represented, and the spatial and temporal properties of each file.
Table 2. Biophysical variables contained in each type of NetCDF file
| MODIS variable | Full name | Scaling factor | Unit |
|---|---|---|---|
| Albedo/BRDF | band_geo ,band_vol, band_iso (see Eq. 2) | 0.0001 | unitless |
| ET | Evapotraspiration | 0.001 | mm/day |
| LAI | Leaf area index | 0.01 | m2/m2 |
| LST_Day LST_ Night | Daytime/Nighttime land surface temperature | 0.02 | degrees K |
| RF | Radiative forcing at the top of the atmosphere | 1 | W/m2 |
| SWE | This file provides the snow water equivalent derived from the Advanced Microwave Scanning Radiometer-Earth Observing System (AMSE-E) data (see Figure 2 below). Note that this file is in an Equal-Area Scalable Earth Grid (EASE-Grid) Coordinate Reference System (see https://nsidc.org/data/ease/ease_grid.html for more information). | .01 | mm |
| Surface Diffuse Solar Fraction | This file provides the diffuse fraction of surface downward solar radiation at a monthly scale for North America. These diffuse fractions represent the averages over 2001-2005 and were output from regional climate modeling. |
Time dimension
The time dimension in each MODIS_VAR_LC##.nc4 file is not typical time series data, but instead represents a climatology. For example, the first time step of ET represents the mean ET for all thirteen 8-day periods (2000-01-01 to 2000-01-08, 2001-01-01 to 2001-01-08, …,2012-01-01 to 2012-01-08 from 2000 to 2012. In these NetCDF files, the variable “time” has a companion variable “climatology_bounds”. Its data are:
climatology_bounds =
"2000-01-01", "2012-01-09",
"2000-01-09", "2012-01-17",
"2000-01-17", "2012-01-25",
"2000-01-25", "2012-02-02",
….
Combined with the time attribute: time:climatology = "climatology_bounds”. This CF netCDF convention defines a climatology time series instead of a regular time series.
Calendar
The time calendar used in these files is a standard calendar, with leap-year considered.
Scale Factor
Scaling factors typically apply for each of the MODIS climatology variables. See Table 2 or the metadata information contained within each NetCDF file.
Spatial Reference
All files are in a geographic Lat/Lon coordinate reference system.
Geographic Coordinate Reference: GCS_WGS_1984
GEOGCS["GCS_WGS_1984",DATUM["D_WGS_1984",SPHEROID["WGS_1984",6378137.0,298.257223563]],
PRIMEM["Greenwich",0.0],
UNIT["Degree",0.0174532925199433],
AUTHORITY["EPSG",4326]]
Radiative Forcing
Four files that demonstrate radiative forcing induced by albedo change from altered vegetation are also included. The naming convention for radiative forcing data is “LC##toLC##_RF.nc4” where “LC##” and “LC##” are the vegetation codes as in Table 1. Only four types of potential vegetation conversions are provided, including conversion from cropland (LC12) or grassland (LC10) to evergreen needleleaf (LC01) or deciduous broadleaf forests (LC04). Radiative forcings represent the local shortwave radiative energy imbalance at the top of the atmosphere as a result of altered albedo change from the vegetation shift; its unit is W/m2 (Table 2). Radiative forcings can be converted to a net carbon emission metric for quantifying biophysical climate regulation values of ecosystems. More details can be found in Zhao & Jackson (2014).
Special Notes
A special note on the MODIS_ALBEDO files: The variables stored in the MODIS ALBEDO NetCDF files are not albedo but BRDF parameters that can be used to calculate white-sky or black-sky albedos. There are nine BRDF parameters (i.e., 3 per band for a total of 3 broadbands). For example, the three parameters for the shortwave band are named SW_iso, SW_vol, and SW_geo.
(1)
α_bs (θ)=bnd_iso+bnd_vol*(-0.007574-0.070987*θ^2 +0.307588
*θ^3) + bnd_geo*(-1.284909-0.166314 *θ^2
+0.041840*θ^3)
α_ws=bnd_iso+bnd_vol*0.189184- bnd_geo*1.377622
α_act=α_bs (θ)*(1-f) +α_ws*f
where θ is the local solar angle, f is the ratio of diffuse downward solar radiation to the total downward fraction, and “bnd” is one of the three broadbands: SW for shortwave, Vis for visible, and NIR for near-infrared.
In Eq. 1, the local solar zenith angle θ at a latitude φ for a local time H on a day D can be calculated using the following equations:
(2)
ξ=2π(D-1)/365
δ=0.006918-0.399912*cosξ+0.070257*sinξ- 0.006758*cos2ξ
+0.000907*sin2ξ -0.002697*cos3ξ + 0.00148*sin3ξ
cosθ=sin(φπ/180) sin(δ)+cos(φπ/180) cos(δ) cos[0.2618(H-12)]
where the latitude is in degrees (i.e., -90 - 90), H is in hours (i.e., 0 - 24), and D is in days (i.e., 1-365).
Companion Files
There are two companion files included with this data set:
- solarZenithAngle.m: A Matlab script which contains a function to compute the local solar zenith angle θ for any given time for any given latitude.
- NA_MODIS_Surface_Biophysics.pdf: A PDF of this html document.
Site Boundaries: (All latitude and longitude given in decimal degrees)
| Site (Region) | Westernmost Longitude | Easternmost Longitude | Northernmost Latitude | Southernmost Latitude |
|---|---|---|---|---|
| North America | -160 | -40 | 60 | 20 |
Time period:
- The data set covers the period 2000/01/01 to 2012/12/31.
3. Data Application and Derivation:
This satellite-based data set provides information valuable for those applications requiring reliable surface biophysical observations. The vegetation-specific biophysics can be used to directly parameterize or assess land surface biophysical models. The data are particularly useful for assessing biophysical impacts of land-use change or vegetation shifts on climate.
Figure 2 depicts latitudinal and seasonal variations in surface albedo for four vegetation types, as derived from this data set. The spatial-temporal pattern of albedo generally accords with the snow dynamics, as exemplified in snow water equivalent that was derived from the Advanced Microwave Scanning Radiometer-Earth Observing System (AMSE-E) data (this AMSR-E climatology of snow water equivalent is provided in the companion file “SWE.nc4”). Because of the snow-masking effect of trees, cropland and grassland show much higher albedo than forests during the cold season at high latitudes.
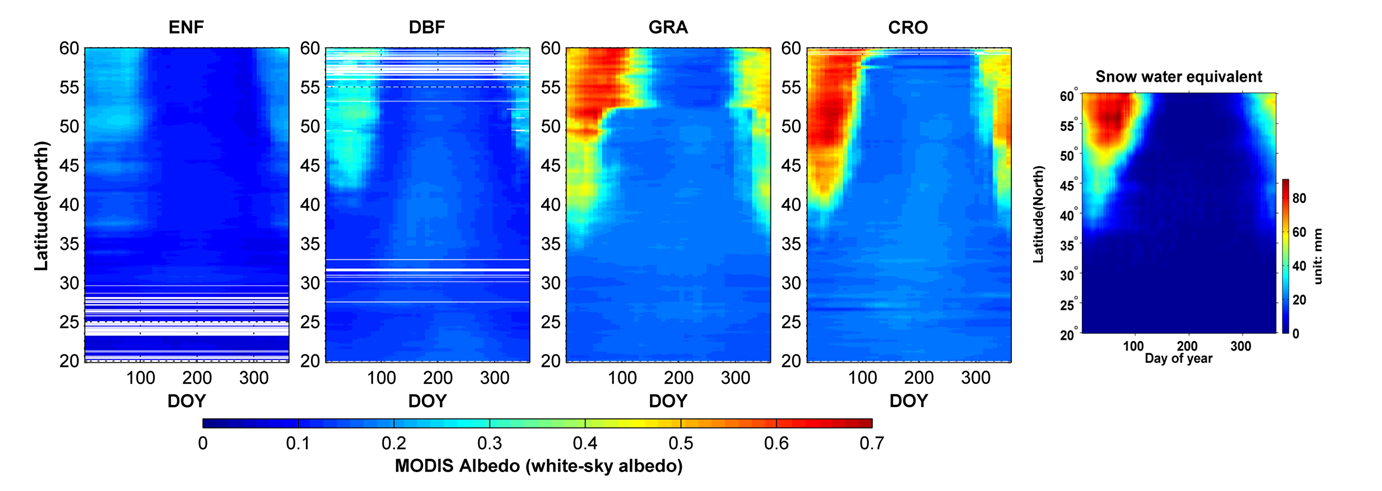
Figure 2. Latitudinal and seasonal variations in surface albedo over 20 degrees N – 60 degrees N in North America for four major vegetated land covers, including evergreen needleleaf forest (ENF), deciduous broadleaf forest (DBF), grassland (GRA), and cropland (CRO). Albedo depicted on each date represents the zonal mean value of MODIS white-sky albedo (WSA) averaged first temporally from Year 2000 through Year 2012 and then zonally over 140 degrees W – 60 degrees W. Large albedos are observed during snow seasons at high latitudes.
Zhao & Jackson (2014), for example, applied this data set to evaluate how land-use changes from forestry activities would impact climate via biophysical pathways, as opposed to climate mitigation from biological carbon sequestration.
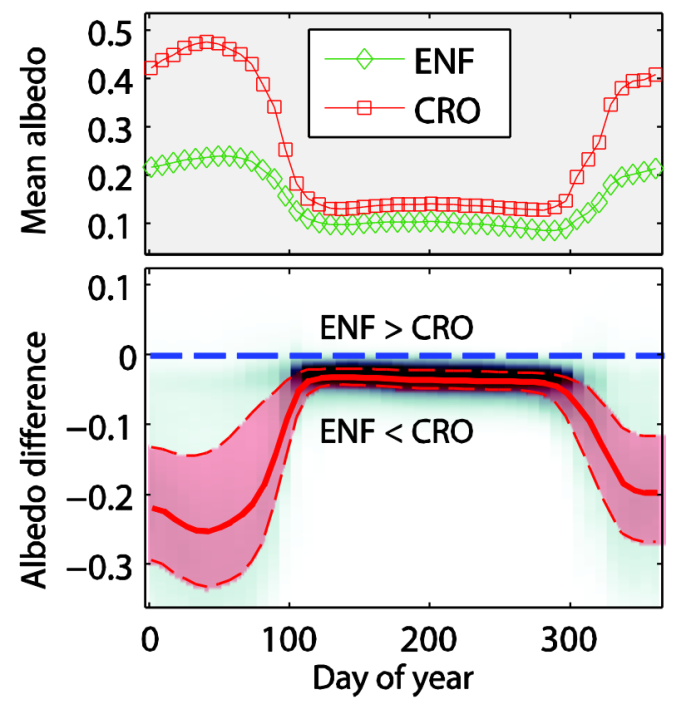
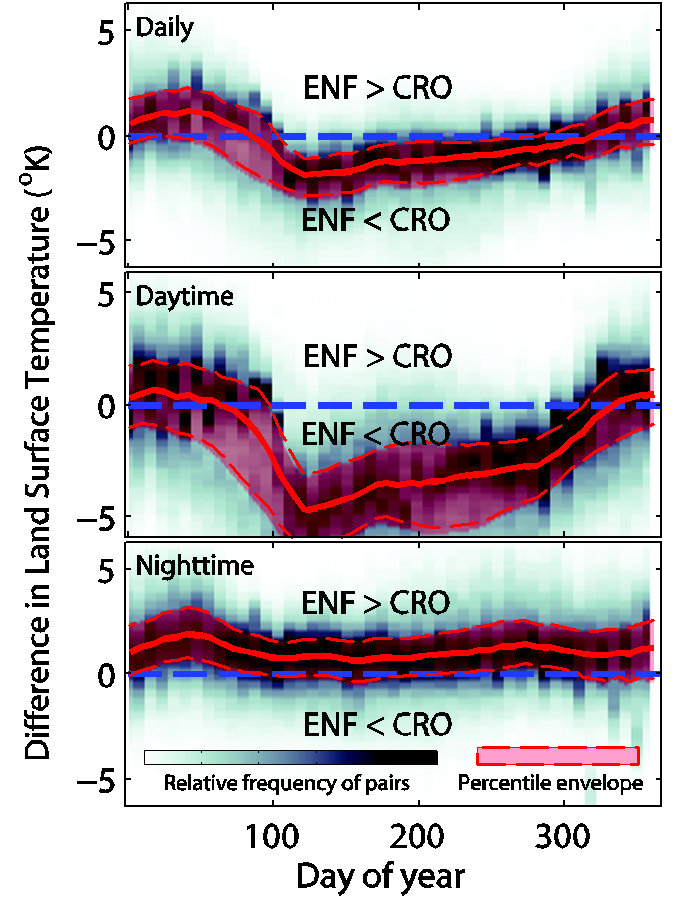
Figure 3. Systematic differences in surface biophysics exist between spatially-adjacent contrasting vegetation types, as depicted here for comparing albedo and land surface temperature between nearby evergreen needleleaf forest and cropland. The results were derived from this MODIS-based data set.
4. Quality Assessment:
This data set is a derivative product of existing satellite-derived products. The quality of this data set is determined directly by that of the existing satellite data sources. See the original data sources for more quality assessment information
5. Data Acquisition Materials and Methods:
This data set of vegetation-specific surface biophysics climatology was derived by stratifying the standard MODIS land products with respect to land cover. The input MODIS land products included 8-day 500-m bidirectional reflectance distribution function (BRDF)/Albedo (MCD43A1and A2 Collection 5) (Schaaf et al. 2002), 8-day 1-km daytime and nighttime LSTs (MOD11A2 Collection 5) (Wan et al. 2004), 8-day 1-km ET (MOD16A2) (Mu et al. 2011)., and 8-day 1-km Leaf Area Index-FPAR (MYD15A2). The particular land-cover map used was synthesized from nine yearly 500-m MODIS land-cover layers (MCD12 Q1 Collection 5) for 2001-2008 (Friedl et al. 2002).
In the synthesis process, a pixel was assigned a particular land class only if the pixel was classified as this class with at least a probability of 0.50 for more than five out of nine years; otherwise, the pixel was discarded from the analysis. This filtering helped to suppress the confounding effects of classification errors and potential land-cover changes that occurred between 2001 and 2008. Additionally, the resultant 500-m base map was aggregated to 1-km resolution, with a 1-km pixel labeled as a vegetation class only if its four 500-m component pixels all belonged to the same class; otherwise, the pixel was discarded from our analysis. However, when stratifying MODIS ET products, we instead used the 2001 1-km MODIS Collection-5 land-cover layer as the reference map because this layer is the actual baseline vegetation map used for generating the MODIS ET products.
6. Data Access:
This data is available through the Oak Ridge National Laboratory (ORNL) Distributed Active Archive Center (DAAC).
Data Archive Center:
Contact for Data Center Access Information:
E-mail: uso@daac.ornl.gov
Telephone: +1 (865) 241-3952
7. References:
Friedl, M. A., D. K. McIver, J. C. F. Hodges, X. Y. Zhang, D. Muchoney, A. H. Strahler, C. E. Woodcock, S. Gopal, A. Schneider, A. Cooper, A. Baccini, F. Gao, and C. Schaaf. 2002. Global land cover mapping from MODIS: algorithms and early results. Remote Sensing of Environment 83:287-302.
Kelly, R. E., A. T. Chang, L. Tsang, and J. L. Foster. 2003. A prototype AMSR-E global snow area and snow depth algorithm. Ieee Transactions on Geoscience and Remote Sensing 41:230-242.
Mu, Q., Zhao, M., and Running, S. W. 2011. Improvements to a MODIS global terrestrial evapotranspiration algorithm. Remote Sensing of Environment, 115, 1781–1800.
Myneni, R. B., Hoffman, S., Knyazikhin, Y., Privette, J. L., Glassy, J., Tian, Y., ... and Running, S. W. 2002. Global products of vegetation leaf area and fraction absorbed PAR from year one of MODIS data. Remote sensing of environment, 83(1), 214-231.
Schaaf, C. B., F. Gao, A. H. Strahler, W. Lucht, X. W. Li, T. Tsang, N. C. Strugnell, X. Y. Zhang, Y. F. Jin, J. P. Muller, P. Lewis, M. Barnsley, P. Hobson, M. Disney, G. Roberts, M. Dunderdale, C. Doll, R. P. d'Entremont, B. X. Hu, S. L. Liang, J. L. Privette, and D. Roy. 2002. First operational BRDF, albedo nadir reflectance products from MODIS. Remote Sensing of Environment 83:135-148.
Wan, Z., Y. Zhang, Q. Zhang, and Z. L. Li. 2004. Quality assessment and validation of the MODIS global land surface temperature. International Journal of Remote Sensing 25:261-274.
Zhao, K., and R.B. Jackson. 2014. Biophysical forcings of land-use changes from potential forestry activities in North America. Ecological Monographs. http://dx.doi.org/10.1890/12-1705.1