Documentation Revision Date: 2017-09-26
Data Set Version: 1
Summary
Peatlands represent a diversity of ecosystem types that vary considerably in vegetation structure, hydrology, composition, and peat depth. This type of mapping effort provides the spatially explicit information needed to allow for monitoring and assessment of these important carbon-rich ecosystems.
This dataset contains one file in GeoTIFF (*.tif) format and one compressed shapefile (*.zip).
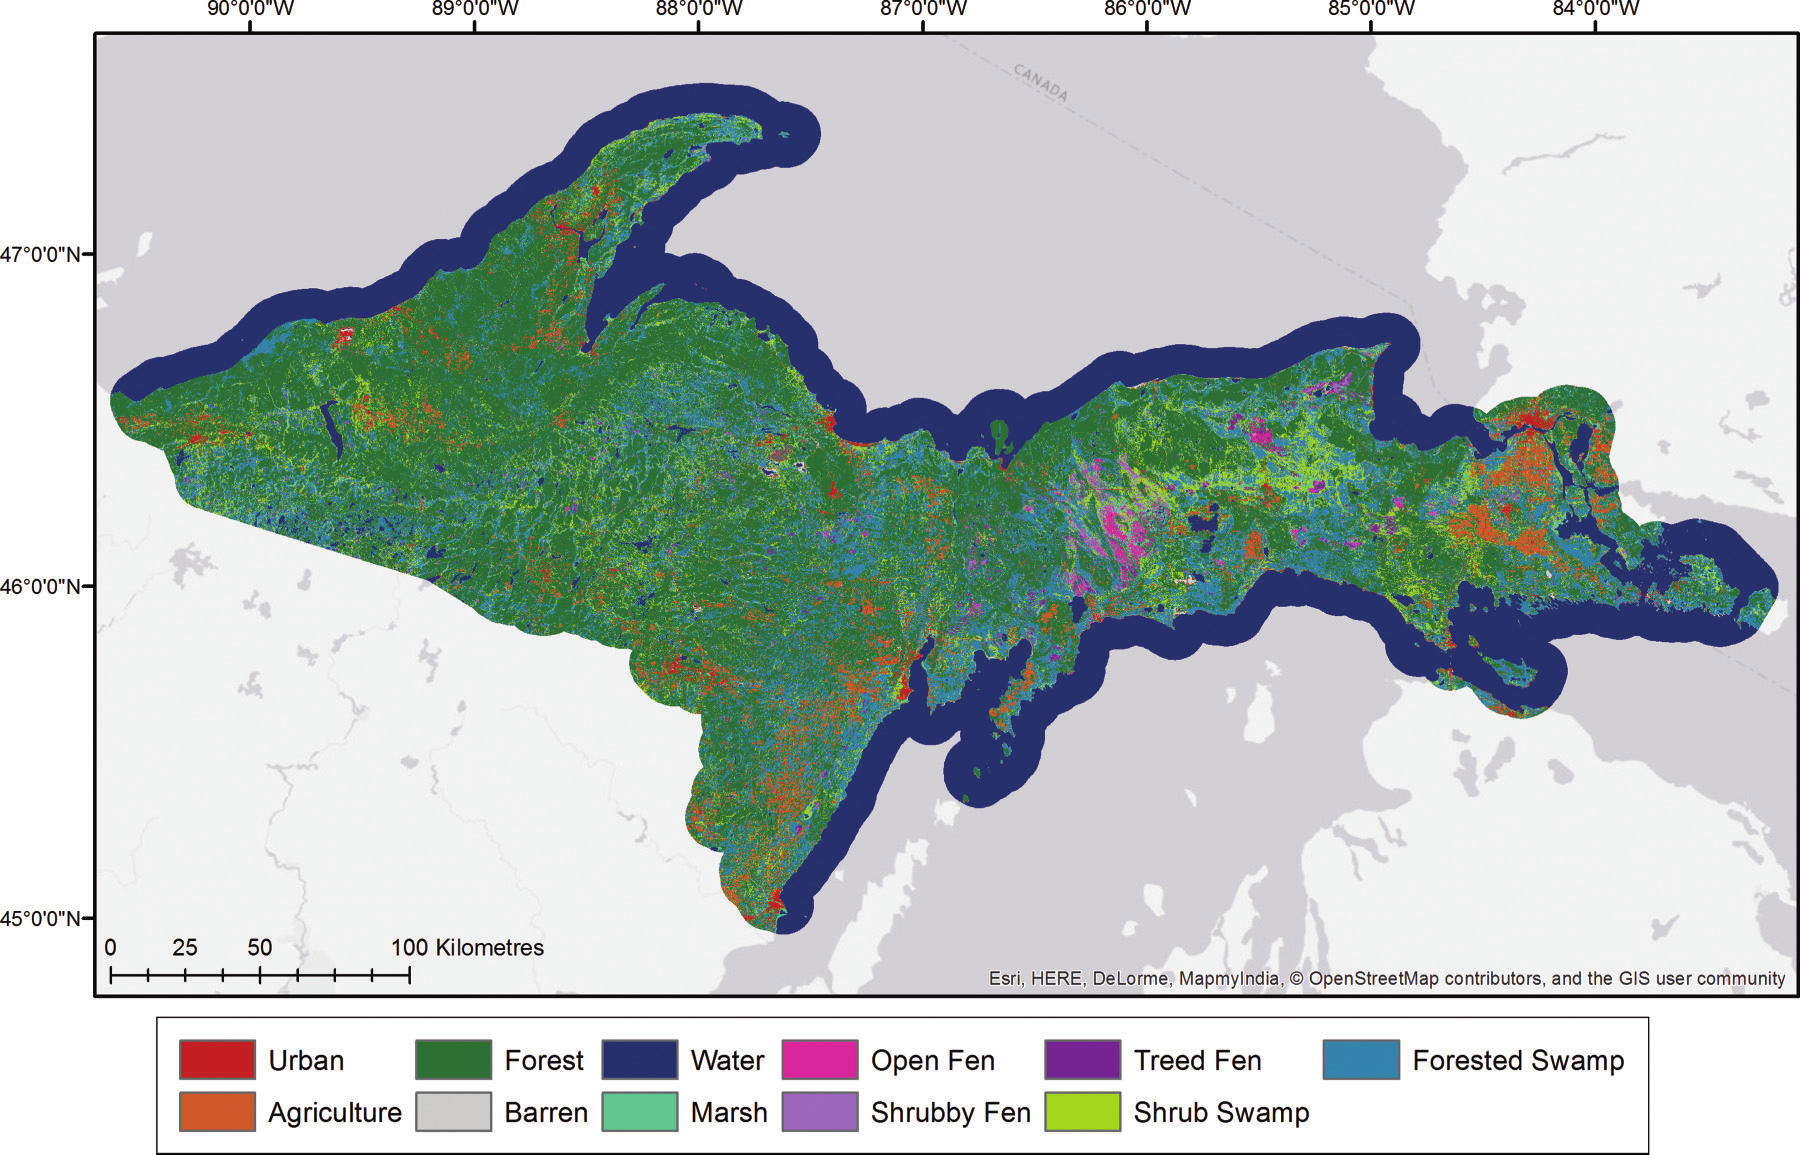
Figure 1. Peatland type map for the upper peninsula of Michigan (from Bourgeau-Chavez et al. 2017).
Citation
Bourgeau-Chavez, L.L., S. Endres, M. Battaglia, and E. Banda. 2017. NACP Peatland Land Cover Map of Upper Peninsula, Michigan, 2007-2011. ORNL DAAC, Oak Ridge, Tennessee, USA. https://doi.org/10.3334/ORNLDAAC/1513
Table of Contents
- Data Set Overview
- Data Characteristics
- Application and Derivation
- Quality Assessment
- Data Acquisition, Materials, and Methods
- Data Access
- References
Data Set Overview
This dataset provides a land cover map focused on peatland ecosystems in the upper peninsula of Michigan. The map was produced at 12.5-m resolution using a multi-sensor fusion (optical and L-band SAR) approach with imagery from Landsat-5 TM and ALOS PALSAR collected between 2007 and 2011. A random forest classifier trained with polygons delineated from field data and aerial photography was used to determine pixel classes. Accuracy assessment based on field-sampled sites show high overall map accuracy (92%).
Peatlands represent a diversity of ecosystem types that vary considerably in vegetation structure, hydrology, composition, and peat depth. This type of mapping effort provides the spatially explicit information needed to allow for monitoring and assessment of these important carbon-rich ecosystems.
Project: North American Carbon Program (NACP)
The North American Carbon Program (NACP) is a multidisciplinary research program to obtain scientific understanding of North America's carbon sources and sinks and of changes in carbon stocks needed to meet societal concerns and to provide tools for decision makers. The NACP is supported by a number of different federal agencies. The central objective is to measure and understand the sources and sinks of Carbon Dioxide (CO2), Methane (CH4), and Carbon Monoxide (CO) in North America and in adjacent ocean regions.
Related Datasets:
Bourgeau-Chavez, L.L., S. Endres, E. Banda, R. Powell, M.R. Turetsky, B. Benscoter, and E.S Kasischke. 2015. NACP Peatland Landcover Type and Wildfire Burn Severity Maps, Alberta, Canada. ORNL DAAC Oak Ridge, Tennessee, USA. http://dx.doi.org/10.3334/ORNLDAAC/1283
Bourgeau-Chavez, L.L., N.H.F. French, S. Endres, L. Jenkins, M. Battaglia, E. Serocki, and M. Billmire. 2016. ABoVE: Burn Severity, Fire Progression, Landcover and Field Data, NWT, Canada, 2014. ORNL DAAC, Oak Ridge, Tennessee, USA. http://dx.doi.org/10.3334/ORNLDAAC/1307
Related Publication:
Bourgeau-Chavez, L.L., S. Endres, R. Powell, M.J. Battaglia, B. Benscoter, M. Turetsky, E.S. Kasischke, and E. Banda. 2017. Mapping boreal peatland ecosystem types from multitemporal radar and optical satellite imagery. Can. J. For. Res. 47:545-559. https://dx.doi.org/10.1139/cjfr-2016-0192
Acknowledgements:
This study was funded by NASA North American Carbon Program (Grant number: NNX14AF96G).
Data Characteristics
Spatial Coverage: Upper Peninsula, Michigan
Spatial Resolution: 12.5 m
Temporal Coverage: 20070301 - 20111001
Temporal Resolution: The map represents a one-time observation
Study Area (These coordinates are the approximate locations of the study sites and may not match the extents of the data files. All latitude and longitude given in decimal degrees.)
|
Site |
Westernmost Longitude |
Easternmost Longitude |
Northernmost Latitude |
Southernmost Latitude |
|---|---|---|---|---|
|
Upper Peninsula, Michigan |
-91.085 |
-82.288 |
48.746 |
44.542 |
Data File Information
There is one peatland land cover map (peatland_landcover_michigan_up.tif) in GeoTIFF format included in this dataset one shapefile (compressed in landsat_palsar_scenes_dates.zip).
Spatial reference information and additional information for the GeoTIFF file are provided below. The peatland land cover classes and descriptions are listed in Table 1. An error matrix (Figure 2) giving the classification accuracy for the land cover map is included as a companion file in PDF format (peatland_landcover_michigan_up_error.pdf).
Spatial Reference Properties
WGS_1984_UTM_zone_17N
WKID: 32617 Authority: EPSG
Projection: Transverse_Mercator
false_easting: 500000.0
false_northing: 0.0
central_meridian: -81.0
scale_factor: 0.9996
latitude_of_origin: 0.0
Linear Unit: Meter (1.0)
Geographic Coordinate System: GCS_WGS_1984
Angular Unit: Degree (0.0174532925199433)
Prime Meridian: Greenwich (0.0)
Datum: D_WGS_1984
Spheroid: WGS_1984
Semimajor Axis: 6378137.0
Semiminor Axis: 6356752.314245179
Inverse Flattening: 298.257223563
Spatial Data Properties
Spatial Representation Type: Raster
Pixel Depth: 8 bit
Pixel Type: signed integer
Compression Type: LZW
Number of Bands: 1
Raster Format: TIFF
No Data Value: 127
Scale Factor: 1
Table 1. Land cover classes and descriptions for peatland_landcover_michigan_up.tif. Peatland land cover types in bold.
|
Value |
Class |
Description |
|---|---|---|
|
1 |
Urban |
Residential areas, cities, towns |
|
2 |
Suburban |
Primarily residential areas where man-made structure (i.e. buildings, farm equipment) are present; with more than or equal 25% vegetation (trees, shrubs, grass) are interspersed. |
|
3 |
Urban grass |
Lawns, golf courses, athletic fields, urban parks and mowed transitional zones such as medians or airfields. |
|
4 |
Urban road |
Linear transportation routes, large driveways, and parking areas. Transportation routes can include highways, small two lane roads, rail road beds, airfield landing areas, round-a-bouts, parking lots, and off and on ramps. |
|
5 |
Agriculture |
Hay fields and croplands where row crops such as corn, beans, and grains are in production. Land used for production of food or fiber; land use distinguishes agriculture land from similar natural ecosystem types (i.e. wetlands and rice patties). |
|
6 |
Fallow field |
Agriculture fields not in row crop production, such as areas of native grasses or meadows and pastures. |
|
7 |
Orchard |
Orchards, vineyards, and ornamental plants/trees. |
|
8 |
Forest |
Broad leaf and needle leaf deciduous and evergreen trees and dead forests. Characterized by woody vegetation with a height > 6m. Crown closure percentage (i.e. aerial view) > 75%. |
|
9 |
Pine plantation |
Needle leaved deciduous and evergreen trees with distinct row structure and typically planted in defined geometric plot. Crown closure percentage (i.e. aerial view) > 75%. |
|
10 |
Shrub |
True shrubs, immature trees, or stunted growth trees/shrubs. Characterized by woody vegetation with a height < 6m. May represent a successional stage growth that has not yet matured to forest, or stable communities of shrubs and stunted growth trees. Crown closure percentage (i.e. aerial view) > 50%. |
|
11 |
Barren light |
Salt flats, beaches, sandy areas, bare rock, strip mines, quarries, gravel pits and transitional area (on gray scale > 50% white). Land with limited ability to support life. Contains less than 33% vegetative cover. May include thinly dispersed scrubby vegetation. |
|
12 |
Barren dark |
Salt flats, beaches, sandy areas, bare rock, strip mines, quarries, gravel pits and transitional area (on gray scale ≥ 50% black). Land with limited ability to support life. Contains less than 33% vegetative cover. May include thinly dispersed scrubby vegetation. |
|
13 |
Water |
Streams, canals, rivers, lakes, estuaries, reservoirs, impoundments, and bays. Areas persistently inundated in water that do not typically show annual drying out or vegetation growth at or above the water’s surface. Where depth of water column is > 2m, such that light attenuation increases significantly and surface and subsurface aquatic vegetation persistence declines or is less detectable. |
|
14 |
Aquatic bed |
Algal beds, aquatic mosses, rooted vascular plants (e.g. eel grasses and sea grasses, pond weeds, lily pads, milfoil) and floating vascular plants (e.g. lemna, water hyacinth, coontails, and bladderwarts). Inundated wetlands or water < 2m (excluding deep water zones) habitats dominated by plants that grow principally on or just below the water’s surface. |
|
15 |
Emergent wetland |
Emergent wetland and wet meadow vegetation not represented by other classes. These are areas where the water table is at or near the earth’s surface. Seasonal inundation and or drying are common phenomenon. Vegetative species distributions are strong indicators of wetland condition. Does not include cultivated wetlands, such as rice paddy or cranberry farms. |
|
16 |
Schoenoplectus |
Dominate species is Schoenoplectus spp. and crown closure percentage (i.e. aerial view) > 50%. |
|
17 |
Typha |
Dominate species is Typha spp. and crown closure percentage (i.e. aerial view) > 50%. |
|
18 |
Phragmites |
Dominate species is Phragmites australis and crown closure percentage (i.e. aerial view) > 50%. |
|
20 |
Open fen |
Brown and graminoid moss dominated with > 30cm peat. Connected ground and surface water flow; minerotrophic. Crown closure percentage (i.e. aerial view) > 75%. |
|
21 |
Shrub fen |
Brown and graminoid moss dominated with > 30cm peat. Connected ground and surface water flow; minerotrophic. May represent a successional stage growth that has not yet matured to forest, or stable communities of shrubs and stunted growth trees. Crown closure percentage (i.e. aerial view) > 50%. |
|
22 |
Treed fen |
Brown and graminoid moss dominated with > 30cm peat. Connected ground and surface water flow; minerotrophic. Characterized by woody vegetation with a height > 2m. May represent a successional stage growth that has not yet matured to forest, or stable communities of shrubs and stunted growth trees. Crown closure percentage (i.e. aerial view) > 75%. |
|
23 |
Shrub wetland |
Wetlands dominated by shrubs < 6m in height. Crown closure percentage (i.e. aerial view) > 50%. |
|
24 |
Forested wetland |
Wetlands dominated by woody vegetation (dead or alive) > 6m in height. Includes seasonally flooded forests. Crown closure percentage (i.e. aerial view) > 50%. |
Shapefile
A shapefile (landsat_palsar_scenes_dates.shp) listing the Landsat and PALSAR scenes used to produce the land cover map is also included (compressed in landsat_palsar_scenes_dates.zip). Shapefile attribute names and descriptions are listed in Table 2.
Table 2. Shapefile attribute names and descriptions for landsat_palsar_scenes_dates.shp
|
Attribute Name |
Description |
|---|---|
|
FID |
Shapefile feature ID |
|
Shape |
Shapefile feature type |
|
AOI_NAME |
Area of interest name |
|
Spring_PAL |
PALSAR image name for spring |
|
Spring_P_1 |
PALSAR spring image date |
|
Summer_PAL |
PALSAR image name for summer |
|
Summer_P_1 |
PALSAR summer image date |
|
Fall_PALSA |
PALSAR image name for fall |
|
Fall_PAL_1 |
PALSAR fall image date |
|
Landsat_Pa |
Landsat scene path and row numbers * |
|
Landsat_Su |
Landsat summer image date(s) |
|
Landsat_F |
Landsat fall image date(s) |
|
Landsat_S |
Landsat spring image date(s) |
* Landsat imagery path and row numbers refer to the Worldwide Reference System (WRS; https://landsat.gsfc.nasa.gov/the-worldwide-reference-system/ )
Application and Derivation
This dataset is the product of a multi-sensor, multi-season remote sensing approach to delineate boreal peatland types (wooded bog, open fen, shrubby fen, treed fen). Climate change predictions estimate that the boreal and arctic regions will be the most strongly affected by projected rising temperatures and changes in precipitation patterns. The ability to distinguish and monitor various peatland types at the landscape scale has implications for inventory, conservation, carbon storage estimation, fuel loading, carbon emissions, hydrology, and monitoring ecological shifts in a changing climate.
Quality Assessment
Training polygons equal to approximately 20% of the total polygon area of each class were withheld from the classification and used for validation of the peatland type map. The accuracy assessment included producer’s accuracy, a measure of how accurately the analyst classified the image data (errors of omission = 100 – producer’s accuracy), and user’s accuracy, a measure of accuracy of the classification performed in the field (errors of commission = 100 – user’s accuracy).
The error matrix in Figure 2 (Bourgeau-Chavez et al. 2017) indicates an overall map accuracy of 94%. Similar classes were combined for readability; e.g. "barren light" and "barren dark" classes were combined into the "barren" class. The complete error matrix including all land cover classes indicates an overall map accuracy of 92% and is provided as a companion file (peatland_landcover_michigan_up_error.pdf).
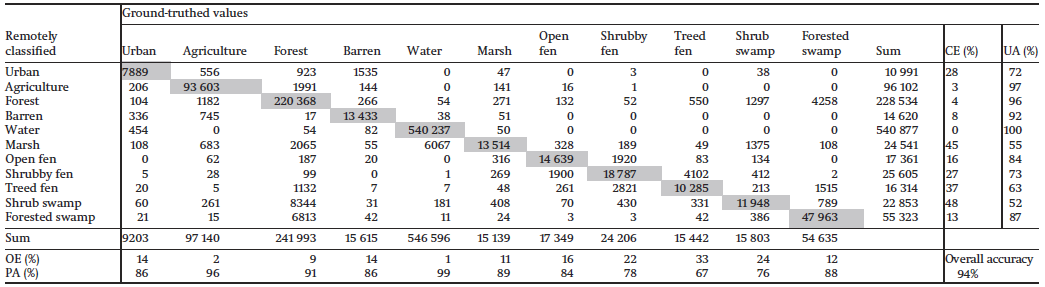
Figure 2. Peatland land cover map error matrix; numbers represent pixel counts (Bourgeau-Chavez et al. 2017).
Data Acquisition, Materials, and Methods
Land cover was classified for the upper peninsula (UP) of Michigan using a multi-sensor fusion (optical and L-band SAR) approach. A random forest (RF) classifier was used to generate a group of independent classification trees and pixel classes were determined by a majority vote of the trees. Training data were produced using field data and aerial photo interpretation.
Field characterization was performed for training and validation of the random forest classifier. Field data were collected at the minimum mapping unit (0.2 ha) at sites in each of the study areas. Aerial imagery was used to narrow the field locations to areas that appeared to be potential wetland sites. Wetland ecosystem type was determined using the field classification key depicted in Figure 3.
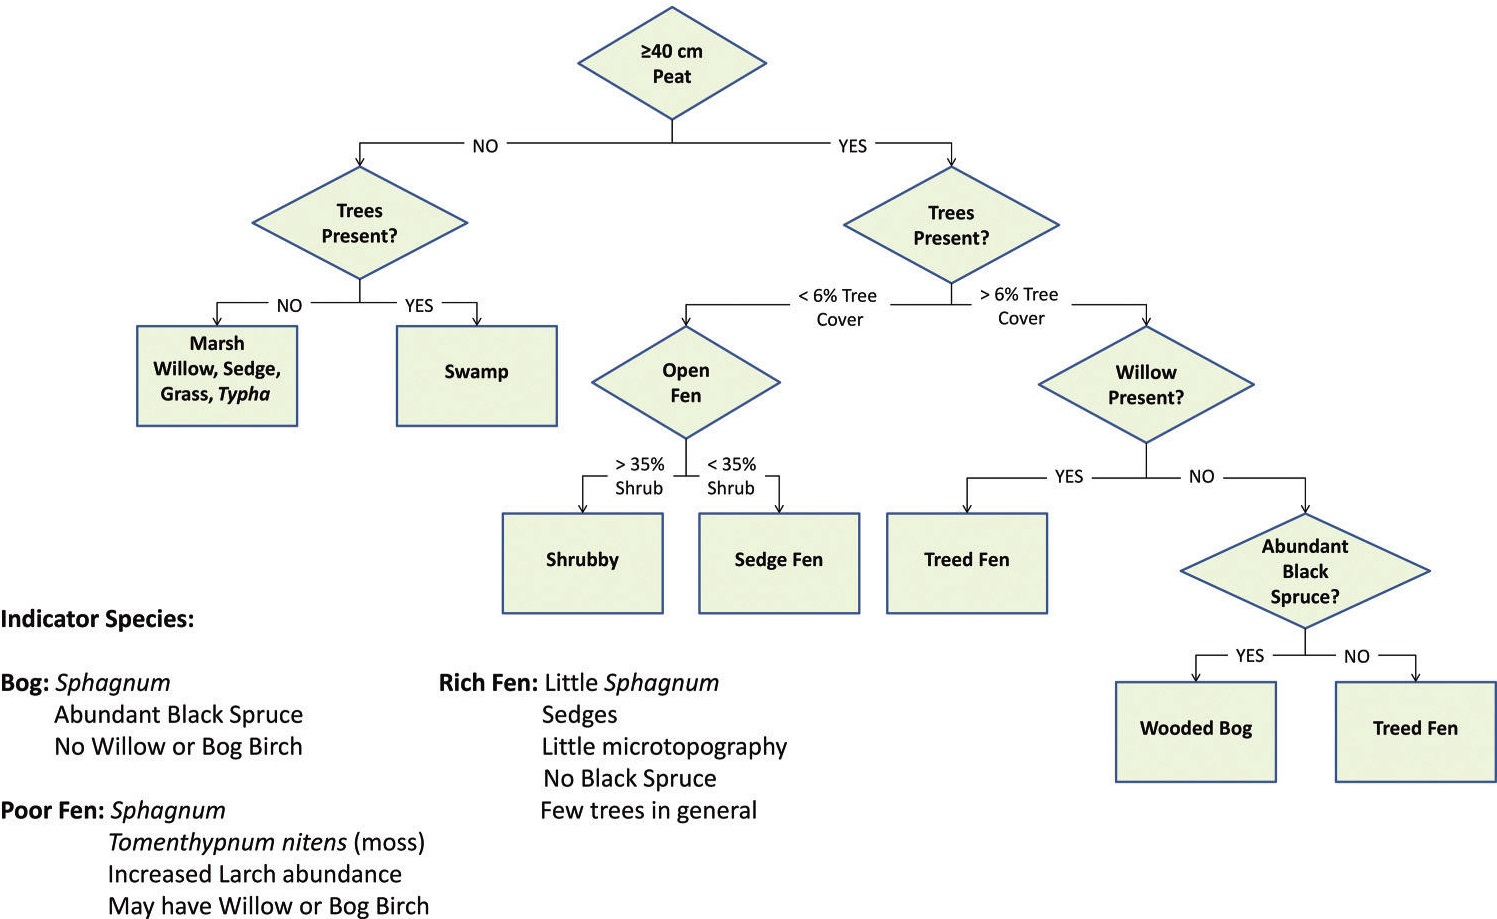
Figure 3. Field guide developed for use in distinguishing peatland and non-peatland wetland types based on species presence or absence, depth of peat, etc. (from Bourgeau-Chavez et al. 2017)
Datasets for multiple dates from Landsat-5 Thematic Mapper (USGS) and ALOS PALSAR (Advanced Land Observing Satellite; Phased Array type L-band Synthetic Aperture Radar; JAXA; Alaska Satellite Facility) were acquired for classification. Landsat data were converted from radiance to top-of-atmosphere reflectance (Chandler et al. 2009). SAR calibration to backscatter coefficient, terrain correction, and geolocation were applied using the Alaska Satellite Facility’s MapReady software program. A second-order polynomial was used to geocorrect all SAR data to within 1 pixel of the reference Landsat data. All data were resampled to 12.5-m resolution and stacked into a single file containing each band from each image date.
Classification was performed using a RF classifier. The satellite data from Landsat and PALSAR were merged to create a map of the 4.24-million-hectare peninsula. Training and validation polygons were interpreted by an image analyst using field data and aerial photos from the National Agriculture Imagery Program. The amount of training data per class was proportional to the area of that class for each region. The algorithm was set to generate 500 decision trees for each classification run. The number of variables used to split each node was approximately equal to the square root of the total number of variables in that scene. A diagram of the classification workflow is depicted in Figure 4. The map produced using the RF classifier was compared to a similar map resulting from object-based image classification and determined to have the higher overall accuracy (Bourgeau-Chavez et al. 2017).
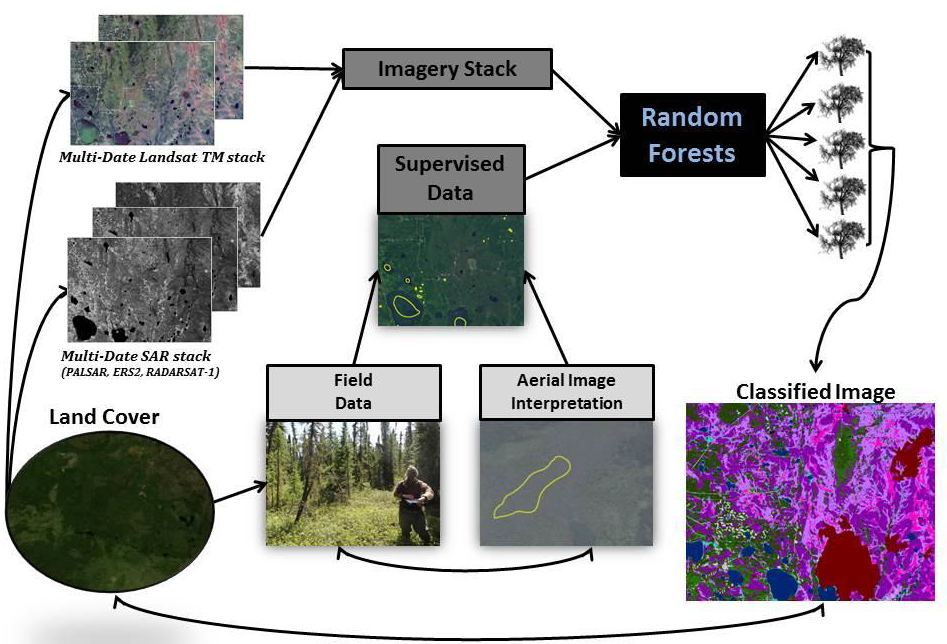
Figure 4. Classification schematic showing the mapping methodology using field data, aerial photography, and satellite imagery (from Bourgeau-Chavez 2015).
Data Access
These data are available through the Oak Ridge National Laboratory (ORNL) Distributed Active Archive Center (DAAC).
NACP Peatland Land Cover Map of Upper Peninsula, Michigan, 2007-2011
Contact for Data Center Access Information:
- E-mail: uso@daac.ornl.gov
- Telephone: +1 (865) 241-3952
References
Bourgeau-Chavez, L.L., N.H.F. French, E.S. Kasischke, M.R. Turetsky, L.K. Jenkins, S. Endres, E. Banda, M. Billmire, and B. de Groot. 2015. Vulnerability of North American Boreal Peatlands to Interactions between Climate, Hydrology, and Wildfires. Poster presented at NACP Principle Investigators Meeting 5, Jan 26-29, 2015.
Bourgeau-Chavez, L.L., S. Endres, R. Powell, M.J. Battaglia, B. Benscoter, M. Turetsky, E.S. Kasischke, and E. Banda. 2017. Mapping boreal peatland ecosystem types from multitemporal radar and optical satellite imagery. Can. J. For. Res. 47:545-559. https://dx.doi.org/10.1139/cjfr-2016-0192
Chandler, G., B.L. Markham, and D.L. Helder. 2009. Summary of current radiometric calibration coefficients for Landsat MSS, TM, ETM+, and EO-1 ALI sensors. Remote Sens. Environ. 113: 893-903 https://dx.doi.org/10.1016/j.rse.2009.01.007