Summary:
This data set provides modeled carbon flux estimates at 8-km spatial resolution over North America for the year 2004 of (1) net ecosystem exchange (NEE) of carbon dioxide (CO2), (2) net ecosystem production (NEP, the balance of net primary production and heterotrophic respiration), (3) stream evasion (CO2 emitted from streams and rivers), (4) emissions from harvested forest and agricultural products, and (5) emissions from biomass burning.
Annual estimates, in gC/m2/year, are provided for all five fluxes. Daily estimates, in gC/m2/day, are provided for NEP and stream evasion fluxes. Fluxes for fire emissions, harvest decomposition/respiration, stream evasion, and NEP were derived as described in Section 5.
NEE fluxes were estimated using a full bottom-up accounting of NEE produced by integrating emissions from harvested forest and agricultural products, CO2 emitted from streams and rivers, and biomass burning in the CarbonTracker (version 2011_oi) modeling system. NEE estimates were run in the forward mode through the CarbonTracker inversion setup that calculates CO2 uptake and release at the Earth's surface over time. Refer to Turner et al.(2013) for details.
There are seven data files in NetCDF (.nc) format with this data set, including: five annual files for fire emissions, harvest decomposition/respiration, stream evasion, NEP, and NEE fluxes; and two daily files for NEP and stream evasion fluxes.
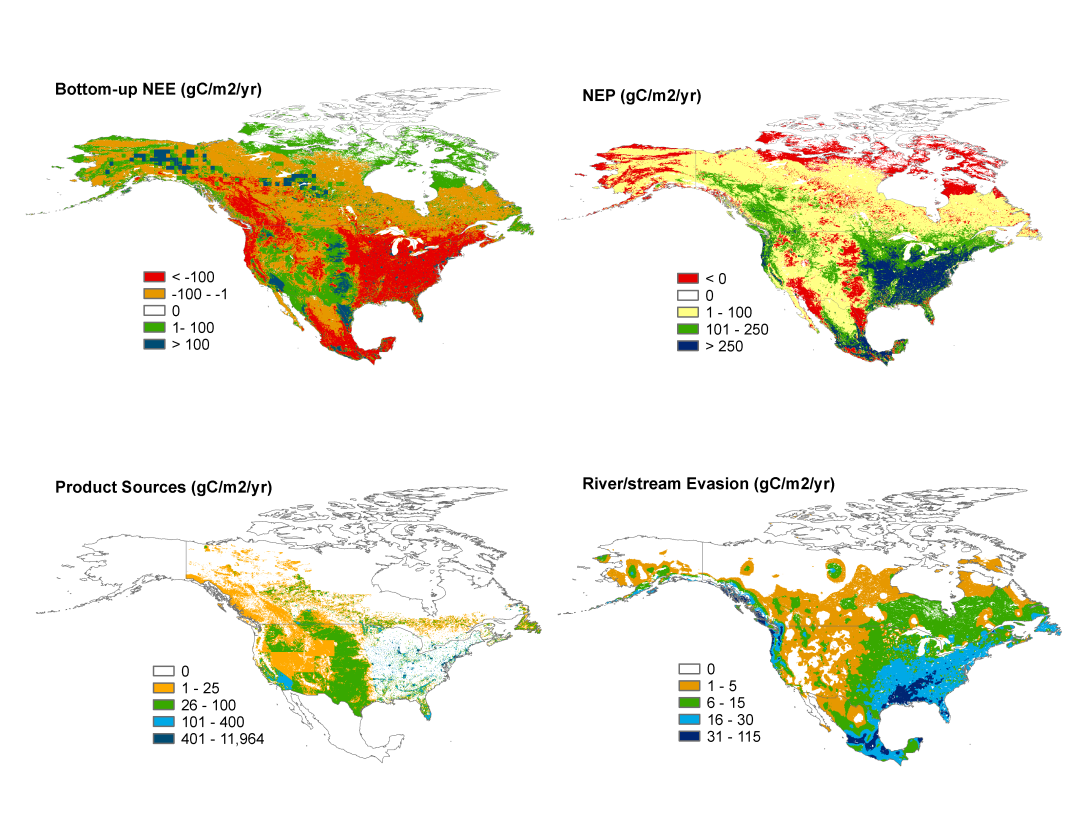
Figure 1. Images of annual flux data for 1) net ecosystem exchange (NEE) of carbon dioxide (CO2), (2) net ecosystem production (NEP, the balance of net primary production and heterotrophic respiration), (3) emissions from harvested forest and agricultural products, and (4) stream evasion (CO2 emitted from streams and rivers). By convention, a negative NEE flux indicates a transfer into the ecosystem. Conversely, a negative NEP flux indicates a transfer into the atmosphere.
Data Citation:
Cite this data set as follows:
Turner, D.P., D. Ritts, A.R. Jacobson, W. Wang, and R. Nemani. 2014. NACP North American 8-km Net Ecosystem Exchange and Component Fluxes, 2004. Data set. Available on-line[http://daac.ornl.gov] from Oak Ridge National Laboratory Distributed Active Archive Center, Oak Ridge, Tennessee, USA.http://dx.doi.org/10.3334/ORNLDAAC/1203
More information can be found at: http://nacp.forestry.oregonstate.edu/
Table of Contents:
- 1 Data Set Overview
- 2 Data Description
- 3 Applications and Derivation
- 4 Quality Assessment
- 5 Acquisition Materials and Methods
- 6 Data Access
- 7 References
1. Data Set Overview:
Project: North American Carbon Program (NACP)
The investigators were Turner, David T; Ritts, David; Jacobson, Andrew; Wang, Weile, and Nemani, Ramakrishna.
The NACP (Denning et al., 2005; Wofsy and Harriss, 2002) is a multidisciplinary research program to obtain scientific understanding of North America's carbon sources and sinks and of changes in carbon stocks needed to meet societal concerns and to provide tools for decision makers. Successful execution of the NACP has required an unprecedented level of coordination among observational, experimental, and modeling efforts regarding terrestrial, oceanic, atmospheric, and human components. The project has relied upon a rich and diverse array of existing observational networks, monitoring sites, and experimental field studies in North America and its adjacent oceans. It is supported by a number of different federal agencies through a variety of intramural and extramural funding mechanisms and award instruments.
This data set provides modeled estimates for net ecosystem exchange (NEE) of carbon dioxide (CO2) and net ecosystem production (NEP) over North America for the year 2004, at the 8-km spatial resolution. Daily estimates of NEP (the balance of net primary production and heterotrophic respiration) using a full bottom-up accounting of NEE (net ecosystem exchange) with emissions from harvested forest and agricultural products, river/stream CO2 evasion, and biomass burning. Components of the emission data are available as annual gridded files.
Related Data Sets:
- Global Fire Emissions Database, Version 3 (GFEDv3.1), provides the daily fire emissions from biomass burning used in this modeling activity.
- NACP Regional: National Greenhouse Gas Inventories and Aggregated Gridded Model Data, contains the harvested products emission data used in this modeling activity.
2. Data Characteristics:
There are seven data files in NetCDF (.nc) format with this data set which includes five annual files for fire emissions, harvest decomposition/respiration, stream evasion, NEP, and NEE, one daily file of NEP data, and one daily file for daily stream evasion. The *.nc files have been compressed with gzip.
NEE:
na_annual8k_nee_2004.nc.gz: Annual net ecosystem exchange for North America. CarbonTracker Model output file in 8-km resolution for 2004 annual summary.
NEP:
na_annual8k_nep_2004.nc.gz: Annual net ecosystem Production for North America. Annual summary from the CFLUX Model output file in 8-km resolution for 2004.
na_daily8k_NEP2004.nc.gz: Daily net ecosystem production for North America. Daily output files from the CFLUX model.
Stream Evasion:
na_annual8k_stream_evasion_2004.nc.gz: Annual river/stream evasion for North America. Annual summary from the input files to the CarbonTracker model. This file provides annual river/stream evasion in 8-km resolution.
na_daily8k_stream_evasion2004.nc.gz: Daily river/stream evasion for North America.
Fire Emissions:
na_annual8k_fire_emissions_2004.nc.gz: Annual fire emissions for North America. Annual summary from the input files to the CarbonTracker model.
Harvested Product Emissions:
na_annual8k_harvested_product_2004.nc.gz: Annual harvested product sources for North America. This is an annual summary of the input files to the CarbonTracker model. This file provides annual 8-km emissions from harvested forests and crops.
Units: Annual data are in gC/m2/year. Daily data are in gC/m2/day.
Flux Conventions:
NEE: A positive sign on an NEE flux estimate is a transfer of carbon into the atmosphere and a negative sign is the transfer of carbon into the ecosystem.
NEP: A positive sign indicates transfer of carbon into the ecosystem and a negative sign is a transfer of carbon into the atmosphere
Stream evasion, fire emissions, and harvested product emissions: All positive signs indicating transfer of carbon into the atmosphere.
Spatial Data Properties - All Files
Spatial Representation Type: Raster
Pixel Depth: 32
bit
Compression Type: none
Number of Bands: 1 (annual files); 365 (daily
files)
Band Information: modeled data
Data Format: netCDF
Source
Type: continuous
Pixel Type: floating point
No Data Value: -9999.0
Number Columns: 2000
Column Resolution: 0.07272 degrees
Number Rows: 1200
Row Resolution: 0.07272 degrees
Spatial extent in the item's coordinate system
North: 89.999
South:
2.736
West: -179.553
East: -34.106
Spatial Reference Properties - All Files
Type: Geographic
Geographic Coordinate Reference:
GCS_WGS_1984
Datum: WGS_1984
Open Geospatial Consortium (OGC) Well Known Text (WKT) Format
GEOGCS["WGS 84",
DATUM["WGS_1984",
SPHEROID["WGS
84",6378137,298.257223563,
AUTHORITY["EPSG","7030"]],
AUTHORITY["EPSG","6326"]]
PRIMEM["Greenwich",0,
AUTHORITY["EPSG","8901"]],
UNIT["degree",0.01745329251994328,
AUTHORITY["EPSG","9122"]],
AUTHORITY["EPSG","4326"]]
PROJ.4 Cartographic Projections Format
+proj=longlat +ellps=WGS84 +datum=WGS84 +no_defs
Site boundaries: (All latitude and longitude given in decimal degrees)
| Site (Region) | Westernmost Longitude | Easternmost Longitude | Northernmost Latitude | Southernmost Latitude |
|---|---|---|---|---|
| Continental North America | -179.553 | -34.113 | 90 | 2.736 |
Time period:
- The data set covers the period 2004/01/01 to 2004/12/31
Platform/Sensor/Parameters measured include:
- COMPUTER MODEL / ANALYSIS / EMISSIONS
- COMPUTER MODEL / ANALYSIS / CARBON DIOXIDE
- COMPUTER MODEL / ANALYSIS / BIOMASS BURNING
- COMPUTER MODEL / ANALYSIS / PRIMARY PRODUCTION
3. Data Application and Derivation:
These data can be compared to similar values from other years and other scaling approaches to estimate the sensitivity of NEE to climate and disturbance events. The harvested products source, river stream evasion source, and fire emissions source could be used with other NEP estimates to develop alternative NEE estimates.
4. Quality Assessment:
Uncertainty Overview
Uncertainty of input data and modeled flux outputs are discussed in detail in Tuner et al 2013.
NEE:
We approximated uncertainty at 5 TgC per yr based on independent bottom-up and top-down analyses (Kopacz et al., 2010; Hayes et al., 2011) The total bottom-up NEE estimate for NA in 2004 was 1115 TgC per yr, with an estimation range from 899 to 1364 TgC per yr based on the component flux uncertainties.
NEP:
Uncertainty in the annual total NEP associated with the model and its parameters is estimated at 370 TgC per yr.
Additional uncertainty not quantified here is associated with representativeness of the EC tower optimization sites (King et al., 2011), EC tower flux measurements themselves (Moffat et al., 2007), the meteorological driving data (Wang et al., 2010), and the FPAR driving data (Turner et al., 2005).
Harvested Product Emissions:
Uncertainty on the estimate for harvested product emissions for NA is on the order of 80 TgC per yr (Hayes et al., 2012).
Stream Evasion:
The total river/stream evasion source for 2004 was 158 TgC per yr, with an uncertainty estimate on the order of 49 TgC per yr based on the uncertainty analysis of Butman and Raymond (2011).
Fire Emissions:
Total fire emissions in 2004 were estimated at 142 TgC per yr.
5. Data Acquisition Materials and Methods:
Methods Overview
This was a full, bottom-up accounting of NEE. Daily fluxes were assembled for each of the four NEE input components: 1) NEP, 2) emissions from decomposition/respiration of harvested forest and agricultural products, 3) CO2 evasion from streams and rivers, and 4) biomass burning. Daily NEP simulations were derived using the CFLUX diagnostic carbon cycle model (refer to Turner et al. (2006) for more information on CFLUX). Emissions for the other three sources were from measured and modeled data. Fluxes were determined for each of the sources.
This NEE estimate was run in the forward mode through the CarbonTracker inversion setup using the TM5 atmospheric transport model. The CarbonTracker system tracks CO2 sources and sinks from various data sources including measured and modeled data. When run in a forward mode simulation, atmospheric CO2 distributions resulting from modeled fluxes are compared with measured atmospheric CO2 concentrations. In this study CarbonTracker version 2011_oi and the TM5 model were used in the forward mode inversion to predict CO2 concentrations for comparison with observations.
Model Input Data/Four NEE Components
Four sources of input data for use in the CarbonTracker simulation:
1) NEP: NEP data were simulated from the CFLUX carbon cycle model. The model algorithms and evaluation are described in detail elsewhere (Turner et al., 2006, 2009; King et al., 2011). CFLUX inputs included:
- Daily meteorological inputs (photosynthetically active radiation (PAR), minimum temperature, maximum temperature, leaf-to-air vapor pressure deficit (VPD), and precipitation) from interpolated meteorological station data at the 8-km spatial resolution (Wang et al., 2010).
- Soil water holding capacity (WHC) prescribed by plant functional type (PFT) based on representative values at flux tower sites (King et al., 2011).
- PFT from the standard Collection 5 MODIS product (Friedl et al., 2010; LP DAAC, 2012) and climate zones from aggregations of the Omernik (1987) ecozones.
- Fraction of PAR (fPAR) derived from the Collection 5 MODIS product (Myneni et al., 2002; LP DAAC, 2012) with gap filling using the algorithm of Zhao et al. (2005).
- Forest stand age from the 1-km resolution product of Pan et al. (2011). That product included only Canada and the US, so approximations (50 to 100 years) were made for the various forest types in Mexico.
- Combinations of PFT (n = 7) and climate zones (n = 3) that included a substantial area. Observations of gross ecosystem exchange GEE (GPP) and NEE from one or more EC flux tower sites having the same PFT and climate zone were obtained from AmeriFlux (2013) or directly from the tower operator (Turner et al., 2013).
2) Fire emissions: Daily emissions from biomass burning were from Van der Werf et al. (2006). Fire extent in that study was from the MODIS Active Fire and MODIS Burned area products. Fuel loads were from the CASA ecosystem process model run in a spatially distributed mode, and emission factors (proportion of fuel burned) were from the literature. The fire emissions database (CASA-GFED3) is the same as is used in the standard CarbonTracker inversion (CT2011, 2011). The Global Fire Emissions Database, Version 3 (GFEDv3.1) (Randerson et al. 2013) is now available from the ORNL DAAC.
3) River/stream evasion: Data from Butman and Raymond (2011) estimated river/stream evasion over North America based on measurements of temperature, alkalinity, and pH along with high resolution data on morphology and surface area of waterways. Aggregation of their data to the regional scale resulted in a strong linear relationship of annual precipitation to annual river/stream evasion. That linear relationship and our annual precipitation (8-km resolution) was used to map annual evasion emissions. To partition the annual data to the daily time step, all days with soil temperature less than or equal to 0 degrees C were flagged. The annual total was then partitioned among the remaining days based on the Butman and Raymond (2011) daily precipitation.
4) Harvested products: Data were from Hayes et al. (2012), estimated annual emissions from harvested wood products and crops. These fluxes were spatially resolved to the level of political units such as states or provinces. For our daily flux at 1 km, the polygon maps based on data from Hayes et al. (2012) were resampled to 1-km resolution and linearly interpolated over the course of the year. Product emissions data were not available for Mexico. The harvested products emission data used in Hayes et al. (2012) for geopolitical areas are now available from the ORNL DAAC in Wei et al. (2013).
Daily Fluxes
Daily fluxes for 2004 were assembled for each of the four NEE components described above. These data were spatially aggregated to the 1-degree resolution of CarbonTracker, and subsequently temporally disaggregated to its 3-hourly time step. The fluxes were then run in the forward mode through CarbonTracker, with fossil fuel emissions and CO2 boundary conditions for North America provided by the standard CarbonTracker setup. The residuals between observed and simulated CO2 concentration (mixing ratio) at eight observation sites in North America were used to evaluate the bottom-up NEE simulations.
Data Access:
This data set is available through the Oak Ridge National Laboratory (ORNL) Distributed Active Archive Center (DAAC).
Data Archive:
Web Site: http://daac.ornl.gov/
Contact for Data Center Access Information:
E-mail: uso@daac.ornl.gov
Telephone: +1 (865)
241-3952
7. References:
AmeriFlux (2013) Available at: http://ameriflux.lbl.gov (Accessed 25 March 2013).
Butman. D., and P.A. Raymond (2011). Significant efflux of carbon dioxide from streams and rivers in the United States. Nature Geoscience, 4, 839-842.
CT2011 (2011) CarbonTracker. Version 2011_oi. Available at: http://www.esrl.noaa.gov/gmd/ccgg/carbontracker (Accessed 25 March 2013).
Denning, A.S., et al. 2005. Science implementation strategy for the North American Carbon Program: A Report of the NACP Implementation Strategy Group of the U.S. Carbon Cycle Interagency Working Group. U.S. Carbon Cycle Science Program, Washington, DC. 68 pp.
Hayes, D.J., D.P. Turner, G. Stinson, T.O. West, Y. Wei, L.S. Heath, R.A. Birdsey, B. deJong, A.D. McGuire, W.A. Kurz, A.R. Jacobson, B.G. McConkey, D.N. Huntzinger, Y. Pan, W.M. Post, R.B. Cook (2012). Reconciling estimates of the contemporary North American carbon balance among terrestrial biosphere models, atmospheric inversions, and a new approach for estimating net ecosystem exchange from inventory-based data. Global Change Biology, 18, 1282-1299.
King, D.A., D.P.Turner, and W.D. Ritts (2011). Parameterization of a diagnostic carbon cycle model for continental scale application. Remote Sensing of Environment, 115, 1653-1664.
Kopacz, M., D.J. Jacob, J.A. Fisher et al. (2010). Global estimates of CO sources with high resolution by adjoint inversion of multiple satellite datasets (MOPITT, AIRS, SCIAMACHY, TES). Atmospheric Chemistry and Physics, 10, 855-876.
Lloyd, J., and J.A. Taylor (1994). On the temperature-dependence of soil respiration. Functional Ecology, 8, 315-323.
Moffat, A.M., D. Papale, and M. Reichstein et al. (2007). Comprehensive comparison of gapfilling techniques for eddy covariance net carbon fluxes. Agricultural and Forest Meteorology, 147, 209-232.
Moore, D.S., and G.P. McCabe (2006). Introduction to the Practice of Statistics (5th edn). W.H. Freeman and Company, New York Peters W, Jacobson AR, Sweeney C et al. (2007).
An atmospheric perspective on North American carbon dioxide exchange: CarbonTracker. Proceedings of the National Academy of Sciences of the United States of America, 104, 18925-18930.
Randerson, J. T., G. R. van der Werf, L. Giglio, G. J. Collatz, and P. S. Kasibhatla. 2013. Global Fire Emissions Database, Version 3 (GFEDv3.1). Data set. Available on-line [http://daac.ornl.gov/] from Oak Ridge National Laboratory Distributed Active Archive Center, Oak Ridge, Tennessee, USA. http://dx.doi.org/10.3334/ORNLDAAC/1191
Turner, D.P., A.J. Jacobson, A.J., W.D. Ritts, W.L. Wang, R. Nemani. 2013. A large proportion of North American net ecosystem production is offset by emissions from harvested products, river/stream evasion, and biomass burning. Global Change Biology, DOI: 10.1111/gcb.12312.
Turner, D.P., W.D. Ritts, W.B. Cohen et al. (2005). Site-level evaluation of satellite-based global terrestrial gross primary production and net primary production monitoring. Global Change Biology, 11, 666-684.
Turner, D.P., W.D. Ritts, J.M. Styles et al. (2006). A diagnostic carbon flux model to monitor the effects of disturbance and interannual variation in climate on regional NEP. TellusB, 58, 476-490.
Turner, D.P., W.D. Ritts., S. Wharton et al. (2009). Assessing FPAR source and parameter optimization scheme in application of a diagnostic carbon flux model. Remote Sensing of Environment, 113, 1529-1539.
Van Der Werf, G.R, J.T. Randerson, L. Giglio et al. (2006). Interannual variability in g lobal biomass burning emissions from 1997 to 2004. Atmospheric Chemistry and Physics, 6, 3423-3441.
Wang, W.L., J. Dungan, H. Hashimoto et al. (2010). Diagnosing and assessing uncertainties of terrestrial ecosystem models in a multimodel ensemble experiment: 1. Primary production. Global Change Biology, 17, 1350-1366.
Wei, Y., D.J. Hayes, M.M. Thornton, W.M. Post, R.B. Cook, P.E. Thornton, A. Jacobson, D.N. Huntzinger, T.O. West, L.S. Heath, B. McConkey, G. Stinson, W. Kurz, B. de Jong, I. Baker, J. Chen, F. Chevallier, F. Hoffman, A. Jain, R. Lokupitiya, D.A. McGuire, A. Michalak, G.G. Moisen, R.P. Neilson, P. Peylin, C. Potter, B. Poulter, D. Price, J. Randerson, C. Rodenbeck, H. Tian, E. Tomelleri, G. van der Werf, N. Viovy, J. Xiao, N. Zeng, and M. Zhao. 2013. NACP Regional: National Greenhouse Gas Inventories and Aggregated Gridded Model Data. Data set. Available on-line [http://daac.ornl.gov] from Oak Ridge National Laboratory Distributed Active Archive Center, Oak Ridge, Tennessee, USA. http://dx.doi.org/10.3334/ORNLDAAC/1179
Wofsy, S.C., and R.C. Harriss. 2002. The North American Carbon Program (NACP). Report of the NACP Committee of the U.S. Interagency Carbon Cycle Science Program. U.S. Global Change Research Program, Washington, DC. 56 pp.
Zhang, L., B.K. Wylie, L. Ji et al. (2011). Upscaling carbon fluxes over the Great Plains grasslands: sinks and sources. Journal of Geophysical Research-Biogeosciences, 116, G00J03.