Documentation Revision Date: 2020-11-10
Dataset Version: 1
Summary
There are 11 files in GeoTIFF (*.tif) format included with this dataset.
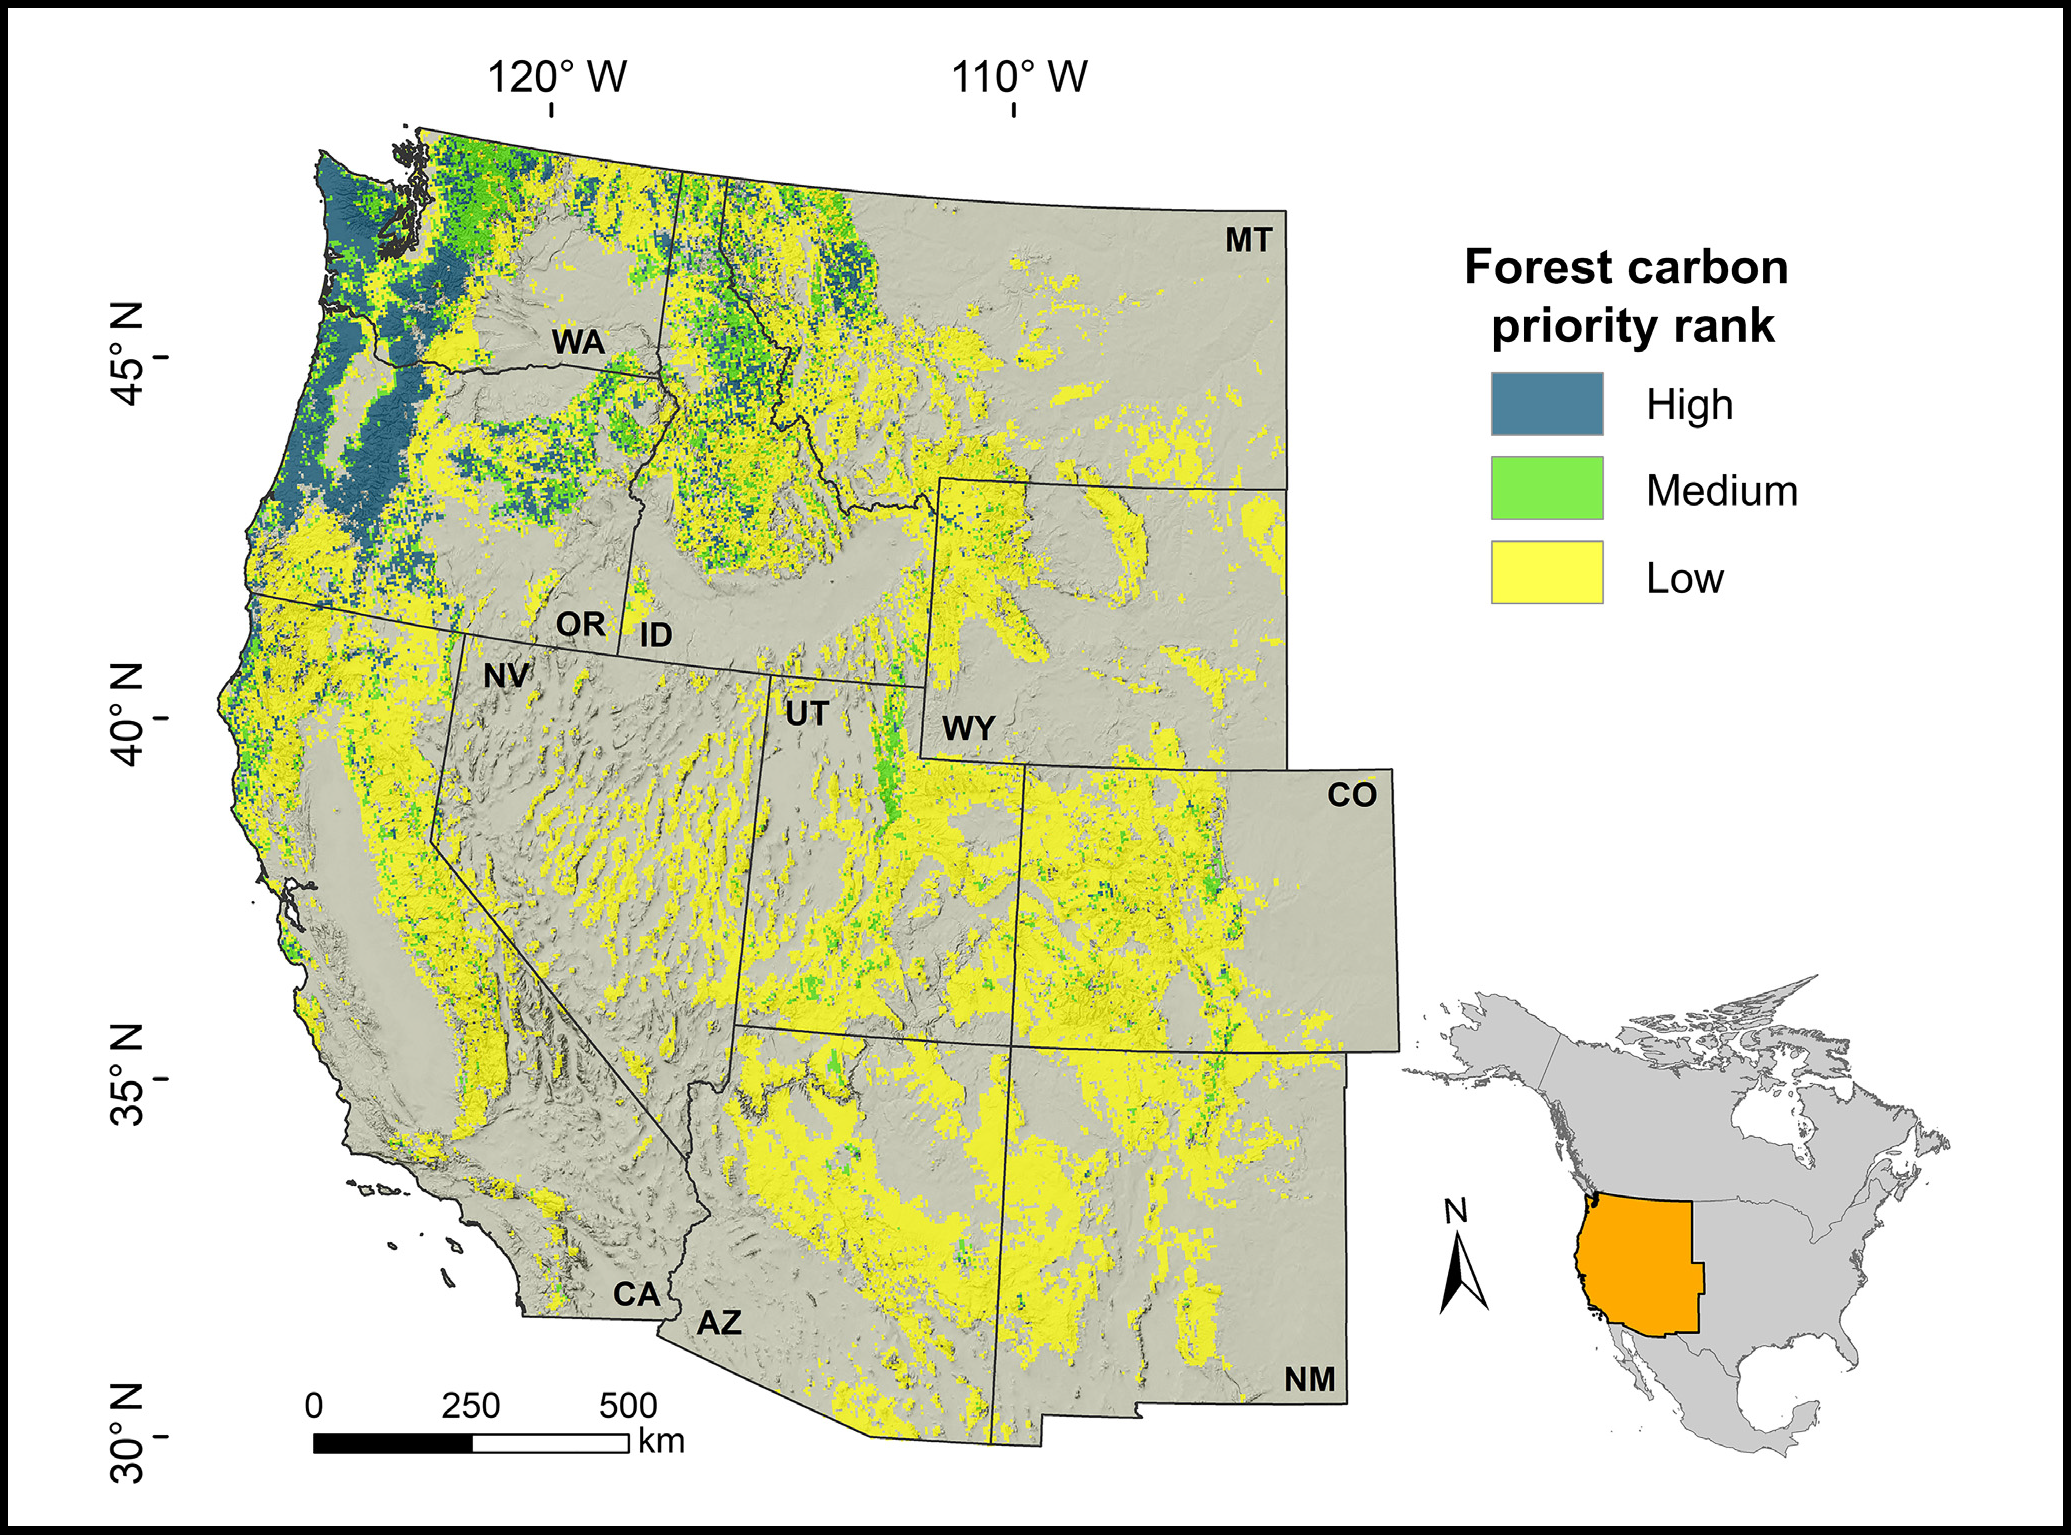
Figure 1. Forested land in the western conterminous United States classified by priority for preservation to mitigate climate change, based on the spatial co-occurrence of vulnerability to drought and fire and potential carbon sequestration. Source: Buotte et al. 2020
Citation
Buotte, P., B.E. Law, W. Ripple, and L.T. Berner. 2020. Forest Preservation Ranking and Vertebrate Species Richness, Western USA, 2020-2099. ORNL DAAC, Oak Ridge, Tennessee, USA. https://doi.org/10.3334/ORNLDAAC/1803
Table of Contents
- Dataset Overview
- Data Characteristics
- Application and Derivation
- Quality Assessment
- Data Acquisition, Materials, and Methods
- Data Access
- References
Dataset Overview
This dataset provides related gridded outputs of future modeled forest carbon sequestration priority and related species richness and habitat suitability for the western United States. The primary dataset is of the ranking of forest lands in the western U.S. for preservation based on the ability of these lands to sequester carbon over the coming century. The preservation ranking was derived from the results of simulations of future potential forest net ecosystem productivity (NEP) and vulnerability to drought and wildfire, as modeled from 2020 to 2099 at 4 km x 4 km resolution using a modified version of the Community Land Model (CLM 4.5). In addition, data files of potential forest NEP ranking and the forest vulnerability ranking are also provided. Co-located data of species richness for amphibians, birds, mammals, and reptiles are included to illustrate habitat suitability in relation to forest carbon preservation rankings. There are two files for each vertebrate class, one reflecting all western U.S. species included in the USGS GAP Analysis Project and a second for the subset of species listed as threatened or endangered by the U.S. Fish and Wildlife Service. Establishing this forest carbon preservation priority ranking for forest lands in the western U.S. will help guide the conservation of land for climate change mitigation activities and improved harvest management in the region.
Project: North American Carbon Program
The North American Carbon Program (NACP) is a multidisciplinary research program designed to improve understanding of North America's carbon sources, sinks, and stocks. The central objective is to measure and understand the sources and sinks of Carbon Dioxide (CO2), Methane (CH4), and Carbon Monoxide (CO) in North America and adjacent oceans. The NACP is supported by a number of different federal agencies.
Related Publication
Buotte, P.C., B.E. Law, W.J. Ripple, and L.T. Berner. 2020. Carbon sequestration and biodiversity co-benefits of preserving forests in the western United States. Ecological Applications 30(2):e02039. https://doi.org/10.1002/eap.2039
Related Datasets
The current dataset drew on archived simulations of forest carbon cycling over the 21st century (Buotte et al. 2019) and archived plant physiological parameters (Law et al. 2015).
Buotte, P., S. Levis, and B.E. Law. 2019. NACP: Forest Carbon Stocks, Fluxes and Productivity Estimates, Western USA, 1979-2099. ORNL DAAC, Oak Ridge, Tennessee, USA. https://doi.org/10.3334/ORNLDAAC/1662
Law, B.E., and L.T. Berner. 2015. NACP TERRA-PNW: Forest Plant Traits, NPP, Biomass, and Soil Properties, 1999-2014. ORNL DAAC, Oak Ridge, Tennessee, USA. https://doi.org/10.3334/ORNLDAAC/1292
Acknowledgments
This work was supported by the U.S. Department of Agriculture (USDA) National Institute of Food and Agriculture (NIFA) (grant 2013 67003 20652), USDA NIFA (grant 2014 67003 22065), USDA NIFA (grant 2014 35100 22066), and the U.S. Department of Energy (grant DE SC0012194).
Data Characteristics
Spatial Coverage: Forest lands in the western United States, including the states of Arizona, California, Colorado, Idaho, Montana, Nevada, New Mexico, Oregon, Utah, Washington, and Wyoming
Spatial Resolution: 4 km
Temporal Coverage: 2020-01-01 to 2099-12-31 for forest productivity and vulnerability simulations with the CLM 4.5. Species habitat suitability was assessed using 2001 input data beginning in 2008 and ending at various times from 2013 through 2016 by the USGS GAP Analysis Project (USGS 2018).
Temporal Resolution: One-time assessments
Study Area: Latitude and longitude are given in decimal degrees.
| Site | Northernmost Latitude | Southernmost Latitude | Easternmost Longitude | Westernmost Longitude |
|---|---|---|---|---|
| western United States | 52.0149361 | 27.71781 | -100.5022361 | -132.50324 |
Data File Information
There are 11 files in GeoTIFF (*.tif) format.
Table 1. File names and descriptions.
| File Names | Value Range | Description |
|---|---|---|
| rank_forest_carbon_priority.tif | 1-3 | Forest carbon preservation priority: the categorical forest priority rank based on potential future carbon sequestration and vulnerability to drought and fire from 2020-2099.
High priority forests (rank=3) have low vulnerability to future drought and fire along with the highest potential carbon sequestration. Medium priority forests (rank=2) have low vulnerability and moderate potential carbon sequestration. Low priority forests (rank=1) have either moderate to high vulnerability or low potential carbon sequestration. |
| rank_forest_potential_nep.tif | 1-3 |
Potential forest productivity: the categorical rank of cumulative potential (harvest-free) forest net ecosystem productivity (NEP) from 2020-2099 as simulated with CLM 4.5. The ranks include low, medium, and high potential forest NEP (coded 1-3, respectively). Net ecosystem productivity equals gross primary productivity minus ecosystem respiration (NEP = GPP – ER). Low, medium, and high cutoff values are given in Section 5. |
| rank_forest_vulnerability.tif | 1-3 |
Forest vulnerability: the categorical rank of forest vulnerability to drought or fire from 2020-2099 as simulated with CLM 4.5. The ranks include low, moderate, and high vulnerability based on the maximum vulnerability to either drought or fire (coded 1-3, respectively). |
| richness_amphibian.tif | 0-16 | Number of amphibian species with suitable habitat within each grid cell as determined by overlaying species habitat maps generated by the USGS GAP Analysis Project (USGS 2018). |
| richness_amphibian_te.tif | 0-3 | Number of amphibian species listed as threatened or endangered by the USFWS with suitable habitat within each grid cell. From a subset of the species habitat maps generated by the USGS GAP Analysis Project (USGS 2018). |
| richness_bird.tif | 11-249 | Number of bird species with suitable habitat within each grid cell as determined by overlaying species habitat maps generated by the USGS GAP Analysis Project (USGS 2018). |
| richness_bird_te.tif | 0-5 | Number of bird species with suitable habitat within each grid cell as determined by overlaying species habitat maps generated by the USGS GAP Analysis Project (USGS 2018). |
| richness_mammal.tif | 3-96 | Number of mammal species with suitable habitat within each grid cell as determined by overlaying species habitat maps generated by the USGS GAP Analysis Project (USGS 2018). |
| richness_mammal_te.tif | 0-4 | Number of mammal species listed as threatened or endangered by the USFWS with suitable habitat within each grid cell. From a subset of the species habitat maps generated by the USGS GAP Analysis Project (USGS 2018). |
| richness_reptile.tif | 0-68 | Number of reptile species with suitable habitat within each grid cell as determined by overlaying species habitat maps generated by the USGS GAP Analysis Project (USGS 2018). |
| richness_reptile_te.tif | 0-5 | Number of reptile species listed as threatened or endangered by the USFWS with suitable habitat within each grid cell. From a subset of the species habitat maps generated by the USGS GAP Analysis Project (USGS 2018). |
Data File Details
Missing data values are designated by "0" for files named rank_forest_*.tif and "255" for files named richness_*.tif.
The projection for all files is "Albers_Conic_Equal_Area", EPSG:42303:
PROJCS["Albers_Conic_Equal_Area",
GEOGCS["NAD83",
DATUM["North_American_Datum_1983",
SPHEROID["GRS 1980",6378137,298.2572221010042]],
PRIMEM["Greenwich",0],
UNIT["degree",0.0174532925199433]],
PROJECTION["Albers_Conic_Equal_Area"],
PARAMETER["standard_parallel_1",29.5],
PARAMETER["standard_parallel_2",45.5],
PARAMETER["latitude_of_center",23],
PARAMETER["longitude_of_center",-96],
PARAMETER["false_easting",0],
PARAMETER["false_northing",0],
UNIT["metre",1]]
Application and Derivation
Forest management (e.g., land preservation and reduced harvest) can contribute to climate change mitigation and the preservation of biodiversity. The effects of land-use change vary globally, therefore regional analyses are ideal for prioritizing lands for preservation and improving harvest management. This dataset includes maps of priority forest lands for preservation (i.e., no harvest) based on potential carbon sequestration and vulnerability to drought or fire, and corresponding maps of biodiversity to illustrate the spatial synergies and incongruities between two preservation metrics. See Buotte et al. (2020) for details.
Quality Assessment
The forest carbon priority rank was derived from simulations of potential carbon sequestration and vulnerability to drought and wildfire from 2020 to 2099 using Community Land Model 4.5 (CLM 4.5). The accuracy of contemporary carbon stock, carbon flux, burned area, and drought impact simulations (1979 to 2014) were evaluated using a broad set of field and remote sensing observations. Modeled carbon stocks and fluxes were compared with aboveground biomass interpolated from plot inventories (Wilson et al. 2013), carbon fluxes from five AmeriFlux sites, fluxes derived from plot inventories in Washington, Oregon, and California (Hudiburg et al. 2009, Hudiburg et al. 2011), and net primary productivity estimated from the MODIS satellites (Berner et al. 2017). The modeled burned area was also compared with a burned area data set derived from the Landsat satellites (Eidenshink et al. 2007). These assessments illustrate that the model is accurately simulating important aspects of the current regional forest carbon cycle. See Buotte et al. (2019b) and Buotte et al. (2020) for details.
Known Problems that Limit the Data Use
Simulations of future forest carbon cycling and vulnerability to disturbance are subject to multiple sources of uncertainty. For instance, the trajectory of future climate change is uncertain in part because future anthropogenic carbon dioxide emissions and the sensitivity of climate and biological system to these emissions are subject to uncertainty. These data result from simulations of future climate based on the Representative Concentration Pathway (RCP) 8.5 carbon dioxide emissions scenario since current emissions closely track this scenario (Peters et al. 2013). Furthermore, simulations of future climate used two general circulation models (GCMs). These included IPSL-CM5A-MR, which projects warm and dry future conditions, and MIROC5, which is close to the multi-model average for future temperature and precipitation across the western US (Buotte et al. 2019b). Simulations based on different RCPs or GCMs could yield different results. Other potentially important sources of uncertainty include biological responses to rising atmospheric CO2, unforeseen extreme events, and future impacts of pests and pathogens. The authors caution against using these data for fine-scale local analyses and believe the data are most suited for regional applications.
Data Acquisition, Materials, and Methods
Each data layer has a spatial resolution of 4 km and covers forest lands in the western United States, including Arizona, California, Colorado, Idaho, Montana, Nevada, New Mexico, Oregon, Utah, Washington, and Wyoming. The extent of forest land in 13 major forest types was determined by spatially aggregating an existing forest type data set (Ruefenacht et al. 2008) from 250 m to 4 km resolution. A 4 km grid cell was considered forested if ≥10% was covered by forest.
Model Simulations
Forest carbon preservation priority, potential forest productivity, and forest vulnerability ranks were derived from process-based simulations of regional forest carbon cycling performed every three hours from 2020–2099 and then integrated over the full period using a modified version of the Community Land Model (CLM 4.5) (Oleson et al. 2013). The CLM 4.5 is a land surface process model that simulates carbon, water, nutrient, and energy cycling based on mechanistic representation of underlying processes (e.g., photosynthesis, decomposition). The model was modified to improve the ability of CLM 4.5 to simulate carbon cycling in the region (Buotte et al. 2019b). The simulations relied on existing data sets related to plant physiological traits (Law and Berner 2015), forest stand age (Pan et al. 2011), forest type (Ruefenacht et al. 2008), and climate (Abatzoglou 2013). Simulations of photosynthesis were improved by parameterizing the physiological traits of dominant species in major forest types. Furthermore, simulations of drought stress were improved by incorporating species-specific stomatal response to soil moisture, as well as leaf shedding during periods of drought stress. Simulations of fire activity were also improved by incorporating regional ignition probability and fuel load constraints. The refined model was then driven with historical and projected climate, as well as with prescribed vegetation and soil types.
Forest Carbon Preservation Priority
High priority forests (rank=3) have low vulnerability to future drought and fire along with the highest potential carbon sequestration. Medium priority forests (rank=2) have low vulnerability and moderate potential carbon sequestration. Low priority forests (rank=1) have either moderate to high vulnerability or low potential carbon sequestration.
Potential Forest Productivity
The model was used to simulate photosynthesis, autotrophic and heterotrophic respiration, wildfire, and other ecosystem processes based on forest type, soil properties, climate, and atmospheric C02 concentrations. The model was initiated from bare-ground and run with 1901–1920 climate and no fire until soil carbon pools equilibrated. The model was then run from 1979–2014 with prognostic fires, prescribed harvest, and historical climate to capture recent historical conditions. Future potential net ecosystem productivity (NEP) was then simulated by running CLM with no prescribed harvest past 2014 using bias-corrected and temporally disaggregated climate simulations from two general circulation models (GCMs). The GCMs included IPSL-CM5A-MR and MIROC5 forced with the Representative Carbon Pathway (RCP) 8.5 carbon dioxide emission scenario. After simulating carbon cycle dynamics, the NEP was summed from 2020–2099 for each grid cell and then grid cells were classified as low, moderate, or high productivity by dividing the regional distribution of potential NEP into three equally sized terciles.
Specifically, grid cells were classified as low productivity if cumulative NEP was < 3.27 x 10⁴ g C m-2, moderate productivity if cumulative NEP was 3.27 x 10⁴ g C m-2 to 1.12 x 10⁵ g C m-2, and high productivity if cumulative NEP was > 1.12 x 10⁵ g C m-2.
Forest Vulnerability
The categorical rank of forest vulnerability to drought or fire from 2020-2099 was derived from simulations of forest carbon cycling processes. Drought vulnerability was based on the cumulative occurrence of years with low allocation to stem growth and or no net primary productivity. Fire vulnerability was based on the change in burned areas relative to historic conditions. Each grid cell was ranked as low, moderate, or high vulnerability based on the maximum vulnerability to either drought or fire.
Species Richness of Terrestrial Vertebrate Classes
The number of species with suitable habitat in each grid cell was determined by overlaying species habitat maps generated by the USGS GAP Analysis Project (USGS 2018) and then tallying the number of species with suitable habitat. Terrestrial vertebrate classes include amphibians, birds, mammals, and reptiles. The species habitat maps were provided by the UGSG at 30 m spatial resolution. To match the footprint of CLM simulations, these habitat maps were aggregated to 4 km resolution such that a CLM grid cell was considered potential habitat if it contained any habitat identified at 30 m resolution.
Terrestrial vertebrate species listed as threatened or endangered (T&E) by the U.S. Fish and Wildlife Service were identified and species richness was then reassessed for this subset of species.
Data Access
These data are available through the Oak Ridge National Laboratory (ORNL) Distributed Active Archive Center (DAAC).
Forest Preservation Ranking and Vertebrate Species Richness, Western USA, 2020-2099
Contact for Data Center Access Information:
- E-mail: uso@daac.ornl.gov
- Telephone: +1 (865) 241-3952
References
Abatzoglou, J. T. 2013. Development of gridded surface meteorological data for ecological applications and modelling. International Journal of Climatology 33:121-131. https://doi.org/10.1002/joc.3413
Berner, L. T., B. E. Law, and T. W. Hudiburg. 2017. Water availability limits tree productivity, carbon stocks, and carbon residence time in mature forests across the western US. Biogeosciences 14:365-378. https://doi.org/10.5194/bg-14-365-2017
Buotte, P., S. Levis, and B.E. Law. 2019. NACP: Forest Carbon Stocks, Fluxes and Productivity Estimates, Western USA, 1979-2099. ORNL DAAC, Oak Ridge, Tennessee, USA. https://doi.org/10.3334/ORNLDAAC/1662
Buotte, P. C., B. E. Law, W. J. Ripple, and L. T. Berner. 2020. Carbon sequestration and biodiversity co-benefits of preserving forests in the western United States. Ecological Applications 30:e02039. https://doi.org/10.1002/eap.2039
Buotte, P. C., S. Levis, B. E. Law, T. W. Hudiburg, D. E. Rupp, and J. J. Kent. 2019b. Near future forest vulnerability to drought and fire varies across the western United States. Global Change Biology 25:290-303. https://doi.org/10.1111/gcb.14490
Eidenshink, J., B. Schwind, K. Brewer, Z. Zhu, B. Quayle, and S. Howard. 2007. A project for monitoring trends in burn severity. Fire Ecology 3:3-21. https://doi.org/10.4996/fireecology.0301003
Hudiburg, T., B. Law, D. P. Turner, J. Campbell, D. Donato, and M. Duane. 2009. Carbon dynamics of Oregon and Northern California forests and potential land-based carbon storage. Ecological Applications 19:163-180. https://doi.org/10.1890/07-2006.1
Hudiburg, T. W., B. E. Law, C. Wirth, and S. Luyssaert. 2011. Regional carbon dioxide implications of forest bioenergy production. Nature Climate Change 1:419-423. https://doi.org/10.1038/nclimate1264
Law, B.E., and L.T. Berner. 2015. NACP TERRA-PNW: Forest Plant Traits, NPP, Biomass, and Soil Properties, 1999-2014. ORNL DAAC, Oak Ridge, Tennessee, USA. https://doi.org/10.3334/ORNLDAAC/1292
Oleson, K., D. M. Lawrence, G. B. Bonan, B. Drewniak, M. Huang, C. D. Koven, S. Levis, F. Li, W. J. Riley, Z. M. Subin, S. C. Pan, Y., J. M. Chen, R. Birdsey, K. McCullough, L. He, and F. Deng. 2011. Age structure and disturbance legacy of North American forests. Biogeosciences 8:715–732. https://doi.org/10.5194/bg-8-715-2011
Pan, Y., J. M. Chen, R. Birdsey, K. McCullough, L. He, and F. Deng. 2011. Age structure and disturbance legacy of North American forests. Biogeosciences 8:715–732. https://doi.org/10.5194/bg-8-715-2011
Peters, G. P., R. M. Andrew, T. Boden, J. G. Canadell, P. Ciais, C. Le Quere, G. Marland, M. R. Raupach, and C. Wilson. 2013. The challenge to keep global warming below 2 degrees C. Nature Climate Change 3:4-6. https://doi.org/10.1038/nclimate1783
Ruefenacht, B., M. Finco, M. Nelson, R. Czaplewski, E. Helmer, J. Blackard, G. Holden, A. Lister, D. Salajanu, and D. Weyermann. 2008. Conterminous US and Alaska forest type mapping using forest inventory and analysis data. Photogramm. Eng. Remote Sens 74:1379-1388. https://doi.org/10.14358/PERS.74.11.1379
USGS. 2018. Gap Analysis Project Species Habitat Maps CONUS_2001. U.S. Geological Survey. https://doi.org/10.5066/F7V122T2
Wilson, B. T., C. Woodall, and D. Griffith. 2013. Imputing forest carbon stock estimates from inventory plots to a nationally continuous coverage. Carbon balance and management 8:1-15. https://doi.org/10.1186/1750-0680-8-1