Get Data
Summary:
Revision Date: March 10, 2009
Summary:
The goal of this study was to determine the effects of soil phosphorus (P) status on litter decomposition rates using two factors: soil texture (with associated differences in soil P pools) and fertilization, in a fully factorial design. Mass and nutrient pools in litter from a single species, Marupa (Simaruba amara (Aubl.)), were measured quarterly between March 2000 and February 2001 in an undisturbed mature forest within the Tapajos National Forest at the kilometer 83 site. Reported here are litter mass and nutrients (carbon, nitrogen and phosphorus) as both raw values (grams for mass, percent for carbon and nitrogen and mg per kg for phosphorus), and as a fraction of the initial mass and nutrient pool. Data are provided in a comma separated ASCII format.
Data Citation:
Cite this data set as follows:
McGroddy, M.E. 2009. LBA-ECO TG-07 Litter Decomposition, Tapajos National Forest, Para, Brazil: 2000-2001. Data set. Available on-line [http://daac.ornl.gov] from Oak Ridge National Laboratory Distributed Active Archive Center, Oak Ridge, Tennessee, U.S.A. doi:10.3334/ORNLDAAC/925
Implementation of the LBA Data and Publication Policy by Data Users:
The LBA Data and Publication Policy [http://daac.ornl.gov/LBA/lba_data_policy.html] is in effect for a period of five (5) years from the date of archiving and should be followed by data users who have obtained LBA data sets from the ORNL DAAC. Users who download LBA data in the five years after data have been archived must contact the investigators who collected the data, per provisions 6 and 7 in the Policy.
This data set was archived in April of 2009. Users who download the data between April 2009 and March 2014 must comply with the LBA Data and Publication Policy.
Data users should use the Investigator contact information in this document to communicate with the data provider. Alternatively, the LBA Web Site [http://lba.inpa.gov.br/lba/] in Brazil will have current contact information.
Data users should use the Data Set Citation and other applicable references provided in this document to acknowledge use of the data.
Table of Contents:
- 1 Data Set Overview
- 2 Data Characteristics
- 3 Applications and Derivation
- 4 Quality Assessment
- 5 Acquisition Materials and Methods
- 6 Data Access
- 7 References
1. Data Set Overview:
Project: LBA (Large-Scale Biosphere-Atmosphere Experiment in the Amazon)
Activity: LBA-ECO
LBA Science Component: Trace Gas and Aerosol Fluxes
Team ID: TG-07 (Keller / Oliveira)
The investigators were Keller, Michael M.; Oliveira Jr., Raimundo Cosme de; Albuquerque, Sergio Silva; Alexander, Jess Everett; Araujo, Flavia; Bowley, Evilene; Braswell, Bobby H.; Brewster, Lorena Cordeiro; Camargo, Plinio Barbosa de; Carmo, Janaina Braga do; Crill, Patrick Michael; Dias, Jadson Dezincourt; Dias, Joelma Dezincourt; Filho, Deusdedith Cruz; Hagen, Stephen Charles; Hunter, Maria O'Healy; Li, Changsheng; Lima, Risonaldo Leal; Mello, William Zamboni de; Mosedale, Andrew H; Palace, Michael William; Pepler, Paul Thomas; Pereira, Cleuton Alessandro; Pereira, Rodrigo Antonio; Rivera Costa, Maria Milagros; Sampaio, Irene Cibelle Goncalves; Scaranello, Marcos Augusto; Silva, Hudson Cleber Pereira; Silva, Kadson Oliveira; Silva, Kemeson Oliveira da; Sousa Neto, Eraclito Rodrigues de; Varner, Ruth; Xiao, Xiangming and Zweede, Johan Cornelis . You may contact McGroddy, Megan (mmcgroddy@gmail.com)
LBA Data Set Inventory ID:
TG07_Litter_Decomposition
The goal of this study was to determine the effects of soil phosphorus status on litter decomposition rates using two factors: soil texture (with associated differences in soil P pools) and fertilization, in a fully factorial design. Mass and nutrient pools in litter from a single species (Simaruba amara (Aubl.)) were measured quarterly between March 2000 and February 2001 in an undisturbed mature forest within the Tapajos National Forest at the kilometer 83 site. Reported here are litter mass and nutrients (carbon, nitrogen and phosphorus) as both raw values (grams for mass, percent for carbon and nitrogen and mg per kg for phosphorus), and as a fraction of the initial mass, and nutrient pool.
2. Data Characteristics:
Data are provided in a single comma separated ASCII file. Missing values are indicated with -9999.
Please note that decomposition rates were not
expressed as real rates but rather
calculated as mass loss per year. Samples were put out in the field in
March 2000 and
subsets were collected every three months through February 2001.
| Variables | (units) and Description |
|---|---|
| collection_date | (yyyymmdd) |
| soil | clay or sand |
| plot | ranges from 1-3 |
| sub_plot | ranges from 1-3 |
| string | ranges from 1-3, indicates the set of bags that were collected from the same location within a subplot for each collection |
| treatment | T or C, T means fertilized subplot with 137 kg P per hectare added annually, C indicates a control subplot with no nutrient additions |
| sample_id | ranges from 1-1690 |
| original_wt | (grams) air-dry weight of leaf litter for each bag before being placed in the field |
| 65_degree_original_wt | (grams) original sample weight expressed on an oven dry (at a temperature of 65 degrees C) basis using a conversion factor of 0.9868 based on comparison of air and oven dry weights for a subset of samples |
| ash_and_temp_corrected_original_wt | (grams) original sample weight expressed on an oven dry (at a temperature of 65 degrees C) and ash free basis using an ash content of 3.65 percent on comparison pre and post ash ( at 550 degrees C) weights of litter subsamples |
| collection_50_degree_wt | (grams) oven dry weight of leaf litter for each bag collected from the field. Litter was cleaned of mud and frass (insect debris) before drying at 50 degrees C |
| collection_65_degree_wt | (grams) sample weight expressed on an oven dry (at a temperature of 65 degrees C) basis using a conversion factor unique to each collection based on oven drying a subset of samples from each plot |
| collection_ash_component | (percent) amount of ash material in each sample determined by combusting a 0.5 g subsample at 550 degrees C overnight |
| collection_wt_ash_corrected | (grams) sample weight expressed on an oven dry (at a temperature of 65 degrees C) and ash free basis using each samples determined ash content |
| mass_remaining | (fraction of original) sample mass expressed a fraction of the original leaf litter weight in that sample |
| raw_N | (percent) litter nitrogen (N) concentration determined via combustion on a CE Elantech CNS analyzer |
| raw_C | (percent) litter carbon (C) concentration determined via combustion on a CE Elantech CNS analyzer |
| raw_P | (mg P per kg tissue) litter phosphorus (P) concentration determined via H2SO4 digest and analyzed on an inductive coupled plasma spectrometer (ICP) |
| ash_corrected_N | (percent) N concentration expressed on an ash free basis by adjusting the weight of the subsample analyzed using the ash content determined for that sample |
| ash_corrected_C | (percent) C concentration expressed on an ash free basis by adjusting the weight of the subsample analyzed using the ash content determined for that sample |
| ash_corrected_P | (percent) P concentration expressed on an ash free basis by adjusting the weight of the subsample analyzed using the ash content determined for that sample |
| N_remaining | (fraction of original) total sample N pool expressed as a fraction of the original N in the sample |
| C_remaining | (fraction of original) total sample C pool expressed as a fraction of the original C in the sample |
| P_remaining | (fraction of original) total sample P pool expressed as a fraction of the original P in the sample. Mass was determined for all samples but nutrient content was determined only for 3 of the 5 samples per string collected. |
Example Data Records:
| Litter decomposition study TG-07,,,,,,,,,,,,,,,,,,,,,,, Species:Simaruba amara (Aubl.) common name Marupa,,,,,,,,,,,,,,,,,,,,,,, "Location: Km 83 Floresta Nacional Tapajos, Para",,,,,,,,,,,,,,,,,,,,,,, for treatment variable T means fertilized with 137 kg P per hectare per year,,,,,,,,,,,,,,,,,,,,,,, collection date is represented as yyyymmdd,,,,,,,,,,,,,,,,,,,,,,, Mass data is presented as raw values in grams (oven dried at 50 degrees C) and also corrected to a 65 degree dry wt and corrected for ash content. Finally sample mass is presented as a fraction of the original mass (65 degree dry wt and ash corrected),,,,,,,,,,,,,,,,,,,,,,, Nutrient data is presented as raw values in percent for N and C and mg per kg litter tissue for P ,,,,,,,,,,,,,,,,,,,,,,, In addition the raw nutrient values were corrected for ash component of each sample and presented as percent,,,,,,,,,,,,,,,,,,,,,,, Finally nutrient values were also calculated as fraction of original pool remaining,,,,,,,,,,,,,,,,,,,,,,, collection_date, soil, plot, sub_plot, string, treatment, sample_id, original_wt, 65_degree_original_wt, ash_and_temp_corrected_original_wt, collection_50_degree_wt, collection_65_degree_wt, collection_ash_componen,t collection_wt_ash_corrected, mass_remaining, raw_N, raw_C, raw_P, ash_corrected_N, ash_corrected_C, ash_corrected_P, N_remaining, C_remaining, P_remaining yyyymmdd,,,,,,, g, g, g, g, g, percent, g, fraction of original, percent, percent, mg per kg, percent,percent, percent, fraction of original, fraction of original,fraction of original 20000602, Clay, 1, 2, 1, C, 46, 5.04,4.97, 4.79, 3.882, 3.83, 0.1337, 3.32, 0.6925, 1.77, 45.55, 462, 2.04,52.58, 0.05, 0.73, 0.69, 0.74 20000602, Clay, 1, 2, 1, C, 233, 5.03, 4.96, 4.78, 4.261, 4.2, 0.1559, 3.55, 0.7421, 1.6, 43.82, 645, 1.9, 51.91, 0.06, 0.72, 0.73, 0.95 20000602, Clay, 1, 2, 1, C, 307, 5.05, 4.98, 4.8, 4.115, 4.06, 0.2402, 3.09, 0.6426, 1.75, 36.75, 788, 2.3, 48.37, 0.08, 0.76, 0.59, 1.1 ... 20010220, Sand, 3, 1, 3, T, 1526, 5.1, 5.03, 4.85, -9999, 2.97, 0.0428, 2.84, 0.5863, 2.29, 48.95, 569, 2.39, 51.14, 0.06, 0.72, 0.57, 0.75 20010220, Sand, 3, 1, 3, T, 1558, 5.01, 4.94, 4.76, -9999, 2.64, 0.0927, 2.4, 0.5028, -9999, -9999, -9999, -9999, -9999, -9999, -9999, -9999, -9999 20010220, Sand, 3, 1, 3, T, 1572, 5.14, 5.07, 4.89, -9999, 3.3, 0.1043, 2.96, 0.6048, 2.19, 46.96, 615, 2.45, 52.43, 0.06, 0.76, 0.6, 0.78 |
Site Boundaries: (All latitude and longitude given in decimal degrees)
| Site (Region) | Westernmost Longitude | Easternmost Longitude | Northernmost Latitude | Southernmost Latitude | Geodetic Datum |
|---|---|---|---|---|---|
| Para Western (Santarem) - km 83 Logged Forest Tower Site (Para Western (Santarem)) | -54.97070 | -54.97070 | -3.01700 | -3.01700 | World Geodetic System, 1984 (WGS-84) |
Time period:
- The data set covers the period 2000/03/01 to 2001/02/21.
- Temporal Resolution: Quarterly
Platform/Sensor/Parameters measured include:
- FIELD INVESTIGATION / WEIGHING BALANCE / DECOMPOSITION
- LABORATORY / WEIGHING BALANCE / CARBON
- FIELD INVESTIGATION / HUMAN OBSERVER / LITTER CHARACTERISTICS
- LABORATORY / CHN ANALYZER / NITROGEN
- LABORATORY / ICP-AES (INDUCTIVELY COUPLED PLASMA ATOMIC EMISSION SPECTROMETER) / PHOSPHORUS
3. Data Application and Derivation:
Our data show no significant effect of either soil type (sandy loam vs clay) or addition of P as super triple phosphate, on litter decomposition rates (McGroddy et al. 2004). The methods in this study used litter from a single species in mesh decomposition bags, and the rate of decomposition of mixed species litter with the effects of meso and macrofauna may differ from our calculated values.
4. Quality Assessment:
Quality
Assurance Activities:
For nutrient analyses, standard materials were analyzed concurrently
with the litter samples. For C and N analyses, acetanilide (10.36 % N
and 71.09 % C) was
used as a reference standard. Samples were analyzed in duplicate and
a rejection
criterion was set at > 10% variance between duplicates. Total P
was determined
after a H2O2 predigest and modified Kjeldhal digest of ground plant
tissue. NIST Apple leaves were used as a reference standard with a 98 %
(+/- 2%)
recovery.
Confidence
Level or Accuracy Judgment:
Means and standard errors of each mass and nutrient pool measure are
presented in the published results (McGroddy et al. 2004). These statistics were calculated for each plot after combining the results from the "strings of bags" collected from each plot over time. This was necessary to improve the precision of our measurements given the significant heterogeneity in the soils and variability of the decomposition process. Significant
digits of the
reported results represent the limits of the associated
instruments.
Measurement
Error for Parameters:
Precision limits: Weighing balances for mass measurements + 0.01g, CN analysis +
0.01 % for both C and N, ICP spectroscopy for P in digest solution detection limit was 2
ug per
liter which translates into an uncertainty of approximately 750 mg P per kg
tissue or 1 percent.
5. Data Acquisition Materials and Methods:
Study
Area
Data were collected from study sites located
in the Tapajos National Forest, Para at km 83 location. The clay soil
plots were located 1.2 km
south of the entrance road along transect 7B from the original tree
inventory done
by the Tropical Forest Foundation (FFT). The sand soil plots were
located 300
m west of transect 9B and 750 m south of the main road.
Decomposition rates were not related to spatial area but rather
calculated as mass loss per year. Samples were put out in the field in
March 2000 and subsets were collected every three months through
February 2001.
Methods
Plot
and treatment design
In April 1999, six experimental blocks (100 x 12 m) were established in
the Flona Tapajos National Forest at kilometer 83, 3 in clay and 3 in
sand. Each block was divided into 5 plots (20 x 12 m). The first,
third, and fifth plots were used as treatment plots with the second and
fourth plots acting as buffer zones to prevent potential contamination.
One treatment plot in each block was randomly selected to receive 137
kg P ha-1 yr-1 in the form of super triple phosphate granules. One-third of the
fertilizer was applied in May 1999 and applications were repeated every
four months thereafter.
To assess decomposition, leaves of Marupa (Simaruba amara (Aubl.)) were collected from an 18-year-old plantation managed by EMBRAPA in Belterra, Para approximately 40 km north of the study site. Marupa was chosen because it is a native species found in the Tapajos National Forest. The plantations were established on abandoned pastures with highly weathered soils similar to the clay soils at the study site.
Litterfall was collected weekly between January and mid-February 2000 in 1 m2 traps 0.5 m above the ground. The marupa leaves were separated from the rest of the collection, dried at 50°C for 72 hours, and pooled.
We constructed 20 x 20 cm litter bags from fiberglass window screening (openings approximately 1 mm2) and filled each bag with ~5 g of air-dry litter (n = 720). Using nylon fishing line, the bags were strung together in groups of five with 20 cm between each bag. Four strings of litter bags (one string for each harvest) were placed in each replicate location (3 replicates per plot). All litter bags were installed in the field on March 2, 2000.
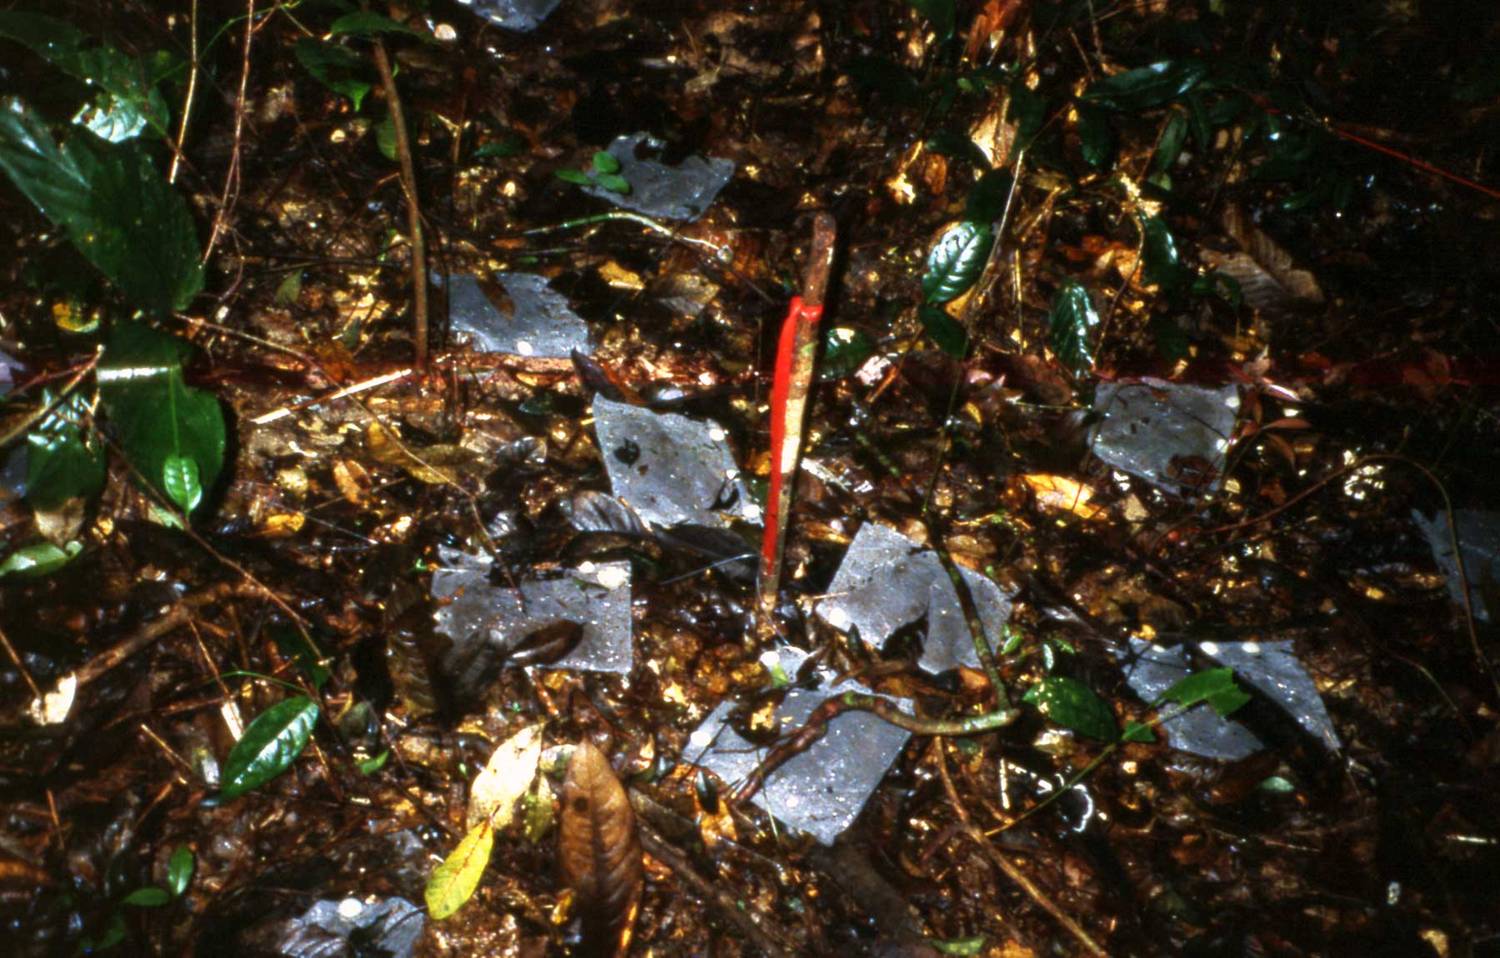 |
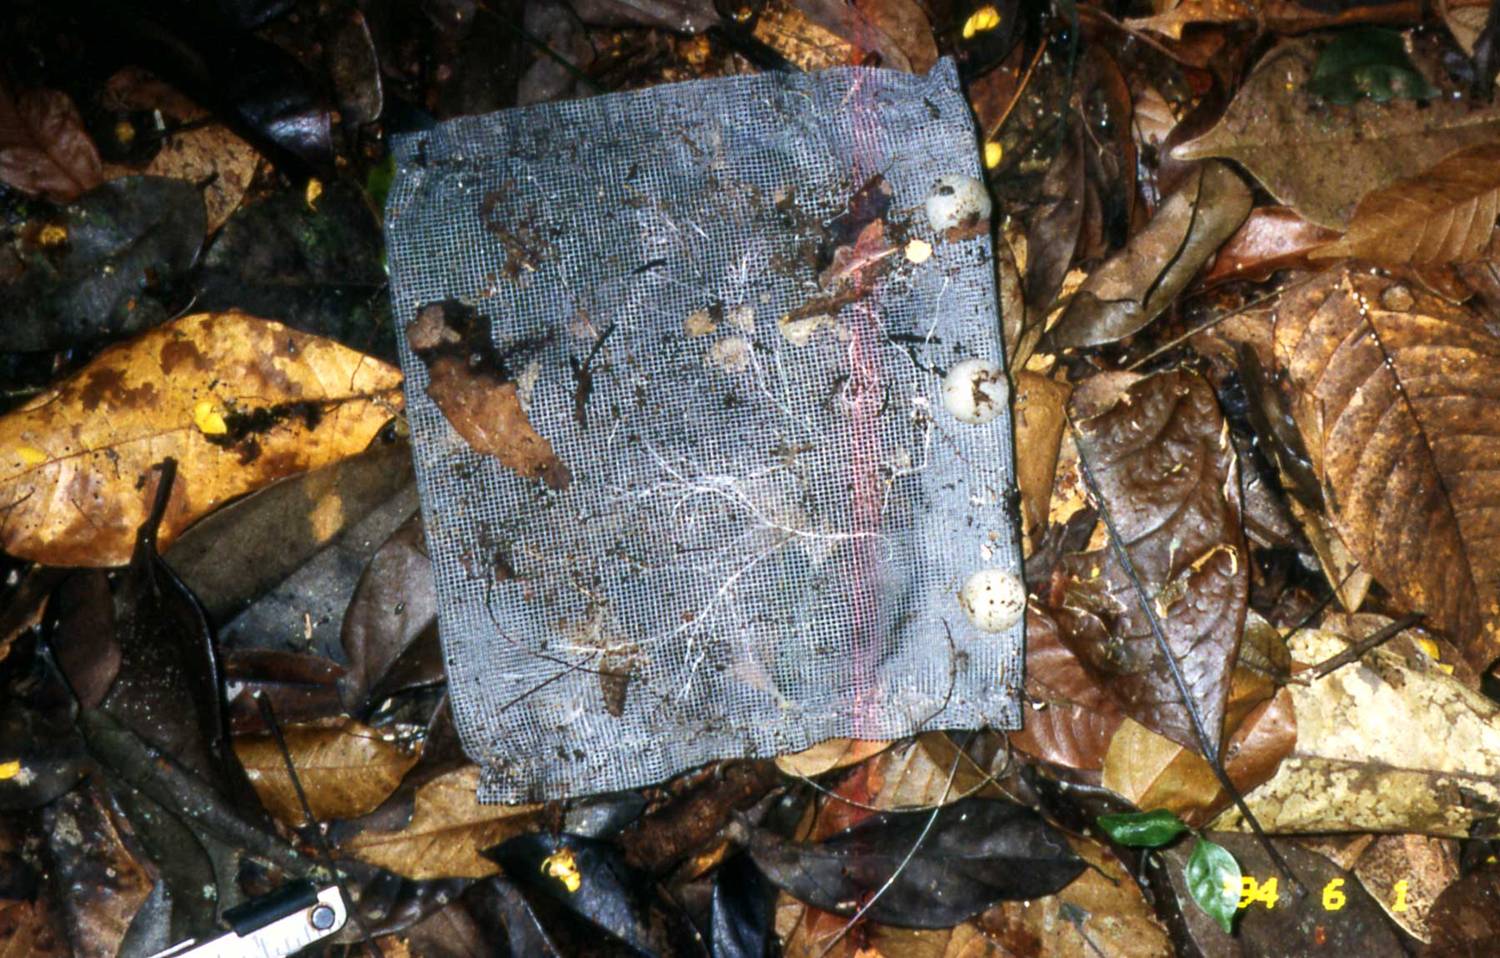
|
Litter bags as installed at a field plot and close up.
Sampling:
Litter bags were collected 3, 6, 9, and 11 months after installation and
all collections were at least one month after the most recent
fertilization.
Analyses:
Litter bags were air-dried in a drying room in Santarem for 2 to 5 days immediately upon collection. The litter was then removed from the bag and cleaned of visible roots, frass (insect debris) and fungi, oven dried at 50°C for 48 h and weighed. Sub-samples of all tissue (litter, initial decomposition samples that were never placed in the field, and forest floor) were dried to 65°C to develop dry weight conversions. Ground, half-gram subsamples were then ashed in a muffle furnace at 550°C for 4 h to determine inorganic content. All data are reported on an ash-free, 65°C dry weight basis.
Total tissue C, N and P were measured on all initial litter samples and a sub-set of the decomposition samples collected from the field (3 bags from each string of 5 collected, n = 432). Ground samples were analyzed for total C and N on a CE Instruments NC2500 Soil Elemental Analyzer (CE Instruments, Lakewood, NJ, USA). Samples were analyzed in duplicate and rejection criterion was set at > 10% variance between duplicates. Total P was determined on a Thermo Jarrell Ash axial IRIS ICP-AES (Thermo Elemental, Franklin MA) at the University of California, Berkeley after a H2O2 predigest and modified Kjeldhal digest of ground plant tissue. NIST Apple leaves were used as a reference standard with a 98 % (+ 2) recovery.
6. Data Access:
This data is available through the Oak Ridge National Laboratory (ORNL) Distributed Active Archive Center (DAAC).
Data Archive Center:
Contact for Data Center Access Information:
E-mail: uso@daac.ornl.gov
Telephone: +1 (865) 241-3952
7. References:
McGroddy, M.E., W.L. Silver and R. Cosme de Oliveira Jr. 2004. The effect of phosphorus additions on decomposition dynamics in a seasonal lowland Amazonian forest. Ecosystems 7:172-179. doi:10.1007/s10021-003-0208-y