Summary:
This data set provides the results of soil physical property and chemical measurements of samples collected from two pasture chronosequences (years since conversion from primary forest) located on two ranches south of Santarem, Para, Brazil, and east of the Tapajos River. Soil data includes soil classification, bulk density, texture, and mean concentrations of total nitrogen (N), carbon (C), phosphorus (P), and P fractions. The soils were high clay oxisols and highly sandy entisols.
One chronosequence of sites was established on oxisol soils dating 2, 7, and 15 years since conversion from primary forest. A second set of sites, 1, 7, and 15 years old, was established on the sandy entisols. Five of the six pasture sites were on a single ranch; the 2-year-old oxisol pasture was the exception. Ten soil samples per site were collected from 0-10 cm depth along random intervals within 100-m transects in August 1997.
There are two comma-delimited (.csv) data files with this data set.
Data Citation:
Cite this data set as follows:
Asner, G.P., A.R. Townsend, and M.M.C. Bustamante. 2013. LBA-ECO ND-10 Soil Properties of Pasture Chronosequences, Para, Brazil: 1997. Data set. Available on-line [http://daac.ornl.gov] from Oak Ridge National Laboratory Distributed Active Archive Center, Oak Ridge, Tennessee, USA. http://dx.doi.org/10.3334/ORNLDAAC/1171
Implementation of the LBA Data and Publication Policy by Data Users:
The LBA Data and Publication Policy [http://daac.ornl.gov/LBA/lba_data_policy.html] is in effect for a period of five (5) years from the date of archiving and should be followed by data users who have obtained LBA data sets from the ORNL DAAC. Users who download LBA data in the five years after data have been archived must contact the investigators who collected the data, per provisions 6 and 7 in the Policy.
This data set was archived in June 2013. Users who download the data between June 2013 and May 2018 must comply with the LBA Data and Publication Policy.
Data users should use the investigator contact information in this document to communicate with the data provider.
Data users should use the Data Set Citation and other applicable references provided in this document to acknowledge use of the data.
Table of Contents:
- 1 Data Set Overview
- 2 Data Characteristics
- 3 Applications and Derivation
- 4 Quality Assessment
- 5 Acquisition Materials and Methods
- 6 Data Access
- 7 References
1. Data Set Overview:
Project: LBA (Large-Scale Biosphere-Atmosphere Experiment in the Amazon)
Activity: LBA-ECO
LBA Science Component: Nutrient Dynamics
Team ID: ND-10 (Townsend / Asner / Bustamante)
The investigators were Asner, Gregory Paul; Townsend, Alan R. and Bustamante, Mercedes M.C. You may contact Asner, Gregory P. (greg@globalecology.stanford.edu); Townsend, Alan R. (Alan.Townsend@colorado.edu) and Bustamante, Mercedes M.C. (mercedes@unb.br).
LBA Data Set Inventory ID: ND10_Soil_Chemistry
This data set provides the results of soil physical property and chemical measurements of samples collected from two pasture chronosequences (years since conversion from primary forest) located on two ranches south of Santarem, Para, Brazil, and east of the Tapajos River. Soil data includes soil classification, bulk density, texture, and mean concentrations of total nitrogen (N), carbon (C), phosphorus (P), and P fractions. The soils were high clay oxisols and highly sandy entisols.
One chronosequence of sites was established on oxisol soils dating 2, 7, and 15 years since conversion from primary forest. A second set of sites, 1, 7, and 15 years old, was established on the sandy entisols. Five of the six pasture sites were on a single ranch; the 2-year-old oxisol pasture was the exception. Ten soil samples per site were collected from 0-10 cm depth along random intervals within 100-m transects in August 1997.
2. Data Characteristics:
There are two comma-delimited data files with this data set.
File 1. ND10_tapajos_pasture_soil_chemistry.csv
| Column | Heading | Units/format | Description |
|---|---|---|---|
| 1 | Soil_order | Soil order either Oxisol or Entisol | |
| 2 | Age | Y | Age of the pasture at the time of sampling in years |
| 3 | Sand | % | Percent of soil mass classified as sand particles |
| 4 | Silt | % | Percent of soil mass classified as silt particles |
| 5 | Clay | % | Percent of soil mass classified as clay particles |
| 6 | pH | Soil pH | |
| 7 | Total_C_conc | % | Mean soil C concentration reported in percent (%). Total C was determined on a combustion reduction elemental analyzer |
| 8 | Total_C_stderr | % | Standard error of the mean soil C concentration, N of 10 samples per site |
| 9 | Total_N_conc | % | Mean soil N concentration reported in percent (%). Total N was determined on a combustion reduction elemental analyzer |
| 10 | Total_N_stderr | Standard error of the mean soil N concentration, N of 10 samples per site | |
| 11 | Total_P_conc | ug/g | Mean soil P concentration reported in micrograms P per gram of soil (ug/g). Total P was determined using a sulfuric acid digest see methods for details |
| 12 | Total_P_stderr | Standard error of the mean soil P concentration, N of 10 samples per site | |
| 13 | Bulk_density | g/cm3 | Soil bulk density reported in grams per centimeter cubed (g/cm3) |
| 14 | Total_C_pool | kg/m2 | Mean soil C pool in the 0 to 10 cm depth calculated from measured soil C concentration (Col 5) and bulk density (Col 8) and reported in kilograms C per meter squared (kg/m2) |
| 15 | Total_N_pool | kg/m2 | Mean soil N pool in the 0 to 10 cm depth calculated from measured soil N concentration (Col 7) and bulk density (Col 8) and reported in kilograms N per meter squared (kg/m2) |
| 16 | Total_P_pool | g/m2 | Mean soil P pool in the 0 to 10 cm depth calculated from measured soil P concentration and bulk density (Col 8) and reported in grams P per meter squared (g/m2) |
Example records:
|
Soil_order,Age,Sand,Silt,Clay,pH,Total_C_conc,Total_C_stderr,Total_N_conc,Total_N_stderr,Total_P_conc,Total_P_stderr, Bulk_density,Total_C_pool,Total_N_pool,Total_P_pool Oxisol,2,37,3,60,5.3,4.35,0.1,0.32,0.02,173.8,14.8,1.2,5.2,0.4,20.9 Oxisol,7,39,2,59,5.4,2.28,0.04,0.19,0.01,135.8,6.7,1.5,2.7,0.2,16.3 ... Entisol,7,92,2,5,5.6,1.54,0.2,0.09,0.04,52.3,4.3,1.4,2.2,0.1,7.5 Entisol,15,91,4,5,5.3,1.4,0.04,0.08,0.01,45.2,2.1,1.4,2,0.1,6.5 |
File 2. ND10_tapajos_pasture_P_fractions.csv
| Column | Heading | Units/format | Description |
|---|---|---|---|
| 1 | Soil | Soil order either oxisol or entisol | |
| 2 | Age | Y | Pasture age in years at the time of sampling |
| 3 | P_fraction | Pi or Po | Name of the fraction labeled according to extractant (NaOH, HCL, Resin, Bicarb, Residual, or Sum of fractions) in the modified Hedley technique. The appended "_Pi" indicates inorganic P and the appended "_Po" indicates organic P |
| 4 | Mean_conc | ug/g | Concentration of P reported in micrograms P per gram of soil (ug/g) |
| 5 | Std_err_conc | ug/g | Standard error of the mean concentration reported in micrograms of P per gram of soil (ug/g). N= 8 for all |
Example records:
|
Soil,Age,P_fraction,Mean_conc,Std_err_conc Oxisol,2,Resin_Pi,8.6,3.5 Oxisol,2,Bicarb_Pi,2.9,1.7 ... Oxisol,15,Sum of fractions,139.7,4.4 Entisol,1,Resin_Pi,6.8,1.2 ... Entisol,15,Residual,9.6,0.8 Entisol,15,Sum of fractions,39.6,1.5 |
Site boundaries: (All latitude and longitude given in decimal degrees)
| Site (Region) | Westernmost Longitude | Easternmost Longitude | Northernmost Latitude | Southernmost Latitude | Geodetic Datum |
|---|---|---|---|---|---|
| Ranch Pasture Site (1): Para Western (Santarem) (Para Western (Santarem)) Basins) | -54.666 | -54.666 | -3.1333 | -3.1333 | World Geodetic System, 1984 (WGS-84) |
| Ranch Pasture Site (2): Para Western (Santarem) (Para Western (Santarem)) | -54.933 | -54.933 | -3.2666 | -3.2666 | World Geodetic System, 1984 (WGS-84) |
Time period:
- The data set covers the period August 1997
Platform/Sensor/Parameters measured include:
- FIELD INVESTIGATION / ANALYSIS / SOIL CHEMISTRY
- FIELD INVESTIGATION / ANALYSIS / SOIL TEXTURE
- FIELD INVESTIGATION / ANALYSIS / BULK DENSITY
- LABORATORY / ANALYSIS / CARBON
- LABORATORY / ANALYSIS / NITROGEN
- LABORATORY / AUTOANALYZER / PHOSPHATE
3. Data Application and Derivation:
Land-use-driven changes in P availability may be central to predicting the sustainability of cleared land, as well as land-atmosphere exchanges of carbon and trace gases following forest conversion.
Soil P losses after deforestation may be an indicator for long-term productivity after cleared lands are abandoned.
4. Quality Assessment:
Statistical analyses of differences among sites and along each chronosequence were performed using the one-way ANOVA procedure in SPSS v.10.0 (SPSS Inc., Chicago, Illinois). Where significant trends were found, further analyses of differences between each site were evaluated using the same software to perform a post hoc Tukey’s HSD test.
5. Data Acquisition Materials and Methods:
Site Description:
The research sites consisted of two pasture chronosequences (years since conversion from primary forest) located on two ranches south of Santarem, Para, and east of the Tapajos River. Mean annual rainfall is 2,000 mm, the bulk of which occurs between January and May, and mean annual temperature is 25 degrees C. All sites are on upland terra firma that has pockets of relic depositional surfaces, creating a mix of high clay oxisol sand highly sandy entisols (Asner et al., 1999).
One chronosequence of pastures was established on the oxisols dating 2, 7, and 15 years since conversion, and a second trio of sites (1, 7, and 15 years old) was established on the sandy entisols. Five of the six pastures were on a single ranch; the 2-year-old oxisol pasture was the exception. Three of the sites (1-year entisol , 2-and 7-year oxisols) were dominated by the pasture grass Brachyaria brizantha. The 15-year clay and sand sites and the 7-year sand pasture were dominated by the grass, Pennesetum clandestinum. All pastures were formed from primary forest. Some woody invaders, notably Solanum paniculatum, were sparsely distributed in some of the sites. All but the two youngest pasture sites had been burned since conversion as a means of controlling woody pioneer species, with one post-clearing burn in each of the two 7-year-old pastures, and two such burns in the two oldest pastures. The two youngest pastures in each sequence had not yet been grazed. Relief in all sites was minimal, and none of the pastures had been fertilized (Townsend et al., 2002).
Soil Collections and Analyses (from Townsend et al., 2002)
Ten soil samples per site were collected from 0-10 cm depth along random intervals within 100-m transects, air dried, and sieved at 2 mm and analyzed for pH, texture (percent sand, silt, or clay). Total C, N, P, and P fraction were determined according to the following:
Total C, N, and P analyses:
- Subsamples for total C and N were ground to a fine powder and analyzed using a combustion-reduction elemental analyzer.
- Total P analyses were performed by digesting 5 g of sieved, air-dried soil in H2SO4 and H2O2; the digested solution was then analyzed for phosphate concentrations using a flow-injection autoanalyzer.
Bulk density:
- Bulk density measurements were determined using an excavation method in which the volume of removed soil is measured by replacing it with a known volume of sand, then the soil removed is dried and weighed.
- Because the higher bulk densities that are often found in increasingly older pastures are typically due to soil compaction, total soil values for all elements in pasture sites were corrected for compaction as described by Veldkamp (1994).
P fractions: Approximately 1 g of soil from eight of the ten cores was analyzed for soil P fractions using the modified Hedley fractionation technique described by Tiessen and Moir (1993) (Fig.2):
- The soil was subjected to a series of extractions in the following order: a resin extraction (in water), bicarbonate, 0.1M sodium hydroxide (NaOH), 1M hydrogen chloride (HCl), hot concentrated HCl. and a final peroxide/sulfuric acid digest (residue fraction).
- A final peroxide/sulfuric acid digest (on the solution following bicarbonate, NaOH and HCl extractions, and organic P in each fraction was determined by difference.
- Phosphate concentrations in each fraction were determined using an Alpkem autoanalyzer.
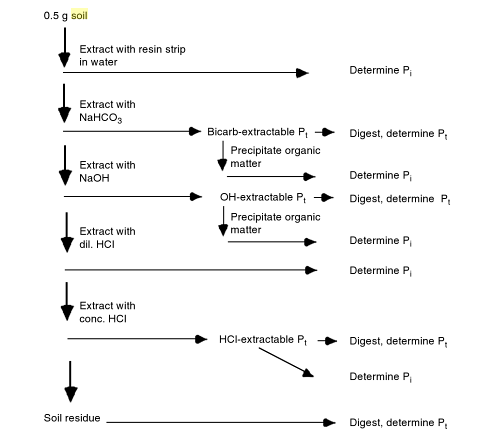
Figure 2. Diagram of sequential P extraction process. Pi = inorganic P, Po=organic P, Pt=total P (Tiessen and Moir, 1993).
The one exception to the method above was that all fractions were analyzed on an Alpkem autoanalyzer, and rather than titrating each fraction by hand as described in Tiessen and Moir (1993), the normality of the color reagent for the Alpkem was adjusted to create the desired acidity at the detector for each separate P fraction. Tests showed no significant differences between this analytical method and the traditional, more time-consuming hand titration approach.
6. Data Access:
This data is available through the Oak Ridge National Laboratory (ORNL) Distributed Active Archive Center (DAAC).
Data Archive Center:
Contact for Data Center Access Information:
E-mail: uso@daac.ornl.gov
Telephone: +1 (865) 241-3952
7. References:
Asner, G.P., Townsend, A.R., and Bustamante, M.M.C. 1999. Spectrometry of pasture condition and biogeochemistry in the Central Amazon. Geophysical Research Letters 26(17): 2769-2772.
Tiessen, H. and J. O. Moir. Characterization of available P by sequential extraction. In M. R. Carter, (Ed.), Soil Sampling and Methods of Analysis. Boca Raton, Lewis Publishers. 1993.
Townsend, A.R., G.P. Asner, C.C. Cleveland, M.E. Lefer, and M.M.C. Bustamante. (2002) 37. Journal of Geophysical Research-Atmospheres 107(D20).
Veldkamp, E., Organic carbon turnover in three tropical soils under pasture after deforestation, Soil Sci. Soc. Am. J., 58, 175-180, 1994.
Related Publication
- Asner, G.P., A.R. Townsend, M.M.C. Bustamante, G.B. Nardoto, and L.P. Olander. (2004) Pasture degradation in the central Amazon: linking changes in carbon and nutrient cycling with remote sensing. Global Change Biology 10(5):844-862.