Get Data
Summary:
This data set provides a time series of land cover classifications for Ariquemes, Ji-Parana, and Luiza, research sites in Rondonia, Brazil. The land cover classifications are derived from the Landsat Multispectral Scanner (MSS), Thematic Mapper (TM), and Enhanced Thematic Mapper Plus (ETM+) sensors. The time period ranges from June 1975 through June 2000, but all areas do not have images for all the years.
The images were classified into the following categories: 1. Primary upland forest, representing the dominant natural vegetation in the area; 2. Pasture and green pasture; 3. Second growth, dominated by small trees and shrubs with low species diversity and biomass relative to primary forest; 4. Soil/urban; 5. Rock/savanna; 6. Water; and 7. Cloud or smoke obscured. In addition, areas covered by rock and savanna were mapped and all areas outside of the overlap zone between all dates within a scene, and scene edges, were masked.
There are 75 GeoTIFF files (.tif) with this data set which includes: classified images (*ful.tif) and a corresponding image mask (*ful_mask .tif) for each date (with the exception of 1978 and 1996 images for Ji-Parana, for which there are only ful_mask.tif files), and three mask files for rock, savannah, and scene edges, for each area. By area, there are 31 images for Ariquemes, 23 images for Ji-Parana, and 21 images for Luiza.
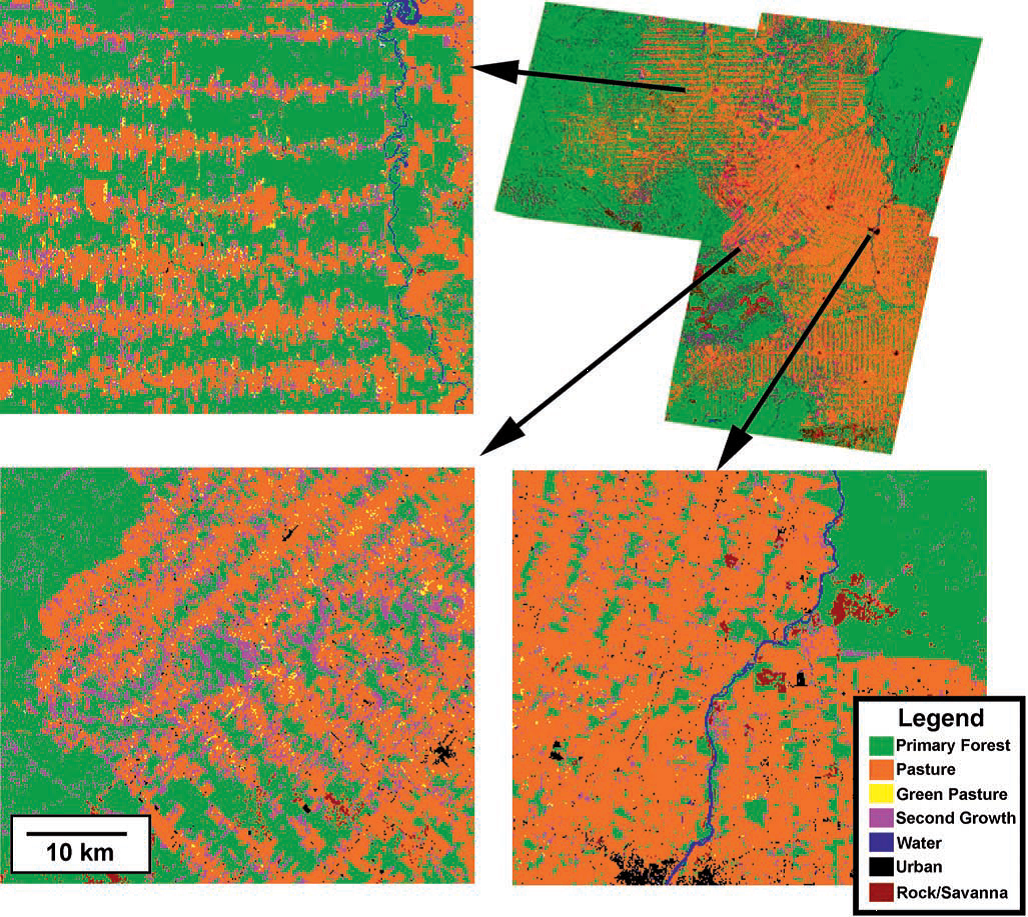
Figure 1. Map showing the seven categories mapped for Ariquemes (1998), Ji-Parana (1999), and Luiza (1999). 1999 Ariquemes data were excluded from this mosaic due to extensive cloud contamination. A mosaic of the three scenes is shown in the upper right corner. Three regions are expanded, one located in southern Ji-Parana´ (lower right), one in northwestern Luiza (lower left), and one in northeastern Ariquemes (upper left). The insets illustrate a region of old, dense land clearing (Ji- Parana), new dense land clearing (Luiza), and old, low density land clearing (Ariquemes) (Roberts et al., 2002).
Data Citation:
Cite this data set as follows:
Roberts, D.A., I. Numata, K.W. Holmes, G.T. Batista, T. Krug, A.L. Monteiro, B. Powell, and O.A. Chadwick. 2014. LBA-ECO ND-01 Land Cover Classification, Rondonia, Brazil: 1975-2000. Data set. Available on-line (http://daac.ornl.gov) from Oak Ridge National Laboratory Distributed Active Archive Center, Oak Ridge, Tennessee, USA. http://dx.doi.org/10.3334/ORNLDAAC/1259
Implementation of the LBA Data and Publication Policy by Data Users:
The LBA Data and Publication Policy [http://daac.ornl.gov/LBA/lba_data_policy.html] is in effect for a period of five (5) years from the date of archiving and should be followed by data users who have obtained LBA data sets from the ORNL DAAC. Users who download LBA data in the five years after data have been archived must contact the investigators who collected the data, per provisions 6 and 7 in the Policy.
This data set was archived in November of 2014. Users who download the data between November 2014 and October 2019 must comply with the LBA Data and Publication Policy.
Data users should use the Investigator contact information in this document to communicate with the data provider.
Data users should use the Data Set Citation and other applicable references provided in this document to acknowledge use of the data.
Table of Contents:
- 1 Data Set Overview
- 2 Data Description
- 3 Applications and Derivation
- 4 Quality Assessment
- 5 Acquisition Materials and Methods
- 6 Data Access
- 7 References
1. Data Set Overview:
Project: LBA (Large-Scale Biosphere-Atmosphere Experiment in the Amazon)
Activity: LBA-ECO
LBA Science Component: Land Use and Land Cover
Team ID: ND-01 (Chadwick / Roberts / Batista)
TThe investigators were Chadwick, Oliver A.; Roberts, Dar A.; Batista, Getulio T.; Biggs, Trent W.; Gessler, Paul E.; Holmes, Karen W. and Tomasella, Javier. You may contact Roberts, Dar A. (dar@geog.ucsb.edu).
LBA Data Set Inventory ID: ND01_Land_Cover_Maps
This data set provides a time series of land cover classifications for Ariquemes, Ji-Parana, and Luiza, research sites in Rondonia, Brazil. The land cover classifications are derived from the Landsat Multispectral Scanner (MSS), Thematic Mapper (TM), and Enhanced Thematic Mapper Plus (ETM+) sensors. The time period ranges from June 1975 through June 2000, but all areas do not have images for all the years.
The images were classified into the following categories: 1. Primary upland forest, representing the dominant natural vegetation in the area; 2. Pasture and green pasture; 3. Second growth, dominated by small trees and shrubs with low species diversity and biomass relative to primary forest; 4. Soil/urban; 5. Rock/savanna; 6. Water; and 7. Cloud or smoke obscured. In addition, areas covered by rock and savanna were mapped and all areas outside of the overlap zone between all dates within a scene, and scene edges, were masked.
Related Data Sets:
- LBA-ECO ND-01 Fractional Land Cover Images, Rondonia, Brazil: 1984-2000 (Land cover classification maps for the five sites)
- LBA-ECO ND-01 Landsat 28.5-m Land Cover Time Series, Rondonia, Brazil: 1984-2010 (land cover time series derived from Landsat Images for Rondonia, Brazil)
- LBA-ECO ND-01 Georegistered Landsat Imagery for Rondonia, Brazil: 1975-2000
2. Data Characteristics:
There are 75 GeoTIFF images (.tif) with this data set. Landsat scene locations classified in this study (with the corresponding Landsat path/row) include Ariquemes (P232, R67), Ji-parana (P231, R67), and Luiza (P231, R68). There were several acquisition dates for each scene covering the time period 1975 - 2000. Because of a paucity of digital Landsat MSS imagery only two scenes from the 1970s were classified, a 1975 scene from Ariquemes and a 1978 scene from Ji-Parana.
For each date, there is a classified image (*ful.tif) and a corresponding image (*ful_mask .tif) with the three masks applied for rock/savanna, water, and edge. There are exceptions for Ji-Parana, where for 1978 and 1996 images there are only *ful_mask.tif files. There are 31 images for Ariquemes, 23 images for Ji-Parana, and 21 images for Luiza. This includes the rock/savanna, water, and edge masks for each area (all three masks per area).
File naming convention:
The files are named according to the following:
For the classified images, the two letter abbreviation of the site, followed by the acquisition date (YYMMDD), and either .ful_mask.tif, or ful.tif.
Example file names for Ariquemes:
ar991016.ful_mask.tif and ar991016.ful.tif
The nine mask files (three for each area) are named by the two letter abbreviation of the site, followed by the acqusition date (note_the date could be YYMMDD, YY, or YY-YY denoting the range for the scenes) and-water, -savannah, or - edge.mask.tif.
Example file names for the Ariquemes area:
ar000628-water.mask.tif: water mask for Ariquemes for June 28, 2000
ar75-edge.mask.tif: edge mask for Ariquemes denoting the first acquisition year of
1975.
Mapped Classes:
Classes mapped in the *ful_mask.tif files.
1 = rock
2 = upland forest
3 =
pasture
4 = green pasture
5 = second growth forest
6 = water
7 = bare
soil/urban
8 = burn (Can be merged with pasture and green pasture)
10 = cloud
55 =
rock/Savanna; mapped separately
255 = background
Classes mapped in the *ful.tif files.
1 = rock
2 = upland forest
3 =
pasture
4 = green pasture
5 = second growth forest
6 = water
7 = bare
soil/urban
8 = burn (also appears as background)
10 = cloud
Table 1. Landsat MSS and TM scene dates for the three sites
| Year | Ariquemes | Ji Parana | Luiza | Type: MSS or TM |
|---|---|---|---|---|
| 1975 | 19750619 | MSS | ||
| 1978 | 197808x | MSS | ||
| 1984 | 19840624 | TM | ||
| 1986 | 19861013 | 19861013 | TM | |
| 1988 | 19880721 | 19880730 | 19880730 | TM |
| 1989 | 19890724 | 19890802 | 19890802 | TM |
| 1990 | 19900812 | 19900805 | 19900805 | TM |
| 1991 | 19910612 | TM | ||
| 1992 | 19920622 | 19920725 | TM | |
| 1993 | 19931007 | 19930728 | TM | |
| 1994 | 19940604 | TM | ||
| 1995 | 19950725 | 19950803 | TM | |
| 1996 | 19960711 | 19960720 19960922 |
19960720 | TM |
| 1997 | 19970628 | 19970621 | 19970723 | TM |
| 1998 | 19980717 | 19980608 | TM | |
| 1999 | 19991016 | 19990806 | 19990806 | ETM+ |
Spatial Data Properties
All GeoTIFF files for this data set have the same basic Spatial Data Properties. The row/column and spatial extent differences are listed below for the full extent of each of the three areas.
Spatial Representation Type: Raster
Pixel Depth: 8 bit
Compression Type: LZW
Number
of Bands: 1
Band Information: Landsat Band
Raster Format: TIFF
Source Type:
continuous
Pixel Type: unsigned integer
No Data Value: none
Ariquemes (Landsat Path 232, Row 67)
Number Columns: 7881
Column Resolution: 30 m
Number Rows: 7368
Row Resolution: 30 m
Extent in the item's coordinate system
North: 8990040.915
South: 8769000.915
West: 309476.996
East: 545906.996
Cell geometry: area
Point in pixel: center
Jiparana (Landsat Path 231, Row 67)
Number Columns: 7877
Column Resolution: 30 m
Number Rows: 7373
Row Resolution: 30 m
Extent in the item's coordinate system
North: 8990876.700
South: 8769686.700
West: 479838.600
East: 716148.600
Cell geometry: area
Point in pixel: center
Cell geometry: area
Point in pixel: center
Luiza (Landsat Path 231, Row 68)
Number Columns: 7818
Column Resolution: 30 m
Number Rows: 7365
Row Resolution: 30 m
Extent in the item's coordinate system
North: 8830071.600
South: 8609121.600
West: 446225.000
East: 680765.000
Cell geometry: area
Point in pixel: center
Spatial Reference Properties
The spatial reference information is the same for each tif file.
Type: Projected
Geographic
Coordinate Reference: GCS_SAD69
Projection: UTM_Zone_20_Southern_Hemisphere
Open Geospatial Consortium (OGC) Well Known Text (WKT)
PROJCS["UTM_Zone_20_Southern_Hemisphere",
GEOGCS["GCS_SAD69",
DATUM["D_South_American_1969",
SPHEROID["GRS_1967",6378160.0,298.2471674269971]],
PRIMEM["Greenwich",0.0],
UNIT["Degree",0.0174532925199433]],
PROJECTION["Transverse_Mercator"],
PARAMETER["false_easting",500000.0],
PARAMETER["false_northing",10000000.0],
PARAMETER["central_meridian",-63.0],
PARAMETER["scale_factor",0.9996],
PARAMETER["latitude_of_origin",0.0],
UNIT["Meter",1.0]]
Notes:
1. One file provided by the PI was corrupt and is not included in this data set: ji78.ful.recls
2. All *.ful.tif files have “fill” or “background” values equal to 8. A number of additional files in the
*.ful.tif files have edge values that are not consistent with background values.
3. The *.ful_mask
files are inconsistent in the application of the accompanying water and savanna mask files.
4. The
water mask file for the Ariquemes region, ar000628-water.mask.tif, had a read line error at line 7358. The data
provided here, therefore, has 10 fewer lines of data.
Site boundaries: (All latitude and longitude given in decimal degrees)
| Site (Region) | Westernmost Longitude | Easternmost Longitude | Northernmost Latitude | Southernmost Latitude | Geodetic Datum |
|---|---|---|---|---|---|
| Rondonia - Ariquemes (Rondonia) | -64.64056 | -62.69722 | -9.18083 | -11.07528 | South-American Datum, 1969 (SAD-69) |
| Rondonia - Ji Parana (Rondonia) | -63.06833 | -61.18167 | -9.36861 | -10.93583 | South-American Datum, 1969 (SAD-69) |
| Rondonia - Luiza (Rondonia) | -63.40667 | -61.48278 | -10.6975 | -12.43111 | South-American Datum, 1969 (SAD-69) |
Time period:
- The data set covers the period 1975/06/19 to 2000/06/28.
- Temporal Resolution: Multiple scenes are available at every site at erratic intervals. See table provided for dates available for each site.
Platform/Sensor/Parameters measured include:
- LANDSAT-5 (LAND REMOTE-SENSING SATELLITE-5) / LANDSAT TM (LANDSAT THEMATIC MAPPER) / VISIBLE IMAGERY
- LANDSAT-5 (LAND REMOTE-SENSING SATELLITE-5) / LANDSAT ETM+ / VISIBLE IMAGERY
- LANDSAT-5 (LAND REMOTE-SENSING SATELLITE-5) / LANDSAT TM (LANDSAT THEMATIC MAPPER) / INFRARED IMAGERY
- LANDSAT-2 (LAND REMOTE-SENSING SATELLITE-2) / MSS (MULTISPECTRAL SCANNER) / VISIBLE IMAGERY
- LANDSAT-2 (LAND REMOTE-SENSING SATELLITE-2) / MSS (MULTISPECTRAL SCANNER) / INFRARED IMAGERY
3. Data Application and Derivation:
By comparing the spatial extent of primary forest between dates, it is possible to estimate rates of deforestation.
4. Quality Assessment:
Accuracy of the classified map was assessed using digital airborne videography acquired over Rondonia in June 1999. After combining all of the nonforested classes (except water), overall accuracy was 93.8% with a kappa of 0.894.
5. Data Acquisition Materials and Methods:
Site description
This study was conducted over an area of approximately 80,000 km2 located in central Rondonia consisting of three Landsat scenes. These three scenes provided a gradient in deforestation rates and pasture ages from low rates and young pastures in Ariquemes to higher initial deforestation rates and older pastures in Ji-Parana and Luiza. Elevations in the area range from 100 to 1,000 m. Annual rainfall averages 1,930 to 2,690 mm/year. Natural vegetation is dominated by dense tropical forests with locally abundant savanna, transitional forest and infrequent patches of more open, shorter forests (RADAMBRASIL, 1978). Anthropogenic land-cover includes pastures, second-growth forest (Capoeira), annual crops (maize, beans, upland rice), perennial crops (cacao, coffee, banana), bare soil and urbanized areas (Browder, 1994). Government regulated development by the Instituto Nacional de Colonizacao e Reforma Agraria (INCRA) and Forest Reserves and Indigenous lands constitute the largest proportion of land within the three areas.
Methods
Thirty two Landsat TM/ETM scenes and two Landsat MSS scenes (Landsat MSS data were originally obtained from Woods Hole Research Center, Woods Hole, Massachusetts. Landsat TM data were obtained from various sources, including INPE) were assembled into a comprehensive time series for three contiguous areas: Ariquemes (P232, R67), Ji-Parana (P231, R67) and Luiza (P231, R68). Because of a paucity of digital Landsat MSS from the 1970s, only two early scenes were included, a 1975 scene from Ariquemes and a 1978 scene from Ji-Parana. The images were classified into the following categories: 1. Primary upland forest, representing the dominant natural vegetation in the area, categorized as dense tropical forest (RADAMBRASIL, 1978). 2. Pasture and green pasture, dominated by several pasture grass species (Brachiaria brizantha and Panicum maximum) and ranging in quality from highly degraded to well-managed green pastures. Green pasture is included to account for well managed pastures that tend to remain productive throughout much of the dry season and pastures that are not senesced in early dry season images acquired in June. Recent burn scars are classified as pasture. 3. Second growth, dominated by small trees and shrubs with low species diversity and biomass relative to primary forest. Second growth may follow pasture after abandonment, or primary forest after anthropogenic or natural disturbance. 4. Soil/urban. 5. Rock/savanna. Rock is most abundant in areas of high topographic relief while Savanna is commonly located in close proximity to wetlands. 6. Water. 7. Cloud or smoke obscured (Roberts et al., 2002).
Land-cover change was mapped using a multistage process described by Roberts et al. (1998):
Image End-Member Selection- Using spectral mixture analysis, a spectrum consisting of radiance reflected off of multiple materials within the field of view was decomposed into fractions of several unmixed spectra, called end-members (Adams et al., 1993). Initial candidates for green vegetation (GV), Nonphotosynthetic vegetation (NPV, stems, branches and litter), soil and shade were selected from the image then evaluated based on the fit (measured by a Root Means Squared Error (RMS)) and fraction images. The final product was five images, one for each end-member and a RMS image.
Reflectance Retrieval- Because of the diversity of data sources and lack of consistency in radiometric calibration, we used the modified empirical line approach described by Smith et al. (1990). Using this technique, encoded radiance was regressed against laboratory and field measured reflectance from soils, water and NPV collected in Rondonia and Manaus between 1991 and 1992. Candidate models for converting encoded radiance to reflectance were assessed based on the shape of the intercept term (which should resemble a path radiance spectrum) and retrieved surface reflectance, which must be physically reasonable (i.e., nonnegative) and match expected reflectance for known targets in the image, such as water. Spectra measured using the Airborne Visible Infrared Imaging Spectrometer of broadleaf deciduous and broadleaf evergreen forests in North America were used as spectral proxies for vegetation because no canopy level spectra were available for Brazilian forests covering the full spectral range of Landsat TM.
Reference End-Member Selection- Reference end-members are spectra of known materials (Adams et al., 1993). Ideally, an image end-member can be represented as a mixture of one or more spectrally pure, identifiable reference end-members. Reference end-members were selected from the same spectral library used to retrieve surface reflectance.
Intercalibration- Following step three, the remaining data sets were standardized to the reference scene using relative radiometric calibration techniques (Schott et al., 1988; Hall et al., 1991).
Spectral Mixture Analysis- After the entire time serieswas intercalibrated and reference end-members selected, the same model was applied to the entire data set. This generated four fraction images for each scene (GV, NPV, soil and shade) and a RMS error image. Since each data set was standardized to a common reference and spectral library, spectral fractions were compared directly between different scenes and across the entire time series.
Decision Tree Training and Classification- Spectral fractions and the RMS error images were used to train a decision tree classifier (DTC) (Hess et al., 1995; Friedl and Brodley, 1997; Roberts et al., 1998). The DTC was trained by extracting at least 100 samples for 6 of the 7 classes mapped. The Landsat MSS was also classified using a DTC, but was not subjected to spectral mixture analysis.
Reclassification and Spatial Filtering- Disallowed transitions represent any transition that is not physically reasonable such as a transitions from second growth or pasture to primary forest over a span of a few years (Roberts et al., 1998). Disallowed transitions can be screened by identifying them through time series, then reassigning the class of one of the pixels. In this research, simple rules were used to remove disallowed transitions by comparing three temporally contiguous dates and reclassifying pixels using the temporal median.
Savanna/Rock Mask, Edge Mask
Areas covered by rock and savanna were mapped and all areas outside of the overlap zone between all dates within a scene were masked. A rock/savanna mask became necessary because these two land-cover types are difficult to separate from pasture with sufficient accuracy. To map rock/savanna, a mask was developed for each scene then applied to the full time series for each scene. For Ariquemes and Ji- Parana, the mask was formed by merging all nonforest classes in the MSS data, then manually editing the pastures and second growth from the mask. Because of the relatively low amount of pasture and second growth in the 1970s and their concentration along BR364, manual editing could be accomplished quickly. The rock/savanna mask for Luiza was generated from the 1986 TM scene using a similar approach, but required considerably more editing due to the greater extent of pasture and second growth. Edges were masked by determining the minimum area overlap for each scene within the time series and assigning all areas outside of the area of overlap to no-class (Roberts et al., 2002).
6. Data Access:
This data set is available through the Oak Ridge National Laboratory (ORNL) Distributed Active Archive Center (DAAC).
Data Archive Center:
E-mail: uso@daac.ornl.gov
Telephone: +1 (865) 241-3952
7. References:
Adams, J. B., M. O. Smith, and A. R. Gillespie, Imaging spectroscopy: Interpretation based on spectral mixture analysis, in Remote Geochemical Analysis: Elemental and Mineralogical Composition, edited by C. M. Pieters and P. Englert, pp. 145– 166, Cambridge Univ. Press., New York, 1993.
Browder, J. O., Surviving in Rondonia: The dynamics of colonist farming strategies in Brazil’s northwest frontier, Stud. Comp. Int. Dev., 29(3), 45– 69, 1994.
Friedl, M. A., and C. E. Brodley, Decision tree classification of land cover from remotely sensed data, Remote Sens. Environ., 61, 399–409, 1997.
Hall, F. G., D. E. Strebel, J. E. Nickeson, and S. J. Goetz, Radiometric rectification, toward a common radiometric response among multidate, multisensor images, Remote Sens. Environ., 35, 11– 27, 1991
INPE, 2000. Monitoramento da floresta Amazonica Brasileira por satelite 1998-1999, 22 pp., Inst. Nac. de Pesqui. Espaciais, Sao Jose Dos Campos SP, Brazil.
Hess, L. L., J. M. Melack, S. Filoso, and Y. Wang, Delineation of inundated area and vegetation along the Amazon floodplain with the SIR-C synthetic aperture radar, IEEE Trans. Geosci. Remote Sens., 33(4), 896– 904, 1995.
RADAMBRASIL, Mapa exploratorio de solos, Projeto Radambrasil: Programa de Integrac¸a˜o Nacional, 1:1,000,000, Minist. das Minas e Energ., Dep. Nac. de Prod., Rio de Janeiro, 1978.
Roberts, D.A., I. Numata, K. Holmes, G. Batista, T. Krug, A. Monteiro, B. Powell, and O.A. Chadwick. 2002. Large area mapping of land-cover change in Rondonia using multitemporal spectral mixture analysis and decision tree classifiers. Journal of Geophysical Research-Atmospheres 107(D20): Article-8073.
Roberts, D. A., G. Batista, J. Pereira, E. Waller, and B. Nelson, Change identification using multitemporal spectral mixture analysis: Applications in eastern Amazonia, in Remote Sensing Change Detection: Environmental Monitoring Applications and Methods, edited by C. Elvidge and R. Lunetta, pp. 137– 161, Ann Arbor Press, Chelsea, Mich., 1998.
Schott, J., C. Salvaggio, and W. Volchok, Radiometric scene normalization using pseudoinvariant features, Remote Sens. Environ., 26, 1– 16, 1988.
Smith, M. O., S. L. Ustin, J. B. Adams, and A. R. Gillespie, Vegetation in deserts, I, A regional measure of abundance from multispectral images, Remote Sens. Environ., 31, 1 –26, 1990.