Summary:
This data set provides a 27-year land cover time series of 28.5-m resolution products derived from Landsat images for 80% of Rondonia, Brazil, for the period 1984 to 2010. Selected Landsat Thematic Mapper (TM) and Landsat Multispectral Scanner (MSS) images from the years 1984 through 2010, for seven path/row scenes (PortoVelho, Ariquemes, Jiparana, Luiza (or Urupa), Cacoal, Chapuingaia, and Vilhena) were mosaicked for each year. Each mosaicked image was georectified and classified into seven land-cover classes--savanna/rock, pasture, secondary forest, primary forest, cloud, urban, or water. This 27-year time series allows the long-term assessment of land-cover variation across the state.
There are 27 GeoTIFF image files (.tif) and one accompanying .xml file for each GeoTIFF file, compressed and available as *.zip files. There is one file for each year for the period 1984-2010, with this data set.
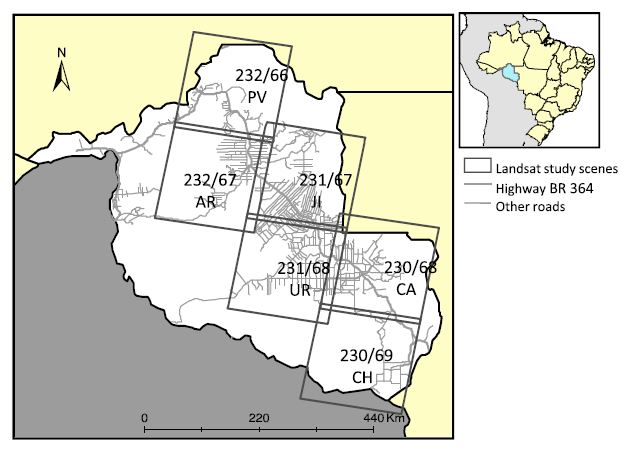
Figure 1. Study region, the state of Rondônia, and six Landsat scenes (path/row) studied: 232/66 (Porto Velho, PV), 232/67 (Ariquemes, AR), 231/67 (Ji‐Parana, JI), 231/68 (Luiza or Urupa, UR), 230/68 (Cacoal, CA), and 230/69 (Chupinguaia, CH). From Numata et al. 2010. The seventh scene, Vilhena, is path/row, 229/69.
Data Citation:
Cite this data set as follows:
Roberts, D.A., M. Toomey, I. Numata, T. Biggs, J. Caviglia-Harris, M. Cochrane, C. Dewes, K.W. Holmes, R.L. Powell, C. Souza and O.A. Chadwick. 2013. LBA-ECO ND-01 Landsat 28.5-m Land Cover Time Series, Rondonia, Brazil: 1984-2010. Data set. Available on-line (http://daac.ornl.gov) from Oak Ridge National Laboratory Distributed Active Archive Center, Oak Ridge, Tennessee, USA http://dx.doi.org/10.3334/ORNLDAAC/1165
Implementation of the LBA Data and Publication Policy by Data Users:
The LBA Data and Publication Policy (http://daac.ornl.gov/LBA/lba_data_policy.html)is in effect for a period of five (5) years from the date of archiving and should be followed by data users who have obtained LBA data sets from the ORNL DAAC. Users who download LBA data in the five years after data have been archived must contact the investigators who collected the data, per provisions 6 and 7 in the Policy.
This data set was archived in June 2013. Users who download the data between June 2013 and May 2018 must comply with the LBA Data and Publication Policy.
Data users should use the investigator contact information in this document to communicate with the data provider.
Data users should use the Data Set Citation and other applicable references provided in this document to acknowledge use of the data.
Table of Contents:
- 1 Data Set Overview
- 2 Data Characteristics
- 3 Applications and Derivation
- 4 Quality Assessment
- 5 Acquisition Materials and Methods
- 6 Data Access
- 7 References
1. Data Set Overview:
Project: LBA (Large-Scale Biosphere-Atmosphere Experiment in the Amazon)
Activity: LBA-ECO
LBA Science Component: Land Use and Land Cover
Team ID: ND-01 (Chadwick / Roberts / Batista)
The investigators were Chadwick, Oliver A.; Roberts, Dar A.; Batista, Getulio T.; Biggs, Trent W.; Gessler, Paul E.; Holmes, Karen W.; Tomasella, Javier; Numata, Izaya; Cochrane, Mark; Souza, Carlos; Dewes, Candida; Toomey, Michael and Caviglia-Harris, Jill. You may contact Roberts, Dar A. (dar@geog.ucsb.edu).
LBA Data Set Inventory ID: ND01_Georectified_Products
This data set provides a 27-year land cover time series of 28.5-m resolution products derived from Landsat images for 80% of Rondonia, Brazil, for the period 1984 to 2010. Selected Landsat Thematic Mapper (TM) and Landsat Multispectral Scanner (MSS) images from the years 1984 through 2010, for seven path/row scenes (PortoVelho, Ariquemes, Jiparana, Luiza (or Urupa), Cacoal, Chapuingaia, and Vilhena), were mosaicked for each year. Each mosaicked image was georectified and classified into seven land-cover classes--savanna/rock, pasture, secondary forest, primary forest, cloud, urban, or water. This 27-year time series allows the long-term assessment of land-cover variation across the state.
Related Data Sets:
- LBA-ECO ND-01 Streamwater and Watershed Characteristics, Rondonia, Brazil: 1998-1999 (Watershed (characteristics and deforestation for the same region for 1998-1999)
- LBA-ECO ND-01 Watershed Deforestation from Landsat TM Series, Rondonia, Brazil: 1999 (Deforestation study for the same area from Landsat TM and SRTM DEM analysis)
2. Data Characteristics:
There are 27 time series mosaics of derived land cover classifications for the years 1984-2010. Data are presented as 27 GeoTIFF image files (.tif) compressed and available as *.zip files, and when expanded, are named as rondonia_YYYY_landcover_pheno.tif, with YYYY indicating the image year. There is also one accompanying .xml file for each GeoTIFF file.
Each image is a mosaic file of Landsat scenes covering PortoVelho, Ariquemes, Jiparana, Luiza, Cacoal, Chapuingaia, and Vilhena (about 80% of the state of Rondonia).
Each file contains the projection information listed below:
Projected Coordinate System: WGS_1984_UTM_Zone_20S
Projection: Transverse_Mercator
False_Easting: 500000.00000000
False_Northing: 10000000.00000000
Central_Meridian: -63.00000000
Scale_Factor: 0.99960000
Latitude_Of_Origin: 0.00000000
Linear Unit: Meter
Geographic Coordinate System: GCS_WGS_1984, Datum: D_WGS_1984
Prime Meridian: Greenwich
Angular Unit: Degree
The following classification values are provided in the 27 .xml files (1 for each .tif file):
| Value | Description |
|---|---|
| 0 | Unclassified |
| 1 | Rock/savanna |
| 2 | Forest |
| 3 | Pasture |
| 4 | Green pasture |
| 5 | Second growth forest |
| 6 | Water |
| 7 | Urban/soil |
| 8 | Burn |
| 9 | Cloud |
Site boundaries for the seven areas of Rondonia included in the mosaics: (All latitude and longitude given in decimal degrees)
| Site (Region) | Westernmost Longitude | Easternmost Longitude | Northernmost Latitude | Southernmost Latitude | Geodetic Datum | Landsat Path/Row |
|---|---|---|---|---|---|---|
| Rondonia - Ariquemes (Rondonia) | -64.59498 | -62.76161 | -9.289669 | -10.96573 | World Geodetic System, 1984 (WGS-84) | 232/67 |
| Rondonia - Ji Parana (Rondonia) | -63.06878 | -61.1973 | -9.251214 | -10.98973 | World Geodetic System, 1984 (WGS-84) | 231/67 |
| Rondonia - Luiza (Rondonia) | -63.34904 | -61.53028 | -10.71055 | -12.33542 | World Geodetic System, 1984 (WGS-84) | 231/68 |
| Rondonia - Cacoal (Rondonia) | -61.8742 | -59.96793 | -10.73336 | -12.43054 | World Geodetic System, 1984 (WGS-84) | 230/68 |
| Rondonia - Vilhena (Rondonia) | -60.6406 | -58.79537 | -12.15248 | -13.86198 | World Geodetic System, 1984 (WGS-84) | 229/69 |
| Rondonia - Portovelho (Rondonia) | -64.28366 | -62.44801 | -7.827244 | -9.519853 | World Geodetic System, 1984 (WGS-84) | 232/66 |
| Rondonia- Chupinguaia (Rondonia) | -60.34098 | -61.8742 | -12.20189 | -13.80061 | World Geodetic System, 1984 (WGS-84) | 230/69 |
Time period:
- The data set covers the period 1984/06/24 to 2010/07/29.
- Temporal resolution: annual
Platform/Sensor/Parameters measured include:
- LANDSAT-5 / LANDSAT TM (LANDSAT THEMATIC MAPPER) / LAND COVER
- LANDSAT-5 / LANDSAT MSS / LAND COVER
3. Data Application and Derivation:
This 27 year time series can be used to determine rates of deforestation, changes in forest area as well as forest edge, and spatial and temporal patterns in land-cover for the area.
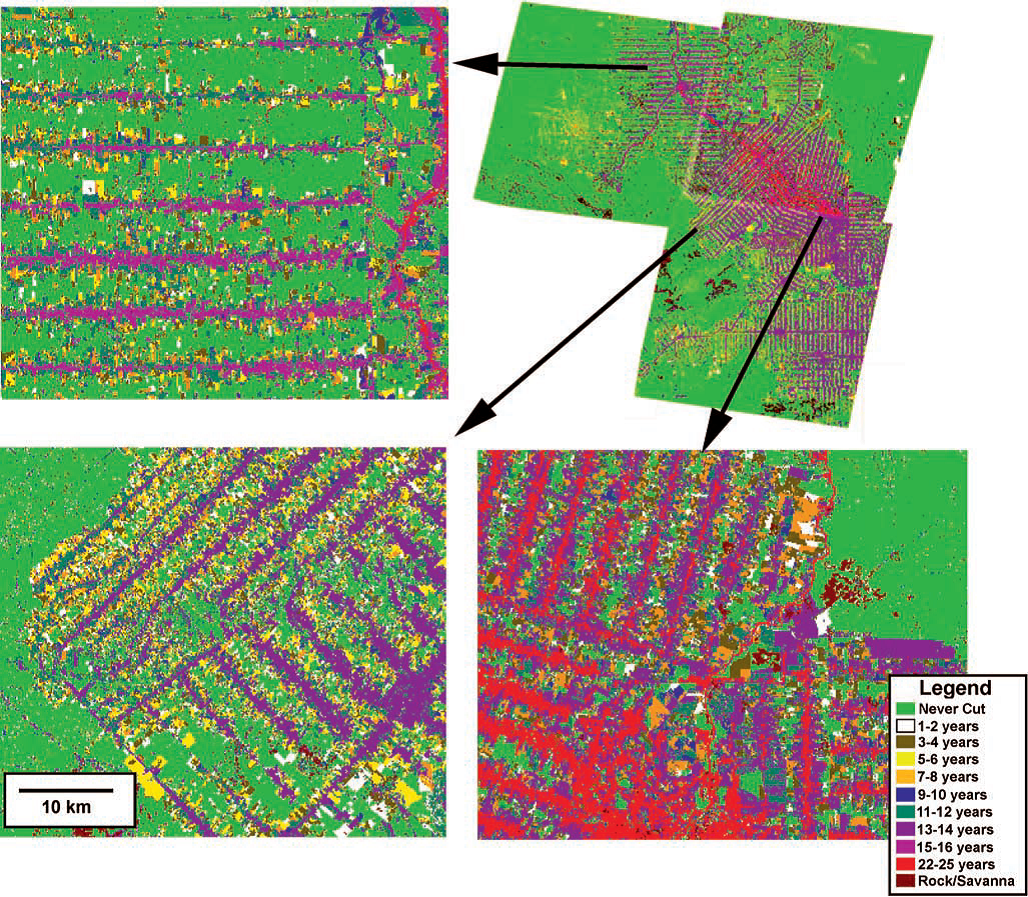
Figure 2. Map showing age since initial cut for the three scenes. Several age classes have been combined to improve the clarity of the figure (Roberts et al., 2002)
4. Quality Assessment:
Classified Map Accuracy:
Overall accuracy for the seven classes was calculated as 85.4% with a kappa coefficient of 0.761. Rock, savanna, water, soil, and urban classes were rarely encountered in the videography and thus have insufficient samples to assess accuracy of these classes. Second growth slightly exceeded a minimum standard of 19 samples (Richards, 1999), while pasture and primary forest were well represented.
Producers accuracy, defined as the proportion of reference points mapped correctly by the classifier, ranged from highs of 90% for pasture and 89.7% for mature forest to a low of 55% in second growth.
Users accuracy, defined as a measure of the proportion of pixels that are correctly classified to the total number mapped by the classifier, was 98.1%, 85.7%, and 39.3% for mature forest, pasture and second growth. Confusion was greatest between second growth and mature forest. Detailed analysis of these samples showed that confusion occurred primarily in areas of rugged topography on sun-facing slopes where decreased shade resulted in the decision tree classifier interpreting these areas as second growth. The second most significant source of error was in discriminating second growth from pasture, accounting for the largest error in mapping second-growth reference sites. Overall, second growth was overmapped relative to the other classes, primarily due to errors on sunlit slopes.
Full Mosaic Accuracy Assessment (1984 to 2010 product):
A second round of accuracy was assessed using Google Earth imagery. This accuracy was applied to the revised land-cover product, in which the sunlit slope error was corrected (see below). Representative samples of each class were identified in Google Earth imagery acquired closest to 2009, the reference year used for accuracy assessment (see list below). A total of 267 polygons were identified, sampling a total of more than 250,000 pixels. Of these, 500 pixels were selected randomly for each class, resulting in 2,812 samples. Some of the pixels were thrown out because they were assessed to be poor samples based on the Google Earth imagery.
List of the number of polygons, pixels, and randomly sampled pixels for each class:
| Class | Polygons | Pixels | Samples |
|---|---|---|---|
| Burn | 62 | 7817 | 444 |
| Urban/Soils | 43 | 5176 | 469 |
| Pasture | 68 | 22479 | 499 |
| Mature Forest | 29 | 145919 | 500 |
| Secondary Forest | 53 | 8363 | 402 |
| Water | 12 | 67201 | 498 |
An error matrix was created comparing reference (Google Earth) to mapped (mosaic) land-cover. Samples ranged between 402 and 500 pixels per class. Using this approach, overall accuracy of the mosaic was assessed as 90.54% with a kappa coefficient of 0.866. The most significant confusion was observed between burn and pasture. However, it should be noted that burned areas are typically pastures, so these would normally be considered the same class. It should also be noted, that the mosaic submitted has not been corrected for phenological errors, in which some early dry season pastures are misclassified as secondary forest. Thus, when interpreting an early dry season image, some of the transitions to secondary forest are likely to be incorrect.
5. Data Acquisition Materials and Methods:
Site:
The Brazilian state of Rondonia lies in the southwestern Amazon Basin on the border with Bolivia. Closed-and open-canopy tropical rainforest dominate the original vegetation cover (RADAMBRASIL, 1978). Large-scale colonization of Rondonia began with the construction of the BR-364 highway in the late 1960s (Goza, 1994). The population reached 1.3 million people by the year 2000, and approximately 53,000 km2 (25%) of the forest was cleared for cropping and pasture by 1993 (Pedlowski et al., 1997). Land in Rondonia has been zoned for different uses, including agriculture (51% of the state's area); extraction of forest products such as nuts, rubber, fruit, and limited selective logging (14%), and protection of forest for indigenous peoples, parks, and biological reserves (35%). The main agricultural corridor accounted for 99% of the area zoned for agriculture in Rondonia in 1999. The corridor consists of one contiguous block of land that encompasses 117,940 km2, extends approximately 600 km along highway BR-364 at a width of 115-300 km, and runs perpendicular to the highway. The 35 protected areas in the state border the agricultural zone on both sides and encompass 83,000 km2. Ninety percent of the protected area occurs in seven separate zones between 2,150 and 42,000 km2.
Production of Mosaics:
Landsat scenes were assembled into a comprehensive time series mosaic including seven Landsat scenes acquired between 1984 and 2010. In total 189 Landsat scenes were processed to produce mosaics for all 27 years. Landsat data were initially coregistered to 1998 or 1999 georectified digital PRODES data supplied by the Instituto Nacional de Pesquisas Espaciais (INPE, 2000) and were georectified using between 30 and 40 tie points and rubber sheet stretching. All images were resampled using nearest neighbor resampling.
The spatial accuracy of this product was assessed in the field and found to have some minor errors. To correct this, all subsequent data sets were georectified to Geocover (http://glcf.umiacs.umd.edu/research/portal/geocover/) using the following general procedure:
- ERDAS Imagine AutoSync was used to warp the near-infrared (NIR) band of the input image to the Geocover base map NIR band. We used a second order polynomial fitting. This would generally generate 1000+ points.
- These 1,000 points were subsequently pared down to a 15x15 regular grid using a script that selected the ground control points (GCP) within the grid cell with the lowest Root Means Squared Error (RMSE) (225 points in all).
- In rare instances, AutoSync failed to produce adequate points, ~ 50 GCPs were manually selected.
- To ensure that all data sets were warped to a common base map, the older 1990s PRODES-based products were rewarped to Geocover using the same general procedure.
Image Classification:
Images were classified into seven categories:
1. Primary upland forest, representing the dominant natural vegetation in the area, categorized as dense tropical forest (RADAMBRASIL, 1978).
2. Pasture and green pasture, dominated by several pasture grass species (Brachiaria brizantha and Panicum maximum) and ranging in quality from highly degraded to well-managed green pastures. Recent burn scars are classified as pasture.
3. Second growth, dominated by small trees and shrubs with low species diversity and biomass relative to primary forest. Second growth may follow pasture after abandonment, or after anthropogenic or natural disturbance of primary forest.
4. Soil/urban.
5. Rock/savanna. Rock is most abundant in areas of high topographic relief, while savanna is commonly located in close proximity to wetlands.
6. Water.
7. Cloud obscured, including smoke from burning, clouds and cloud shadows.
Land-cover change was mapped using a multistage process described by Roberts et al. (1998, 2002):
1. Using spectral mixture analysis, a spectrum consisting of radiance
reflected off of multiple materials within the field of view is
decomposed into fractions of several unmixed spectra, called end-members
(Adams et al., 1993). Initial candidates for green vegetation (GV),
non-photosynthetic vegetation (NPV, stems, branches and litter), soil
and shade are selected from the image and then evaluated based on the fit
(measured by an RMSE) and fraction images. If
necessary, image endmembers are revised to improve the fit and reduce
fraction errors (physically unrealistic fractions) (Adams et al., 1993).
The final product is five images, one for each end-member and an RMSE
image.
2.Encoded radiance is converted to apparent surface reflectance
through absolute calibration (Kaufman, 1989) or relative reflectance retrievals
(Elvidge and Portigal, 1990) to identify surface materials and compare satellite
observations to laboratory or field measured spectra. Because of the
diversity of data sources and lack of consistency in radiometric
calibration, the modified empirical line approach described by
Smith et al. (1990) was used. Using this technique, encoded radiance was
regressed against laboratory and field measured reflectance from soils,
water and NPV collected in Rondonia and Manaus between 1991 and 1992.
Candidate models for converting encoded radiance to reflectance were
assessed based on the shape of the intercept term (which should resemble
a path radiance spectrum) and retrieved surface reflectance, which must
be physically reasonable (i.e., nonnegative) and match expected
reflectance for known targets in the image, such as water. Spectra
measured using the Airborne Visible Infrared Imaging Spectrometer of
broadleaf deciduous and broadleaf evergreen forests in North America
were used as spectral proxies for vegetation because no canopy level
spectra were available for Brazilian forests covering the full spectral
range of Landsat TM. The quality of retrieved surface reflectance for
Rondonia was evaluated by comparison to surface reflectance measured
over similar targets in Manaus, retrieved using multiple ground
reflectance measured in the field during the summer the Manaus Landsat
TM data were acquired.
3. Reference end-members are spectra of known materials
(Adams et al., 1993). Ideally, an image end-member can be represented as
a mixture of one or more spectrally pure, identifiable reference
end-members. When selecting candidate reference end-members for each
image end-member, the objective is to locate library spectra that are
more extreme than the image end-members, provide a good fit (as measured
by RMS) and fractions that match expected values based on field
measurements or aerial photo interpretation (Roberts et al., 1998).
Reference end-members were selected from the same spectral library used
to retrieve surface reflectance.
4. Following step three, remaining data sets are standardized to the reference scene using relative radiometric calibration techniques (Schott et al., 1988; Hall et al., 1991; Furby and Campbell, 2001). In this research, 20 to 30 candidate invariant targets were manually located within each scene then used to convert encoded radiance, as measured on that date, to the equivalent of encoded radiance measured in the reference scene.
Candidate invariant targets, primarily water, forest, second
growth and urban areas, were initially selected by comparing scenes acquired
over the same location over several years. Encoded radiance was extracted
for each target and regressed against encoded radiance measured within the
reference scene. Candidates that are not temporally invariant are readily
identified as outliers in the regression and removed from the analysis.
- One modification (incorporated in the Roberts et al., 2002, process) in the mosaic is the use of the Carlotto (1999) haze correction technique. This technique is based on the assumption that spatially variable haze impacts only TM bands 1 to 3. Whole scene statistics are derived identifying unique combinations of Landsat TM bands 4 to 7 and the associated TM band 1, 2, and 3 values associated with these combinations. Scene averages for TM bands 1 to 3 are calculated for each unique combination of TM bands 4 to 7, then used to replace the original TM values for the first three bands. In essence, this approach homogenizes spatially variable haze across the image. The Carlotto haze correction was applied to only those images with clearly identifiable haze (smoke). After haze correction, the images were then processed through step 4, applying a relative radiometric calibration to the scene.
5. Once the entire time series has been intercalibrated and reference
end-members selected, the same model can applied to the entire data set.
This generates four fraction images for each scene (GV, NPV, soil and
shade) and an RMSE image. Because each data set is standardized to a
common reference and spectral library, spectral fractions can be
compared directly between different scenes and across the entire time
series.
6. Spectral fractions and the RMSE images are used to
train a decision tree classifier (DTC) (Hess et al., 1995; Friedl and
Brodley, 1997; Roberts et al., 1998; 2002). The DTC was trained by
extracting at least 100 samples for six of the seven classes mapped
(Rock/savanna were excluded from the initial training). To capture the
within class variability and temporal variability in training sets,
spectral fractions and RMSE values were extracted from several scenes in
Ariquemes, Ji-Parana, Luiza and PortoVelho that spanned the range of
conditions present across the scenes. Decision rules were determined
using Splus (Clark and Pregibon, 1992). The final set of rules was
derived after several iterations, including initial classification,
followed by several additional stages of training and classification
designed to reduce classification error at each stage.
7. Disallowed transitions represent any transition that is not physically reasonable, such as a transition from second growth or pasture to primary forest over a span of a few years (Roberts et al., 2002). Disallowed transitions can be screened by identifying them through time series, then reassigning the class of one of the pixels. In this research, simple rules were used to remove disallowed transitions by comparing three temporally contiguous dates and reclassifying pixels using the temporal median. Disallowed transitions include: 1)pasture, urban, or second growth to primary forest, and 2) water to any other class but water. This approach is also effective for cloud screening, treating all transitions as disallowed. In the event that two transitions occur in combination with a disallowed transition, the pixel is not reclassified. A transition from pasture to primary forest then second growth is an example of this type of transition, leading to a disallowed transition (pasture to primary forest) remaining in the time series.
To reduce the effect of pixel misregistration, a spatial
filter is applied to classified images prior to time series analysis. In
this research, a median filter was applied along a 3 x 3 moving window, and all pixels
classified as having no more than one neighbor within the same class were
reassigned to the median class within the window.
8. Areas covered by rock and savanna were mapped and all
areas outside of the overlap zone between all dates within a scene were
masked. A rock/savanna mask became necessary because these two
land-cover types are difficult to separate from pasture with sufficient
accuracy. To map rock/ savanna, a mask was developed for each scene then
applied to the full time series for each scene. Edges were masked by
determining the minimum area overlap for each scene within the time
series and assigning all areas outside of the area of overlap to
no-class.
Steps 1 through 8 generate the product described in Roberts et
al., 2002. Subsequently several more steps were added to the processing
to reduce misclassification of mature forest as secondary forest, either
due to sun lit slopes or emergents. This processing involved the following:
9. An image was generated showing all instances in the
time series where a pixel was mapped as secondary forest. This
processing was done independently for each of the seven Landsat scenes
and was used to generate an initial mask of secondary forest.
10.The secondary forest mask was manually edited to remove
all instances in which mature forest was identified incorrectly as
secondary forest. Using a combination of time series images and pattern
analysis, it is possible to identify regions that are clearly secondary
forest, most often due to a regular spatial pattern (i.e., rectangular
shape of patches). Using this approach, the secondary forest mask was
manually edited to remove instances in which areas mapped as secondary
forest, did not have the spatial characteristics of secondary forest (at
any time), and thus were mature forest. One mask was generated for each Landsat scene (seven total).
11. Once a mask was completed for each of the seven scenes, it was applied to each scene in the time series to reset areas misclassified as secondary forest to mature forest. This product was then mosaicked using the ENVI mosaicking tool to generate 27 mosaics for Rondonia, one for each year from 1984 to 2010 consisting of seven Landsat scenes each.
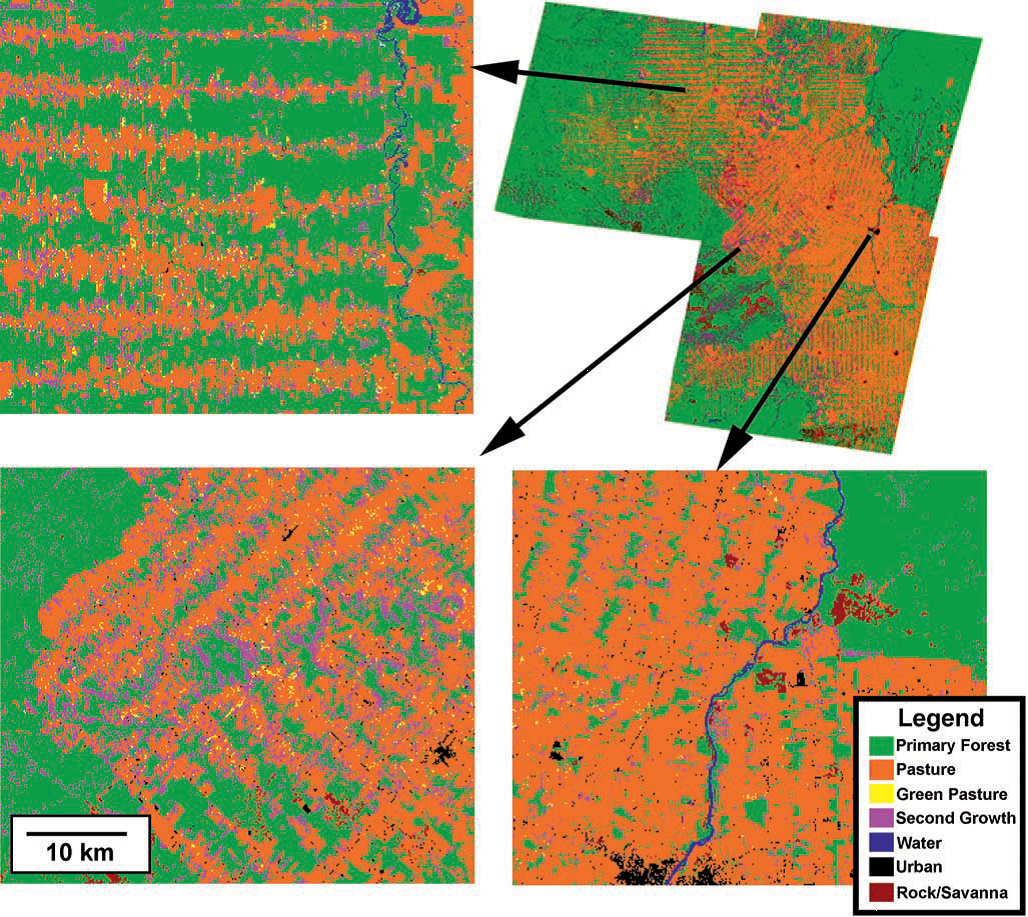
Figure 2. Map showing the seven categories mapped for Ariquemes (1998), Ji-Parana (1999), and Luiza (1999). Ariquemes data from 1999 were excluded from this mosaic due to extensive cloud contamination. A mosaic of the three scenes is shown in the upper right corner. Three regions are expanded, one located in southern Ji-Parana´ (lower right), one in northwestern Luiza (lower left), and one in northeastern Ariquemes (upper left). The insets illustrate a region of old, dense land clearing (Ji- Parana´), new dense land clearing (Luiza), and old, low density land clearing (Ariquemes) (Roberts et al., 2002).
Videography for Accuracy Assessment:
Accuracy of the classified map was assessed using digital airborne videography acquired over Rondonia in June 1999 using methods similar to those used by Hess et al. (2001). Sample sites were chosen by randomly selecting image frames based on the time stamp along several flight lines that crossed Ariquemes, Jiparana and Luiza. Several seconds of video frames were accessed for each sample to construct a mosaic. Flight-logs, recording aircraft location and altitude, were used to overlay a 3x3 30-m grid on each mosaic and locate the mosaics on the Landsat data. Land cover, within the central box corresponding to a Landsat pixel, was described as percentages of herbaceous cover, short shrubs, tall shrubs, medium forest, tall forest, human construction (roads/buildings), water, soil and rock then translated into their corresponding image classes. Classified values for each sample site were extracted from 1999 images for direct comparison to the videography. A total of 226 samples were acquired and used for accuracy assessment.
6. Data Access:
This data is available through the Oak Ridge National Laboratory (ORNL) Distributed Active Archive Center (DAAC).
Data Archive Center:
Contact for Data Center Access Information:
E-mail: uso@daac.ornl.gov
Telephone: +1 (865) 241-3952
7. References:
Adams, J.B., M.O. Smith and A.R. Gillespie. 1993. Imaging spectroscopy:Interpretation based on spectral mixture analysis, in Remote Geochemical Analysis: Elemental and Mineralogical Composition, edited by C. M.Pieters and P. Englert, pp. 145-166, Cambridge Univ. Press., New York.
Carlotto, M.J. (1999). Reducing the effects of space-varying, wavelength-dependent scattering in multispectral imagery. Int. J. Remote Sens., 20(17), 3333-3344.
Clark, L.A. and D. Pregibon. 1992. Tree-based models, in Statistical Models in S, edited by J. M. Chambers and T. J. Hastie, pp. 377-420, Wadsworth, Belmont, Calif.
Congalton, R.G. and R.A. Mead. 1983. A quantitative method to test for consistency and correctness in photointerpretation, Photogramm. Eng. Remote Sens., 49(1), 69-74.
Elvidge, C.D. and F.P. Portigal. 1990 Change detection in vegetation using 1989 AVIRIS data, in Proc. SPIE Imaging Spectroscopy of the Terrestrial Environment, Orlando, Fla., 16-17 April, edited by G. Vane, pp. 178-189, Int. Soc. for Opt. Eng., Bellingham, Wash.
Friedl, M.A. and C.E. Brodley. 1997. Decision tree classification of land cover from remotely sensed data, Remote Sens. Environ., 61, 399-409. Furby, S. L., & Campbell, N. A. (2001), Calibrating images from different dates to like-value digital counts, Remote Sens. Environ., 77, 186-196.
Hall, F.G., D.E. Strebel, J.E. Nickeson and S.J. Goetz. 1991. Radiometric rectification, toward a common radiometric response among multidate, multisensor images, Remote Sens. Environ., 35, 11-27.
Hess, L.L., J.M. Melack, S. Filoso and Y. Wang. 1995. Delineation of inundated area and vegetation along the Amazon floodplain with the SIR-C synthetic aperture radar, IEEE Trans. Geosci. Remote Sens., 33(4), 896-904.
Hess, L.L., et al. 2001. Geocoded digital videography for validation of land cover mapping in the Amazon Basin, Int. J. Remote Sens., 23(7), 1527- 1555.
INPE.2000. Monitoramento da floresta Amazonica Brasileira por satelite 1998-1999, 22 pp., Inst. Nac. de Pesqui. Espaciais, Sao Jose Dos Campos SP,Brazil.
Kaufman, Y.J. 1989. The atmospheric effect on remote sensing and its correction,in Theory and Applications of Optical Remote Sensing, edited by G. Asnar, pp. 336-428, John Wiley, New York.
Pedlowski, M.A., D.H. Dale, E.A.T. Matricardi, and E.P.S. Filho (1997). Patterns and impacts of deforestation in Rondonia, Brazil, Landscape Urban Plan., 38, 149–157.
RADAMBRASIL. 1978. Levantamento de recursos naturais. Ministerio das Minas e Energia, Rio de Janeiro, Brazil.
Richards, J.A. 1999. Remote Sensing Digital Image Analysis: An Introduction, Springer-Verlag, New York.
Roberts, D.A., G. Batista, J. Pereira, E. Waller and B. Nelson. 1998. Change identification using multitemporal spectral mixture analysis: Applications in eastern Amazonia, in Remote Sensing Change Detection: Environmental Monitoring Applications and Methods, edited by C. Elvidge and R. Lunetta, pp. 137-161, Ann Arbor Press, Chelsea, Mich.
Roberts, D.A., I. Numata, K. Holmes, G. Batista, T. Krug, A. Monteiro, B. Powell, and O.A. Chadwick. (2002) Large area mapping of land-cover change in Rondonia using multitemporal spectral mixture analysis and decision tree classifiers. Journal of Geophysical Research-Atmospheres, Vol. 107, No. D20, p. 8073.
Schott, J., C. Salvaggio and W. Volchok. 1988. Radiometric scene normalization using pseudoinvariant features, Remote Sens. Environ., 26, 1-16.
Smith, M.O., S.L. Ustin, J.B. Adams and A.R. Gillespie. 1990. Vegetation in deserts, I, A regional measure of abundance from multispectral images,Remote Sens. Environ., 31, 1-26.
Related Publications
- Roberts, D.A., I. Numata, K. Holmes, G. Batista, T. Krug, A. Monteiro, B. Powell, and O.A. Chadwick. (2002) Large area mapping of land-cover change in Rondonia using multitemporal spectral mixture analysis and decision tree classifiers. Journal of Geophysical Research-Atmospheres, Vol. 107, No. D20, p. 8073.
- Holmes, K.W., D.A. Roberts, S. Sweeney, I. Numata, E. Matricardi, T.W. Biggs, G. Batista, and O.A. Chadwick. 2004. Soil databases and the problem of establishing regional biogeochemical trends. Global Change Biology 10(5):796-814.
- Numata, I, M.A. Cochrane, D.A. Roberts and J.V. Soares. 2009. Determining dynamics of spatial and temporal structures of forest edges in South Western Amazonia. Forest Ecology and Management, 258, 2547-2555.
- Numata, I., M. A. Cochrane, D. A. Roberts, J. V. Soares, C. M. Souza Jr., and M. H. Sales. 2010, Biomass collapse and carbon emissions from forest fragmentation in the Brazilian Amazon, J. Geophys. Res., 115, G03027, doi:10.1029/2009JG001198.