Summary:
This data set contains modeled estimates of carbon flux, biomass, and annual burning emissions across the Brazilian state of Mato Grosso from 2000-2006. The model, DEforestation CArbon Flux (DECAF), was used to provide annual carbon fluxes from large deforestation events (>25 ha) based on post-deforestation land use, and the frequency and duration of active fires during the deforestation process. Carbon fluxes associated with the conversion of Cerrado to mechanized crop production, fires in Cerrado, and managed pasture cover types were also estimated.
Model data outputs provided include:
- Estimated aboveground live biomass from DECAF in 2000 and 2004.
- Annual biomass burning emissions estimates for 2001-2005 from low, middle, and high emissions scenarios with DECAF. There are 15 GeoTIFF files for annual emissions which represent the carbon emissions per pixel in grams of carbon per m2 (g C m-2).
Model data inputs provided include:
- Annual burn trajectories for 2001 - 2005, including deforestation, Cerrado land cover conversion, and fires in pasture and Cerrado ecosystems unrelated to agricultural expansion. These data were assembled from three sources: MODIS 500-m burned area maps, annual deforestation based on data from the INPE PRODES program, and the conversion of Cerrado savannah/woodland to cropland estimated from land cover information from MODIS phenology metrics.
- Annual land cover data 2001-2004 for the portion of Mato Grosso covered by MODIS phenology metrics, tile h12v10, updated based on annual land cover changes in Amazon forest and Cerrado cover types.
- Monthly Normalized Difference Vegetation Index (NDVI) for MODIS tile h12v10 from 10/2000 - 09/2006, based on cloud and gap-filled 16-day NDVI data from MODIS Collection 4 16-day NDVI composites MOD13 product (Huete et al., 2002).
There are six compressed (*.gz) files with this data set.
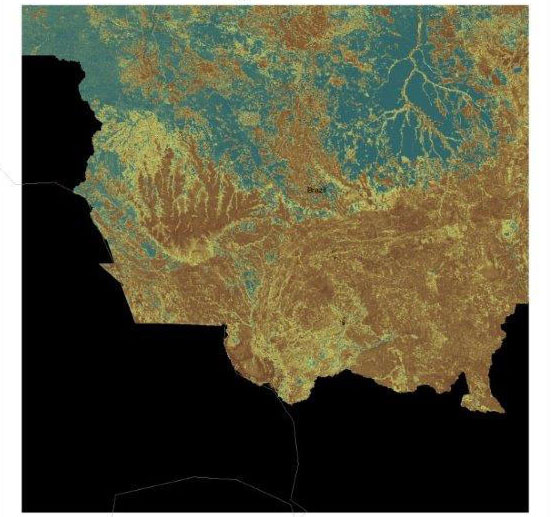
Figure 1. DECAF estimated aboveground biomass.
Data Citation:
Cite this data set as follows:
Morton, D.C., R.S. DeFries, G.R. van der Werf, L. Giglio. 2013. LBA-ECO LC-39 Modeled Carbon Flux from Deforestation, Mato Grosso, Brazil: 2000-2006. Data set. Available on-line [http://daac.ornl.gov ] from Oak Ridge National Laboratory Distributed Active Archive Center, Oak Ridge, Tennessee, USA. http://dx.doi.org/10.3334/ORNLDAAC/1190
Implementation of the LBA Data and Publication Policy by Data Users:
The LBA Data and Publication Policy [http://daac.ornl.gov/LBA/lba_data_policy.html] is in effect for a period of five (5) years from the date of archiving and should be followed by data users who have obtained LBA data sets from the ORNL DAAC. Users who download LBA data in the five years after data have been archived must contact the investigators who collected the data, per provisions 6 and 7 in the Policy.
This data set was archived in September 2013. Users who download the data between September 2013 and August 2018 must comply with the LBA Data and Publication Policy.
Data users should use the investigator contact information in this document to communicate with the data provider.
Data users should use the Data Set Citation and other applicable references provided in this document to acknowledge use of the data.
Table of Contents:
- 1 Data Set Overview
- 2 Data Characteristics
- 3 Applications and Derivation
- 4 Quality Assessment
- 5 Acquisition Materials and Methods
- 6 Data Access
- 7 References
1. Data Set Overview:
Project: LBA (Large-Scale Biosphere-Atmosphere Experiment in the Amazon)
Activity: LBA-ECO
LBA Science Component: Land Use and Land Cover
Team ID: LC-39 (DeFries / Shimabukuro)
The investigators were DeFries-Bajpai, Ruth; Anderson, Liana; Morton, Douglas. You may contact Morton, Douglas (douglas.morton@gmail.com).
LBA Data Set Inventory ID: LC39_DECAF_Model
This data set contains modeled estimates of carbon flux, biomass, and annual burning emissions across the Brazilian state of Mato Grosso from 2000-2006. The model, DEforestation CArbon Flux (DECAF), was used to provide annual carbon fluxes from large deforestation events (>25 ha) based on post-deforestation land use, and the frequency and duration of active fires during the deforestation process. Carbon fluxes associated with the conversion of Cerrado to mechanized crop production, and fires in Cerrado and managed pasture cover types were also estimated.
Related Data Set:
Morton, D.C., R.S. DeFries, and Y.E. Shimabukuro. 2013. LBA-ECO LC-22 Land Cover from MODIS-based Vegetation Phenology, Mato Grosso, Brazil. Data set. Available on-line [http://daac.ornl.gov ] from Oak Ridge National Laboratory Distributed Active Archive Center, Oak Ridge, Tennessee, USA
2. Data Characteristics:
There are six compressed (*.gz) files with this data set. When expanded, the .gz files contain .tiff files and .aux.xml text files with band information.
Output Data files:
File 1: decaf_mt_biomass_ndvi.tar.gz: This file contains estimated aboveground biomass (in grams biomass per m2, or g DM m-2) in 2000 and 2004.
When expanded, the zip file contains one.tif file and two
additional text files:
decaf_mt_biomass.nvi.tif
decaf_mt_biomass.nvi.tif.xml
decaf_mt_biomass.nvi.tif.aux.xml
File 2: decaf_bb_emissions_2001_2005.tar.gz: This is an output data file that contains DECAF biomass burning emissions estimates for three scenarios: low, middle, and high. The scenarios reflect different levels of tree mortailty, combustion completeness, and inclusion of below-ground biomass burning.
When expanded, the zip file contains
15 GeoTIFF (.tif) files
for annual emissions, which represent the carbon emissions per pixel in grams
of carbon per m2 (g C m-2); three files each for 2001, 2002, 2003, 2004, and 2005.
The files are geocorrected-unsigned 16 bit integer files named using the following convention:
BBYYYY_scenario.tif, where BB = biomass burning, YYYY =
years 2001-2005, scenario = low, middle, or high.
Example file names: BB2001_high.tif, BB2001_low.tif, and
BB2001_middle.tif
Input Data Files (files 3-6):
File 3: decaf_burn_trajectories_2001_2005.tar.gz: This file contains annual burn trajectories. The files are signed 16 bit integer and with a nodata value of -32768.
When expanded, there are five (.tif) files named using the following convention:
decaf_burn_trajectoryYYYY.tif …where YYYY is 2001, 2002, 2003, 2004, or 2005.
Example file name: decaf_burn_trajectory2001.tif
File 4: decaf_land_cover_geotiff.tar.gz: This file contains annual land cover classified into 6 land cover classes, for Mato Grosso State.
When expanded, there are four GeoTIFF (.tif) filesfor
the years 2000-2004 named using the following convention:
decafY1Y2_land_cover_tiff.tif
where Y1 = DECAF model year start (October of year 1), and Y2 is the end date (September of year 2).
Y1Y2=0001, 0102, 0203, or 0304.
Example file name: decaf0001_land_cover_tiff.tif (for the years 2000-2001).
File 5: mato_grosso_h12v10_mask.tar.gz: This zip file contains a Mato Grosso data mask that indicates the regions within MODIS tile h12v10 that correspond to the Brazilian state of Mato Grosso (value = 1).
When expanded, there are two files:
mata_grosso_h12v10_mask.tif and mata_grosso_h12v10_mask.tif.aux.xml
NDVI files:
File 6: decaf_monthly_ndvi_Oct2000_Sep2006.tar.gz: This file contains NDVI data for October 2000-September 2006.
When expanded, the .gz file contains contains 60*.tif files, 60 *.tif.xml files, and 55 *.tif.aux.xml files.
The files for a given month and year are named using the following convention:
mmmYY_ndvi.nvi.tif, and mmmYY_ndvi.nvi.tif.xml, and mmmYY_ndvi.nvi.tif.aux.xml
where mmm=abbreviated months apr, aug, dec, feb, jan, jul, jun, mar, may, nov, oct, and sep.
YY=2 digit year for 00, 01,02,03,04,05,and 06.
Example file names: apr01_ndvi.nvi.tif and apr01_ndvi.tif.xml and apr01_ndvi.tif.aux.xml
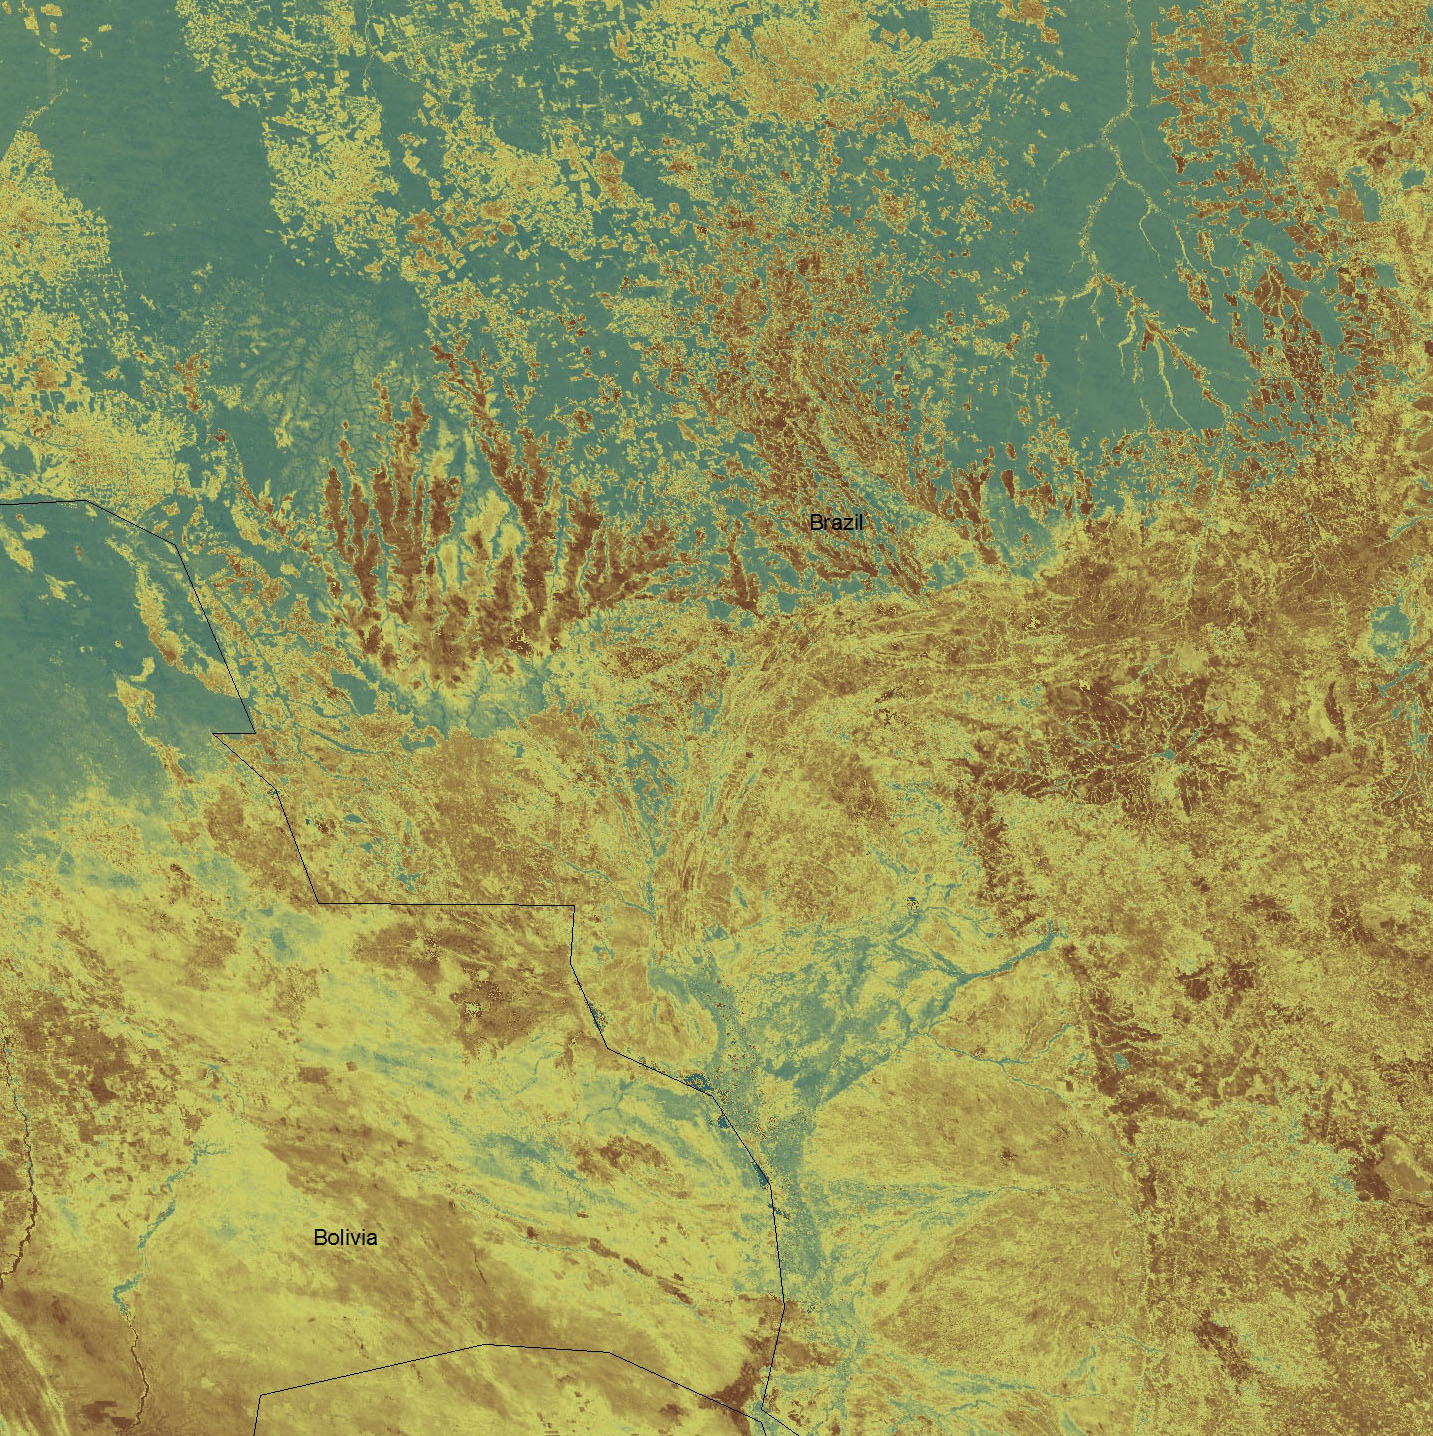
Figure 2. DECAF monthly NDVI for September 2006.
Site boundaries: (All latitude and longitude given in decimal degrees)
| Site (Region) | Westernmost Longitude | Easternmost Longitude | Northernmost Latitude | Southernmost Latitude | Geodetic Datum |
|---|---|---|---|---|---|
| Mato Grosso (Mato Grosso) | -63.8507 | -50.7629 | -10 | -20 | MODIS Sinusoidal Projection (Spherical) |
Time period:
- The data set covers the period: 2000/10/01 to 2006/09/30
- Temporal Resolution: Monthly and annual
Platform/Sensor/Parameters measured include:
- COMPUTER MODEL / ANALYSIS / CARBON
- TERRA (MORNING EQUATORIAL CROSSING TIME SATELLITE) / MODIS (MODERATE-RESOLUTION IMAGING SPECTRORADIOMETER) / FIRE OCCURRENCE
- TERRA (MORNING EQUATORIAL CROSSING TIME SATELLITE) / MODIS (MODERATE-RESOLUTION IMAGING SPECTRORADIOMETER) / VEGETATION INDEX
- COMPUTER MODEL / ANALYSIS / BIOMASS
3. Data Application and Derivation:
DECAF represents a substantial improvement over previous attempts to model deforestation carbon fluxes, both in terms of the DECAF spatial resolution (250 m) and the use of multiple lines of satellite-based evidence to constrain the timing and amount of biomass burning associated with forest cover conversions. The DECAF approach to track individual deforestation and Cerrado conversions over the multi-year clearing process provides an example of the type of model architecture that could be used for monitoring, verification, and reporting of emissions from forested lands.
4. Quality Assessment:
DECAF estimated aboveground biomass was compared with two recent data products for the Mato Grosso study region (Sales et al., 2007; Saatchi et al., 2007) in van der Werf et al. (2009). DECAF deforestation carbon fluxes were compared with fire emissions data from the Global Fire Emissions Database (GFED) in DeFries et al. (2008). Land cover data for the DECAF model were based on field observations in 2004 and were validated using set-aside validation data from 2004 field observations and MODIS and field data from 2005 (Morton et al., 2012).
5. Data Acquisition Materials and Methods:
Site Description
Mato Grosso is a hotspot of recent deforestation, accounting for more than 15% of tropical forest losses worldwide during 2001-2005 (Hansen et al., 2008). Carbon emissions associated with deforestation in Mato Grosso, combined with other fires for land management and conversion of Cerrado woodlands for agricultural use, constitute an important source of greenhouse gas emissions. Recent efforts to reduce emissions from deforestation and forest degradation have placed further emphasis on improving estimates of historic emissions from forest lands. The DECAF model was designed to estimate monthly land use carbon fluxes in Amazon and Cerrado savanna/woodland ecosystems with very high (250 m) spatial resolution (DeFries et al., 2008; van der Werf et al., 2009). Monthly carbon fluxes from large deforestation events (>25 ha) were modeled based on post-deforestation land use (Morton et al., 2006) and the frequency and duration of active fires during the deforestation process (Morton et al., 2008). Land use carbon fluxes were also estimated that were associated with conversion of Cerrado to mechanized crop production (Morton et al., 2006), fires in Cerrado, and managed pasture cover types (Giglio et al., 2009).
DECAF Output Data
DECAF Estimated Aboveground Biomass:
Live and dead biomass was estimated from various carbon pools (see van der Werf et al., 2009). These data files represent the estimated aboveground biomass (in grams biomass per m2, or g DM m-2) in 2000 and 2004.
Estimated biomass in 2000 represents the model initial conditions following spin-up using NDVI data from 2000-2001 (van der Werf et al., 2009).
2004 biomass represents the aboveground biomass after simulating net primary production (NPP) and heterotrophic respiration, land cover changes, and biomass burning during 2001-2004.
Biomass Burning Emissions Estimates:
The DECAF model was run under three scenarios: low, middle, and high (DeFries et al., 2009; van der Werf et al., 2009). These scenarios selected different levels of tree mortality, combustion completeness, and inclusion of below-ground biomass in burning activities (van der Werf et al., 2009). Emissions results for 2001-2005 were generated separately for runs under the low, middle, and high scenarios. GeoTIFF files for annual emissions represent the carbon emissions per pixel in grams carbon per m2 (g C m-2).
DECAF Input Data Sources:
Burn Trajectories: Annual burn trajectory information was assembled from three separate data sources:
1) Monthly burned area for fires in pasture and Cerrado savanna/woodland ecosystems.
2) Annual deforestation information based on deforestation increment data from INPE PRODES program (http://obt.inpe.br/prodes).
- For large deforestation events (>25 ha), information on post-clearing land use (Morton et al., 2006, 2007) and the duration of active fire detections associated with forest conversion (Morton et al., 2008) were used to assign deforestation events to 1, 2, or 3-year conversions for pasture, cropland, or areas not in production (van der Werf et al., 2009).
- Small deforestation events (<25 ha) were assigned to land cover classes of pasture or cropland as described in van der Werf et al. (2009).
3) Conversion of Cerrado savanna/woodland to cropland was estimated using annual land cover information from MODIS phenology metrics (see Morton et al., 2006; Morton et al., 2012). In each data file, burning trajectories for each pixel were coded using the following legend:
| Type | Transition # |
|---|---|
| NONFOREST TRANSITIONS | |
| Cerrado/Pasture Fire January | 1 |
| Cerrado/Pasture Fire February | 2 |
| Cerrado/Pasture Fire March | 3 |
| Cerrado/Pasture Fire April | 4 |
| Cerrado/Pasture Fire May | 5 |
| Cerrado/Pasture Fire June | 6 |
| Cerrado/Pasture Fire July | 7 |
| Cerrado/Pasture Fire August | 8 |
| Cerrado/Pasture Fire September | 9 |
| Cerrado/Pasture Fire October | 10 |
| Cerrado/Pasture Fire November | 11 |
| Cerrado/Pasture Fire December | 12 |
| Secondary transitions (Pasture-Cropland) | 18 |
| Cerrado-cropland | 19 |
| Pasture-cropland | 20 |
| DEFORESTATION TRANSITIONS | |
| cropland 1 year (no fire) | 21 |
| cropland 1 year (early) | 22 |
| cropland 1 year (standard) | 23 |
| crop 1 year (pre-fire and late) | 24 |
| cropland 1 year (late) | 25 |
| cropland 2 year (no fire) | 26 |
| cropland 2 year (early) | 27 |
| cropland 2 year (standard) | 28 |
| cropland 3 year (no fire) | 29 |
| cropland 3 year (early) | 30 |
| cropland 3 year (standard) | 31 |
| pasture 1 year (no fire) | 32 |
| pasture 1 year (early) | 33 |
| pasture 1 year (standard) | 34 |
| pasture 1 year (pre-fire and late) | 35 |
| pasture 1 year (late) | 36 |
| pasture 2 year (no fire) | 37 |
| pasture 2 year (early) | 38 |
| pasture 2 year (standard) | 39 |
| pasture 3 year (no fire) | 40 |
| pasture 3 year (early) | 41 |
| pasture 3 year (standard) | 42 |
| NYIP (no fire) | 43 |
| NYIP (early) | 44 |
| NYIP (normal) | 45 |
| NYIP (late) | 46 |
| Small (<25ha) crop | 47 |
| Small (<25ha) pasture | 48 |
Deforestation transitions:
Early: Active fires detected in the year prior to PRODES deforestation detection (e.g., fires in October; deforestation not detected until the following August).
No Fire: Deforestation transitions for which no MODIS active fires were detected within a 1 km radius.
Standard: Deforestation transition for which active fire information and phenology-based land cover classification indicate the same pace of conversion (e.g., two years).
Late: Deforestation transition in which MODIS active fire detections continue beyond the appearance of post-clearing land-use phenology of pasture or cropland.
Land Cover: Annual land cover information for Mato Grosso State was generated using MODIS phenology metrics (Morton et al., 2006, Morton et al., 2012). In addition, annual land cover data was updated based on post-clearing land use (pasture or cropland) for deforestation and Cerrado conversion to mechanized cropland in previous years.
Six land cover classes were included in DECAF:
| DECAF Model Class | Class Number |
|---|---|
| Forest | 1 |
| Cropland | 2 |
| Cerrado (woody savanna) | 3 |
| Grassland/Pasture | 4 |
| Woodland (cerradao) | 5 |
| Water | 6 |
The Mato Grosso data mask indicates the regions within MODIS tile h12v10 that correspond to the Brazilian state of Mato Grosso (value = 1).
Monthly NDVI - Collection 4 NDVI data were used from the Moderate Resolution Imaging Spectroradiometer (MODIS) sensors on board the Terra platform for South America from 2000-2006
Monthly data were generated from MODIS Collection 4 16-day NDVI composites (MOD13, Huete et al., 2002) after cloudy and missing data were replaced using a cubic spline function (see Morton et al., 2006; 2012). Individual months were generated using the following rules for combining data from 16-day composites:
January: 001 and 017
February: 33 and 49
March: 65 and 81
April: 97 and 113
May: only 129
June: 145 and 161
July: 177 and 193
August: 209 and 225
September: 241 and 257
October: 273 and 289
November: 305 and 321
December: 337 and 353
6. Data Access:
These data are available through the Oak Ridge National Laboratory (ORNL) Distributed Active Archive Center (DAAC).
Data Archive Center:
Contact for Data Center Access Information:
E-mail:
uso@daac.ornl.gov
Telephone: +1 (865) 241-3952
7. References:
DeFries, R.S., D.C. Morton, G.R. van der Werf GR, L. Giglio, G.J. Collatz, J.T. Randerson, R.A. Houghton, P.S. Kasibhatla. 2008. Fire-related carbon emissions from multiple land use transitions in southern Amazonia. Geophysical Research Letters 35, doi:10.1029/2008GL035689
Giglio, L., T. Loboda, D.P. Roy, B. Quayle, C.O. Justice. 2009. An active-fire based burned area mapping algorithm for the MODIS sensor. Remote Sensing of Environment, 113, 408-420.
Hansen, M.C., S.V. Stehman, P.V. Potapov, T.R. Loveland, J. Townshend, R.S. DeFries, K.W. Pittman, B. Arunarwati, F. Stolle, M.K. Steininger, M. Carroll, C. DiMiceli. 2008. Humid tropical forest clearing from 2000 to 2005 quantified by using multitemporal and multiresolution remotely sensed data. Proceedings of the National Academy of Sciences, 105, 9439-9444.
Huete, A.R., K. Didan, T. Miura, E.P. Rodriguez, X. Gao, L.G. Ferreira. 2002. Overview of the radiometric and biophysical performance of the MODIS vegetation indices. Remote Sensing of Environment, 83, 195-213. Morton, D.C., R.S. DeFries, Y.E. Shimabukuro, L.O. Anderson, E.Arai, F. del Bon Espirito-Santo, R. Frietas and J. Morisette. 2006. Cropland expansion changes deforestation dynamics in the southern Brazilian Amazon. PNAS 103: 14637-14641.
Morton, D.C., R.S. DeFries, J.T. Randerson, L. Giglio, W. Schroeder, G.R. van der Werf. 2008. Agricultural intensification increases deforestation fire activity in Amazonia. Global Change Biology 14: 2262-2275.
Morton, D.C., R.S. DeFries, Y.E. Shimabukuro, L.O. Anderson, E. Arai, F. Espirito-Santo, R. Freitas, and J. Morisette. 2012. LBA-ECO LC-22 Post-deforestation Land Use, Mato Grosso, Brazil: 2001-2005. Data set. Available on-line [http://daac.ornl.gov] from Oak Ridge National Laboratory Distributed Active Archive Center, Oak Ridge, Tennessee, U.S.A.http://dx.doi.org/10.3334/ORNLDAAC/1099
Saatchi, S.S., R.A. Houghton, A.R. Dos Santos, J.V. Soares, Y. Yu. 2007. Distribution of aboveground live biomass in the Amazon basin. Global Change Biology, 13, 816-837.
Sales, M.H., C.M. Souza Jr., P.C. Kyriakidis, D.A. Roberts, E. Vidal. 2007. Improving spatial distribution estimation of forest biomass with geostatistics: A case study for Rondonia, Brazil. Ecological Modelling, 2005, 221-230.
van der Werf, G.R., D.C. Morton, R.S. DeFries, L. Gilgio, J.T. Randerson, G.J. Collatz, P.S. Kasibhatla. 2009. Estimates of deforestation-induced carbon fluxes in the southern Amazon based on satellite data and biogeochemical modeling. Biogeosciences 6: 239-245.
Related Publications
- Morton, D.C., R.S. DeFries, Y.E. Shimabukuro, L.O. Anderson, E.Arai, F. del Bon Espirito-Santo, R. Frietas and J. Morisette. 2006. Cropland expansion changes deforestation dynamics in the southern Brazilian Amazon. PNAS 103: 14637-14641.
- Morton, D.C., Y.E. Shimabukuro, B.F.T. Rudorff, A. Lima, R. Freitas, R.S. DeFries. 2007. Challenges for conservation at the agricultural frontier: deforestation, fire, and land use dynamics in Mato Grosso. Agua & Ambiente 2(1): 5-20.
- Morton D.C., R.S. DeFries, J.T. Randerson, L. Giglio, W. Schroeder, G.R. van der Werf. 2008. Agricultural intensification increases deforestation fire activity in Amazonia. Global Change Biology 14: 2262-2275.
- DeFries R.S., D.C. Morton, G.R. van der Werf GR, L. Giglio, G.J. Collatz, J.T. Randerson, R.A. Houghton, P.S. Kasibhatla. 2008. Fire-related carbon emissions from multiple land use transitions in southern Amazonia. Geophysical Research Letters 35, doi:10.1029/2008GL035689.