Get Data
Summary:
This data set provides a single raster image containing the spatial distribution of aboveground live forest biomass of the Amazon basin. This product was derived using a methodology based on a combination of land cover map, remote sensing derived metrics, and more than 500 forest plots distributed over the basin (Saatchi, et al., 2007).
The distributed map was produced in ENVI in Tiff format and contains forest biomass divided among 11 classes at 1 km spatial resolution with reasonable accuracy (better than 70%). Remote sensing and ground data used in this product were collected from 1990-2000. The Biomass map represents average biomass distribution over the Amazon basin over this period and was used to estimate the total carbon stock of the basin, including the dead and belowground biomass.
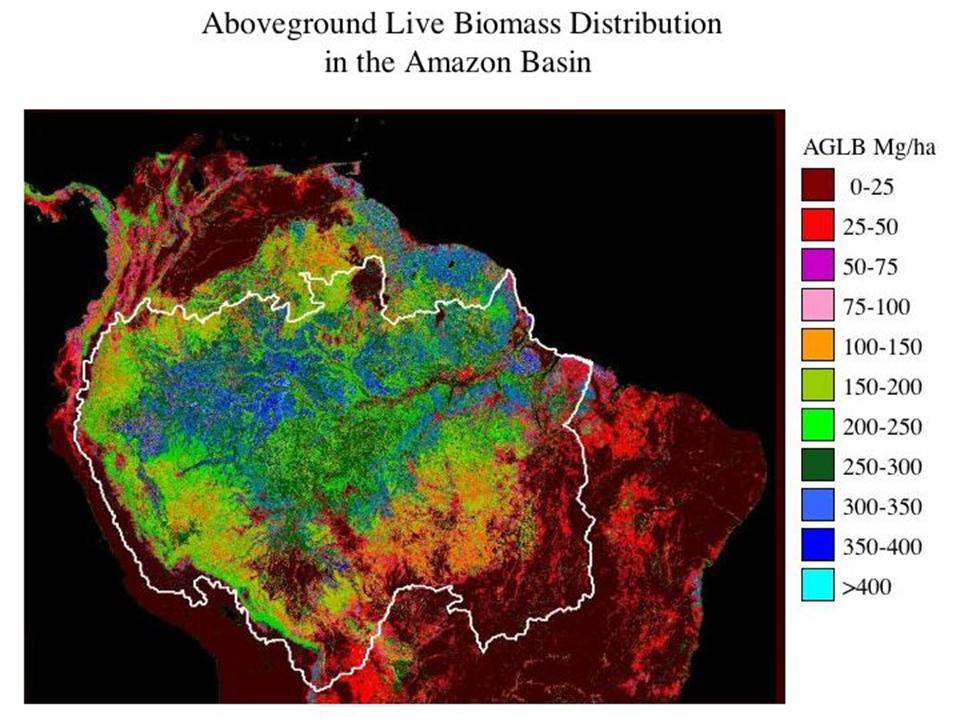
Figure1.
Aboveground live biomass classification map of the Amazon
basin at 1 km
spatial resolution derived from
combined DTM and regression analysis with 11 biomass classes and
overall
accuracy of 88%.
Data Citation:
Cite this data set as follows:
Saatchi, S.S., R.A. Houghton, D. Alves, B. Nelson. 2009. LBA-ECO LC-15 Amazon Basin Aboveground Live Biomass Distribution Map: 1990-2000. Data set. Available on-line [http://daac.ornl.gov] from Oak Ridge National Laboratory Distributed Active Archive Center, Oak Ridge, Tennessee, U.S.A. doi:10.3334/ORNLDAAC/908.
Implementation of the LBA Data and Publication Policy by Data Users:
The LBA Data and Publication Policy [http://daac.ornl.gov/LBA/lba_data_policy.html] is in effect for a period of five (5) years from the date of archiving and should be followed by data users who have obtained LBA data sets from the ORNL DAAC. Users who download LBA data in the five years after data have been archived must contact the investigators who collected the data, per provisions 6 and 7 in the Policy.
This data set was archived in January of 2009. Users who download the data between January of 2009 and December 2014 must comply with the LBA Data and Publication Policy.
Data users should use the Investigator contact information in this document to communicate with the data provider. Alternatively, the LBA Web Site [http://lba.inpa.gov.br/lba/] in Brazil will have current contact information.
Data users should use the Data Set Citation and other applicable references provided in this document to acknowledge use of the data.
Table of Contents:
- 1 Data Set Overview
- 2 Data Characteristics
- 3 Applications and Derivation
- 4 Quality Assessment
- 5 Acquisition Materials and Methods
- 6 Data Access
- 7 References
1. Data Set Overview:
Project: LBA-ECO
Activity: Regional Vegetation Variables
LBA Science Component: Land Use and Land Cover
Team ID: LC-15 (Saatchi / Alvala)
The investigators were Saatchi, Sassan Sepehri; Alves, Diogenes Salas; Houghton, Richard A. and Nelson, Bruce . You may contact Saatchi, Sassan Sepehri (Saatchi@congo.jpl.nasa.gov)
LBA Data Set Inventory ID: LC15_AGLB_Distribution_Map
To determine the spatial distribution of forest biomass of the Amazon basin, we introduce a methodology based on spatial data, such as land cover, remote sensing metrics representing various forest structural parameters and environmental variables, and more than 500 forest plots distributed over the basin. The distributed map in Tiff format contains forest biomass divided among 11 classes at 1 km spatial resolution with reasonable accuracy (better than 70%). Remote sensing and ground data used in this product were collected from 1990-2000.
- Contact Dr. Sassan Saatchi at saatchi@congo.jpl.nasa.gov
2. Data Characteristics:
The distributed map in Tiff format contains forest biomass divided among 11 classes at 1 km spatial resolution. Remote sensing and ground data used in this product were collected from 1990-2000.
- LC15_amazon_biomass.tif, is a Tiff file, coded with values 0-11.
- LC15_amazon_biomass.dsr, is an ascii file that has the rgb combination for each data value 0-11, also known as an ENVI Density Slice Range file.
- LC15_amazon_biomass.tfw, is an ascii file which contains the transformation information: pixel x size, rotation around the y axis, rotation around the x axis, pixel y size, x of the upper left pixel, and y of the upper left pixel.
- LC15_bounding_coordinates.txt, is an ascii file containing the spatial content of the Tiff.
The spatial reference for this Tiff is defined as geographic coordinate system WGS_84 and the cell size is 1km.
from *.tfw file:
spatial resolution
x-axis
0.00833000000000
false
northing
0.00000000000000
false
easting
0.00000000000000
spatial
resolution y-axis
-0.00833000000000
upper left
x coordinate -82.71673500000000
upper left
y coordinate 13.85413500000000
Biomass classes Mg/ha (megagrams per hectare), 11 categories as shown in the Figure 1 legend:
0-25, 25-50, 50-75, 75-100, 100-150, 150-200, 200-250, 250-300, 300-350, 350-400, and >400
It is worth noting that the data values don’t actually correspond to above ground biomass estimates, but are the the 11 categories as shown in the Figure 1 legend.
Site boundaries: (All latitude and longitude given in degrees and fractions)
| Site (Region) | Westernmost Longitude | Easternmost Longitude | Northernmost Latitude | Southernmost Latitude | Geodetic Datum |
|---|---|---|---|---|---|
| Amazon Basin | -82.72083 | -33.573900 | 13.858300 | -21.127700 | World Geodetic System, 1984 (WGS-84) |
Time period:
- The data set covers the period 1990/01/01 to 2000/12/31.
Platform/Sensor/Parameters measured include:
- COMPUTER MODEL / ANALYSIS / Forest Composition/Vegetation Structure
- COMPUTER MODEL / ANALYSIS / BIOMASS
- COMPUTER MODEL / ANALYSIS / CARBON
3. Data Application and Derivation:
Results show that AGLB is highest in the main Central Amazon and in regions to the east and north, including the Guyanas. Biomass is generally above 300 Mg/ha here except in areas of intense logging or open floodplains. In the Western Amazon from the lowland regions of Peru, Ecuador,and Colombia to the Andean elevational gradients, biomass ranges from 150-300 Mg/ha. Most transitional and seasonal forests in southern and northwestern edges of the basin have biomass ranging from 100-200 Mg/ha. The AGLB distribution has a significant correlation with the months of dry season and the annual mean rainfall patterns across the basin. We predict, the total carbon in forest biomass of the Amazon basin, including the dead and belowground biomass, is about 86 PgC with uncertainty which compares in magnitude with the range of carbon predicted by other models. The Biomass map represents average biomass distribution over the Amazon basin over this period and was used to estimate the total carbon stock of the basin, including the dead and belowground biomass.
4. Quality Assessment:
Saatchi et al.(2007) discuss estimates of the accuracy from crossvalidation, and sources of errors and uncertainties in the biomass classifications.
For spatial accuracy, two general features were apparent: (1) Accuracy varies with biomass. Areas with less than 150 Mg/ha biomass usually have more than 80% accuracy in biomass, although the accuracy is less in some areas of old secondary forests and dense woodlands, where biomass ranges from 100-150 Mg/ha. (2) The spatial accuracy varies within each biomass class depending on the type of vegetation or the characteristics of the remote sensing data. For example, within one biomass class, areas with higher elevation and ruggedness had relatively less accuracy than areas with flat topography.
What are the environmental variables responsible for the magnitude and distribution patterns of biomass density over the basin?
Uncertainty
remains as to how accurate are ground measurements of biomass over the
basin. In this study, we did not address the errors associated with the
aboveground biomass of forest plots. In the future,
uncertainty might be reduced by improving the spatial resolution of
data layers. This question might be tested by incorporating all
available high resolution satellite imagery and employing a multi-scale
approach for estimating or extrapolating biomass. One of the
main sources of uncertainty in our study was the discrepancy between
the resolution of images and the size of the forest plots. The spectral
information obtained from 1 km resolution data is unlikely to
represent the plot biomass or structure. By incorporating images at
30-100 meter resolutions, we may be able to locate the plots directly
on the images and remove location uncertainty, to incorporate surface
heterogeneity in our calculations, and to improve the separation of the
anthropogenic landscapes from forests. By using a multiscale approach,
a final biomass map of 100 m resolution, or finer, might be produced.
5. Data Acquisition Materials and Methods:
The
investigators used a new method of
extrapolation over the Amazon basin. By collecting data from a large
number of
biomass plots in a variety of forest types distributed over the basin,
and by
using remote sensing data sensitive to forest characteristics and
environmental
variables, we develop a series of metrics for extrapolating the plot
data to
the basin. The approach combines the strengths of both forest plots
(limited in
spatial coverage but providing accurate measurement of biomass) and
remote
sensing data (less accurate in measuring biomass directly but covering
the
entire region). The spatial resolution is 1-km. To cover the wide range
of
biomass values across the basin, we considered all vegetation types
present:
old growth terra firme
forests, floodplains, woody and
herbaceous savanna, and small forest patches along the eastern
Biomass Field Plots
| Vegetation Type | Number of Plots | Average AGLB Tons/ha | Standard Deviation AGLB Tons/ha |
|---|---|---|---|
| Old Growth Terra Firme Forest | 216 | 254.8 | 103.2 |
| Floodplain Inundated Forest | 40 | 161.3 | 101.7 |
| Secondary Forest | 191 | 52.9 | 47.5 |
| Woodland Savanna | 59 | 20.1 | 30.2 |
| Grass/Shrub Savanna | 38 | 4.4 | 1.9 |
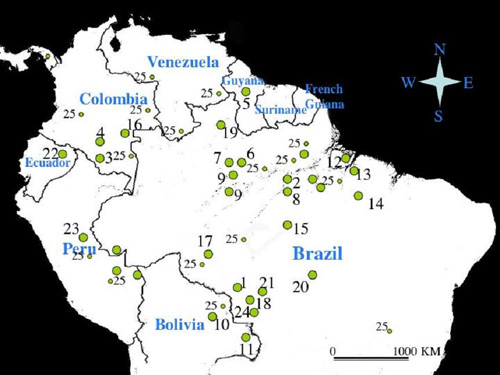
In this study, we identified and collected data from 544 biomass plots sampled in different vegetation types throughout the basin. The data from majority of these plots were not published in literature and were contributed to this study by individual investigators. The general information about the plot size, vegetation cover, geographical region and the name of the principal investigators and the dates for available publications, reports or date of the data collection are provided in the table. We would like to thank the following scientists who shared the biomass plot data with us: Bruce Nelson(INPA, Brazil), Dirk Hoekman (Wageningen Univ., The Netherlands), Marcela Quinones (Wageningen Univ., The Netherlands), Richard Lucas(University of Wales, UK), William Laurance (Smithsonian Institute, USA), Marc Steinenger (Conservation International, USA), Emilio Moran (Indiana University, USA), Eduardo Brandazio (Indiana University, USA), J.R. Santos (INPE, Brazil), Diogenes Alves (INPE, Brazil), John Terbourgh (Duke University, USA), Nigel Pitma (Duke University), Miles, Silman (Wake Forest University) J.J. van der Sanden (Wageningen Univ. The Netherlands) , Timothy Killeen (Conservational International, Bolivia).
| No. | Reference | Location | Vegetation Type | No. of Plots/Size |
|---|---|---|---|---|
| 1 | Cummings et al. 2002 | Rondonia,Brazil | Terra firme open and ecotonal forests | 20 plots (0.79 ha) |
| 2 | Rice et al., 2002 | Tapajos, Para, Brazil | Terraa firme closed canopy dense forest | 4 transects (5 ha) |
| 3 | Hoakman et al. 2002 | Guaviare, Colombia | Terra firme primary and secondary forests | 23 plots (0.1 ha ) |
| 4 | Hoakman et al., 2000 | Araracuara, Colombia | Terra firme and inundated forests | 23 plots (0.1 ha) |
| 5 | Sanden, 1996 | Mabura Hill, Guyana | Moist tropical forests | 28 plots (1 ha) |
| 6 | Laurance et al., 2002 | Amazonas, Brazil | Terra firme dense & fragmeneted forests | 65 plots (0.1-10 ha) |
| 7 | Lucas et al., 2003 | Manaus, Amazonas, Brazil | Secondary & Primary forests | 22 plots (0.1 ha) |
| 8 | Luckman et al., 1998 | Tapajos, Para, Brazil | Secondary & primary forests | 18 plots (0.1 ha) |
| 9 | Steinenger, 2000 | Manaus, Januaca, Amazonas, Brazil | Secondary forests | 18 plots (0.1 ha) |
| 10 | Steinenger et al., 2001 | Santa Cruz, Bolivia | Inundated, liana, secondary, semi-deciduous, deciduous forests | 26 plots (0.1 ha) |
| 11 | Brown et al., 1997 | Noel Kempff Natl. Park, Bolivia | Liana, inundated and evergreen forests | 6 vegetation classes, from 625 plots |
| 12 | Moran & Brandazio, 2000 | Marajo Island, Brazil | Secondary, logged, inundated forests | 19 plots (0.1-1.0 ha) |
| 13 | Moran & Brandazio, 2000 | Bragantina, Brazil | Secondary forest, | 19 plots (0.1-1.0 ha) |
| 14 | Moran & Brandazio, 2000 | Tome-Acu, Brazil | Secondary forest | 12 plots (0.1-1.0 ha) |
| 15 | Moran & Brandazio, 2000 | Altamira, Brazil | Secondary forest | 16 plots (0.1-1.0 ha) |
| 16 | Moran & Brandazio, 2000 | Yapu, Colombia | Secondary forest, agroforestry unit | 8 plots (0.1-1.0 ha) |
| 17 | Nelson, et al., 2001 | Acre, Brazil | Dense evergreen, bamboo forests | 20 plots (1 ha) |
| 18 | Saatchi et al. 2005 | Jaru, Rondonia, Brazil | Terra firme open forest | 5 plots (5 ha) |
| 19 | Santos et al., 2002 | Mucajai, Roraima, Brazil | Dense, open evergreen, secondary forest, savanna | 38 plots (0.1 ha) |
| 20 | Santos, et al 2002 | Comodoro, Mata Grosso, Brazil | Secondary forest, woodland, grass savanna | 30 plots (0.1 ha) |
| 21 | Santos, et al. 2002 | Jaru, Rondonia | Secondary, primary forests | 18 plots (0.1 ha) |
| 22 | Pitman et al., 2001 | Yasuni, Ecuador | Terra firme and swamp forests | 24 plots (0.1-1 ha) |
| 23 | Terborgh et al., 2001 | Manu, Peru | Terra firme and floodplain forests | 29 plots ( 1 ha) |
| 24 | Alves, et al., 1998 | Rondonia, Brazil | Secondary, primary open forests | 9 plots (0.1 ha plots) |
| 25 | Houghton et al., 2001 | Brazil, Bolivia, Peru, Venezuela, Colombia | Primary, lowland, montane and submontane forests | 44 plots (varying) |
| Total | 544 plots | |||
The overall approach was to determine relationships between remote sensing metrics and AGLB from forest plots, and use these relationships directly to estimate AGLB over the entire Amazon basin.
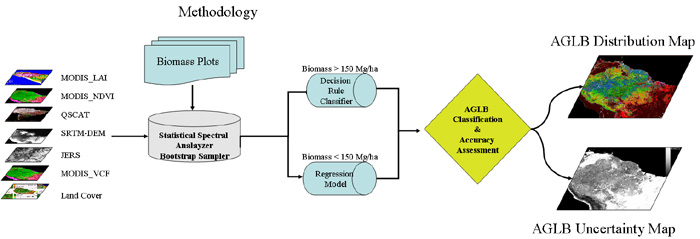
- Post-processing and geo-referencing of Remote Sensing Data
- Spectral data extraction from biomass plots
- Statistical analysis, bootstrapping resampling, development of training and test data
- Decision Rule biomass Classification of forests with AGLB > 150 Mg/ha
- Regression Model biomass Estimation of forests with AGLB < 150 Mg/ha
- Estimation and spatial accuracy assessment
A decision tree approach was used to develop the spatial distribution of AGLB for 7 distinct biomass classes of lowland old-growth forests with more than 80% accuracy. AGLB for other vegetation types, such as the woody and herbaceous savanna and secondary forests, was directly estimated with a regression based on satellite data.
6. Data
Access:
This data is available through the Oak Ridge National Laboratory (ORNL) Distributed Active Archive Center (DAAC).
Data Archive Center:
Contact for
Data
Center
Access
Information:
E-mail: uso@daac.ornl.gov
Telephone: +1 (865) 241-3952
7. References:
Saatchi, S.S., R.A. Houghton, R.C. Dos Santos Alvala, J.V. Soares and Y. Yu. 2007. Distribution of aboveground live biomass in the Amazon. Global Change Biology (2007) 13, 816-837,doi: 10.1111/j.1365-2486.2007.01323.x.
Saatchi, S.S. 2007. Projects in the Amazon Basin - Basin Wide Studies. Web page. Available on-line [http://www-radar.jpl.nasa.gov/carbon/ab/bws.htm] from Jet Propulsion Laboratory, California Institute of Technology Pasadena, California, U.S.A. Accessed March 10, 2008.
Related Publications
- Saatchi, S.S., R.A. Houghton, R.C. Dos Santos Alvala, J.V. Soares and Y. Yu. 2007. Distribution of aboveground live biomass in the Amazon. Global Change Biology (2007) 13, 816-837, doi: 10.1111/j.1365-2486.2007.01323.x.