Get Data
Summary:
This data set reports the monthly record of inundated area, in square km, for six floodplain and open water regions in South America. The following floodplains were analyzed: (1) mainstem Amazon River floodplain in Brazil; (2) Llanos de Mojos (Beni and Mamore rivers) in Bolivia; (3) Bananal Island (Araguaia River) in Brazil; (4) Roraima savannas (Branco and Rupununi rivers) in Brazil and Guyana; (5) Llanos del Orinoco (Apure and Meta rivers) in Venezuela and Colombia; and (6) Pantanal wetland (Paraguay River) in Brazil. Flooded area was estimated at monthly intervals from December 1978 through August 1987 for the Amazon mainstem region and from January 1979 through August 1987 for the other five regions. Inundated area was determined from SMMR (Scanning Multichannel Microwave Radiometer) passive microwave data. Area estimates include permanent open water as well as land subject to seasonal inundation.
This data set contains five data files: two comma-delimited (.csv)
ASCII data files providing the monthly inundation area values for six
floodplain and open water regions in South America; a compressed (.zip) file
providing seventeen ESRI Shape files for the region bounding polygons;
and two .csv files providing information about the region bounding
polygons and latitude/longitude verticies.
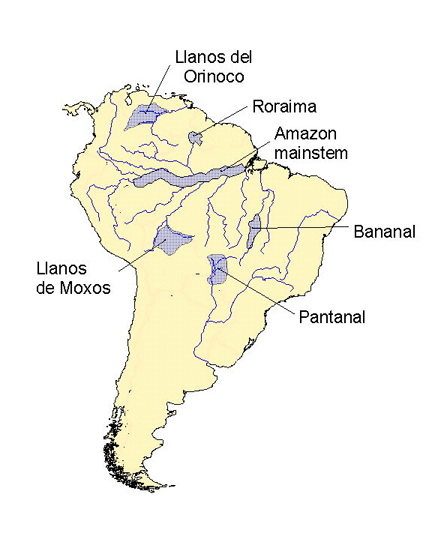
Figure 1. Map of South America showing the locations of the six floodplain regions considered in this study
Data Citation:
Cite this data set as follows:
Hamilton, S.K., S.J. Sippel, and J.M. Melack. 2011. LBA-ECO LC-07 Monthly Inundated Areas, Amazon, Orinoco and Pantanal Basins: 1978-1987. Data set. Available on-line [http://daac.ornl.gov] from Oak Ridge National Laboratory Distributed Active Archive Center, Oak Ridge, Tennessee, U.S.A. doi:10.3334/ORNLDAAC/1051
Implementation of the LBA Data and Publication Policy by Data Users:
The LBA Data and Publication Policy [http://daac.ornl.gov/LBA/lba_data_policy.html] is in effect for a period of five (5) years from the date of archiving and should be followed by data users who have obtained LBA data sets from the ORNL DAAC. Users who download LBA data in the five years after data have been archived must contact the investigators who collected the data, per provisions 6 and 7 in the Policy.
This data set was archived in December of 2011. Users who download the data between December 2011 and November 2016 must comply with the LBA Data and Publication Policy.
Data users should use the Investigator contact information in this document to communicate with the data provider. Alternatively, the LBA Web Site [http://lba.inpa.gov.br/lba/] in Brazil will have current contact information.
Data users should use the Data Set Citation and other applicable references provided in this document to acknowledge use of the data.
Table of Contents:
- 1 Data Set Overview
- 2 Data Characteristics
- 3 Applications and Derivation
- 4 Quality Assessment
- 5 Acquisition Materials and Methods
- 6 Data Access
- 7 References
1. Data Set Overview:
Project: LBA (Large-Scale Biosphere-Atmosphere Experiment in the Amazon)
Activity: LBA-ECO
LBA Science Component: Land Use and Land Cover
Team ID: LC-07 (Melack / Novo / Forsberg)
The investigators were Melack, John M.; Hamilton, Stephen K. and Sippel, Suzanne J. You may contact Gastil-Buhl, Mary (Gastil) (gastil@lifesci.ucsb.edu).
LBA Data Set Inventory ID: LC07_SMMR_Inundated_Area
This data set provides the monthly record of inundated area, in square km, for six floodplain regions in South America. The data are derived from the SMMR (Scanning Multichannel Microwave Radiometer) sensor images acquired from December 1978 to August 1987. There are two comma-delimited (.csv) ASCII data files containing the monthly inundation area values, seventeen ESRI Shape files containing region bounding polygons, and two .csv files containing information about the region bounding polygons and latitude/longitude vertices.
Related data set:
- LBA-ECO LC-07 Monthly Mean Flooded Wetlands Habitat, Central Amazon Basin: 1979-1996 (This Passive Microwave data set was used to calculate the Monthly Flooded areas in the related data set.)
2. Data Characteristics:
This data set contains five data files: two comma-delimited (.csv) ASCII data files providing the monthly inundation area values for six floodplain and open water regions in South America; a compressed (.zip) file providing seventeen ESRI Shape files for the region bounding polygons; and two .csv files providing information about the region bounding polygons and latitude/longitude verticies.
File 1. LC07_all_SMMR_regions_monthly.csv
This file provides a monthly record of total inundated area (inundated floodplain plus open water of rivers and lakes), in square km, in each of the six floodplain regions in South America: (1) mainstem Amazon River floodplain in Brazil; (2) Llanos de Mojos (Beni and Mamore rivers) in Bolivia; (3) Bananal Island (Araguaia River) in Brazil; (4) Roraima savannas (Branco and Rupununi rivers) in Brazil and Guyana; (5) Llanos del Orinoco (Apure and Meta rivers) in Venezuela and Colombia; and (6) Pantanal wetland (Paraguay River) in Brazil. Area estimates include permanent open water as well as land subject to seasonal inundation.
| Column | Heading | Units/format | Description |
|---|---|---|---|
| 1 | Date | mon-YY | Sample date as month-year (format in original data file) |
| 2 | Month | mm | Sample month as 2-digit numeric (mm) |
| 3 | Month_c | mon | Sample month as 3-character alpha abbreviation |
| 4 | Year | yyyy | Sample year as 4-digit numeric (yyyy) |
| 5 | Amazon | km2 | Floodplain and open water area in the Amazon floodplain, reported in km2 |
| 6 | Pantanal | km2 | Floodplain and open water area in the Pantana floodplain, reported in km2 |
| 7 | Orinoco | km2 | Floodplain and open water area in the Orinoco floodplain, reported in km2 |
| 8 | Bolivia | km2 | Floodplain and open water area in the Bolivia floodplain, reported in km2 |
| 9 | Bananal | km2 | Floodplain and open water area in the Bananal floodplain, reported in km2 |
| 10 | Roraima | km2 | Floodplain and open water area in the Roraima floodplain, reported in km2 |
| Notes: Date columns 2-4 were added to ensure proper
translation of dates when importing from csv to spreadsheet formats. The column heading Bolivia refers to the Llanos de Mojos (also spelled as Moxos) savanna region located in the upper Madeira River watershed in northeastern Bolivia. | |||
| There are no missing values | |||
Example Data Record:
|
Date, Month, Month_c, Year, Amazon, Pantanal, Orinoco, Bolivia, Bananal, Roraima Jan-79, 1, Jan, 1979, 41968, 81741, 12092, 44020, 23340, 280 Feb-79, 2, Feb, 1979, 41415, 101550, 11571, 55937, 53830, 270 Mar-79, 3, Mar, 1979, 52548, 94908, 14068, 71003, 50140, 3790 Apr-79, 4, Apr, 1979, 53748, 87570, 14449, 67155, 29080, 2900 May-79, 5, May, 1979, 65087, 88198, 16997, 49262, 12950, 2330 ... |
File 2. LC07_SMMR_Mainstem_bounds_of_reaches.csv
The Amazon River mainstem and its flood plains were cut
into twelve segments, called reaches. This file shows the pixels used
in the Amazon River floodplain area analysis. The pixels are denoted as
R1, R2 .. R12 corresponding to the reaches included in the analyses.
For example, all cells containing R5 are in Reach 5. Geographic
coordinates of a cell correspond to that cell's upper left hand corner
(NW corner). Grid cells are 0.25 degrees x 0.25 degrees "equal angle"
areas.
Example data record:
|
, longitude ---> , -----------------reach 1------------------- latitude,,,,,, degrees,70,70,70,69,69,69 south,0.5,0.25,0,0.75,0.5,0.25 1,,,,,, 1.25,,,,,, 1.5,,,,,, 1.75,,,,,, 2,,,,,, 2.25,,,,,, 2.5,,,,,, 2.75,,,,,, 3,,,,,, 3.25,,,,R1,R1 3.5,,,,R1,R1 3.75,R1, R1,R1,R1 4,R1,R1,R1,R1, 4.25,,R1,R1,R1, 4.5,,,,,, 4.75,,,,,, ... |
File 3. LC07_SMMR_Amazon_flooded_area_by_reach.csv
Monthly Amazon River mainstem floodplain and open water total inundated area by reach, determined from SMMR passive microwave data acquired from December 1978 through August 1987. Area estimates include permanent open water as well as land subject to seasonal inundation. The results are presented separately for 12 longitudinal reaches along the Amazon River mainstem in Brazil. The reaches are described in Sippel et. al. (1998) and shown in Figures 2 and 3.
| Column | Heading | Units/Format | Description |
|---|---|---|---|
| 1 | Date | mon-YY | Sample date as month-year (format in original data file) |
| 2 | Month | mm | Sample month as 2-digit numeric (mm) |
| 3 | Month_c | mon | Sample month as 3-character alpha abbreviation |
| 4 | Year | yyyy | Sample year as 4-digit numeric (yyyy) |
| 5 | Reach_1 | km2x1000 | Flooded area for Reach 1, in km2 * 1,000 |
| 6 | Reach_2 | km2x1000 | Flooded area for Reach 2, in km2 * 1,000 |
| 7 | Reach_3 | km2x1000 | Flooded area for Reach 3, in km2 * 1,000 |
| 8 | Reach_4 | km2x1000 | Flooded area for Reach 4, in km2 * 1,000 |
| 9 | Reach_5 | km2x1000 | Flooded area for Reach 5, in km2 * 1,000 |
| 10 | Reach_6 | km2x,000 | Flooded area for Reach 6, in km2 * 1,000 |
| 11 | Reach_7 | km2x1000 | Flooded area for Reach 7, in km2 * 1,000 |
| 12 | Reach_8 | km2x1000 | Flooded area for Reach 8, in km2 * 1,000 |
| 13 | Reach_9 | km2x1000 | Flooded area for Reach 9, in km2 * 1,000 |
| 14 | Reach_10 | km2x1000 | Flooded area for Reach 10, in km2 * 1,000 |
| 15 | Reach_11 | km2x1000 | Flooded area for Reach 11, in km2 * 1,000 |
| 16 | Reach_12 | km2x1000 | Flooded area for Reach 12, in km2 * 1,000 |
Notes: Date columns 2-4 were added to ensure proper translation of dates when importing from csv to spreadsheet formats. There are no missing values.
Example Data Record:
| Date,Month, Month_c, Year, Reach_1, Reach_2, Reach_3, Reach_4, Reach_5,
Reach_6, Reach_7, Reach_8, Reach_9, Reach_10, Reach_11, Reach_12 Dec-78, 12, Dec, 1978, 1.15, 1.27, 2.19, 4.29, 3.65, 5.52, 1.27, 1.22, 2.99, 4.12, 5.07, 2.42 Jan-79, 1, Jan, 1979, 1.44, 4.45, 5.91, 3.42, 2.6, 3.54, 1.5, 2.22, 6.23, 4.57, 4.2, 2.09 Feb-79, 2, Feb, 1979, 0.64, 0.65, 2.23, 5, 3.02, 5.04, 2.16, 2.19, 4.52, 5.79, 5.97, 4.5 Mar-79, 3, Mar, 1979, 4.54, 4.67, 6.01, 3.12, 1.03, 5.33, 2.62, 2.97, 7.07, 4.99, 5.3, 5.04 ... |
File 4. LC07_SMMR_region_bounds.csv
The big reaches and the mainstem reaches of the Amazon River (Figure 2) considered in the SMMR study were outlined in 0.25 degree square cells. In this file, the spatial grids were translated into lists of (lat,lon) vertices. The geographic coordinates of a cell correspond to that cell's upper left hand corner (NW corner).
| Column | Heading | Units/Format | Description |
|---|---|---|---|
| 1 | region | text | Name of region or mainstem reach |
| 2 | longitude | decimal degrees | Longitude of a cell (corresponding to that cell's upper left hand or NW corner) |
| 3 | latitude | decimal degrees | Latitude of a cell (corresponding to that cell's upper left hand or NW corner) |
Example data records
| region,longitude,latitude madeira_region,-63.25,-7.75 madeira_region,-63.25,-7.75 madeira_region,-63.25,-7.75 ... purus_region,-65.5,-7.25 purus_region,-65.25,-7.5 purus_region,-65.25,-7 ... mainstem_reach_12,-53.25,-2.5 mainstem_reach_12,-53.75,-2.25 mainstem_reach_12,-53.75,-2.5 ... |
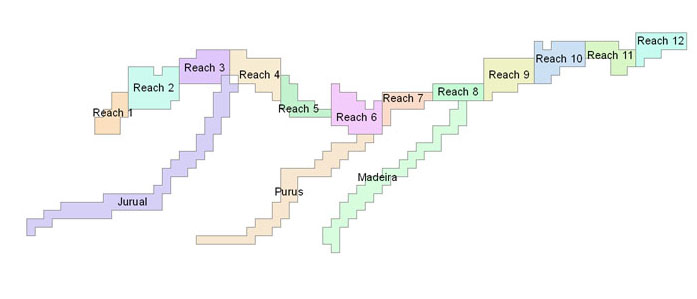
Figure 2. Big reaches (Jurua, Purus, and Madeira) and mainstem reaches (1-12) of the Amazon River considered in this study
Example Data Record:
| region, longitude, latitude madeira_region, -63.25, -7.75 madeira_region, -63.25, -7.25 madeira_region, -63, -7.25 madeira_region, -63, -7 madeira_region, -62.75, -7 ... |
File 5. LC07_SMMR_ESRI.zip
This compressed file contains seventeen ESRI shape files for the study area which includes the Amazon big reaches (Figure 2), mainstem reaches (Figure 3), and Llanos de Mojos region (Figure 4). The coordinate system of the files is: GCS_WGS_1984; Datum: WGS_1984. Note that Reach 12 is not inclusive within the "Mainstem" reach file [mainstem_wof54.shp (West of Longitude 54 W)]. The Roraima region outline is not part of this data file.
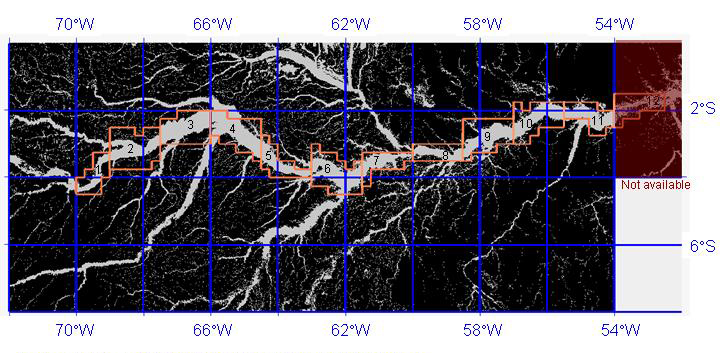
Figure 3. Amazon mainstem reaches. Orange outlines the 12 mainstem reaches used in SMMR analysis (Sippel et al., 1998). Background image is JERS wetlands mask, at about 20:1 resolution (Hess et al., 2003).
Site boundaries:(All latitude and longitude given in decimal degrees)
| Site (Region) | Westernmost Longitude | Easternmost Longitude | Northernmost Latitude | Southernmost Latitude | Geodetic Datum |
|---|---|---|---|---|---|
| Amazon Basin (Amazon Basin) | -80 | -35 | 5 | -18 | World Geodetic System, 1984 (WGS-84) |
| Amazon Mainstem Reaches (1-12) | -70 | -52.5 | -1.5 | -4.5 | World Geodetic System, 1984 (WGS-84) |
| Amazon Big Reach: Madeira Tributary | -63.25 | -59 | -3.5 | -8 | World Geodetic System, 1984 (WGS-84) |
| Amazon Big Reach: Purus Tributary | -67 | -61.75 | -4.5 | -7.75 | World Geodetic System, 1984 (WGS-84) |
| Amazon Big Reach: Jurua Tributary | -72 | -65.75 | -2.75 | -7.5 | World Geodetic System, 1984 (WGS-84) |
| Llanos de Mojos | -68 | -61 | -12 | -16 | World Geodetic System, 1984 (WGS-84) |
| Bananal | -52 | -49.5 | -9 | -15 | World Geodetic System, 1984 (WGS-84) |
| Roraima | -61.5 | -59 | 4.5 | 2.25 | World Geodetic System, 1984 (WGS-84) |
| Llanos del Orinoco | -72 | -66 | 10 | 4 | World Geodetic System, 1984 (WGS-84) |
| Pantanal | -58 | -55 | -16 | -21 | World Geodetic System, 1984 (WGS-84) |
Time period:
- The data set covers the period 1978/12/01 to 1987/08/31
- Temporal Resolution: Monthly
Platform/Sensor/Parameters measured include:
- NIMBUS-7 / SMMR (SCANNING MULTICHANNEL MICROWAVE RADIOMETER) / LAND COVER
3. Data Application and Derivation:
This data set may be applied to modeling the monthly inundation to spread the two-season wetland habitat classification over 12 months. This spatial time series of flooding may be used to compare river-gauge based measures of flooding or to model the relationship between river stage and area inundated.
The relationships between flooded area derived from passive microwave remote sensing and ground observations of river stage reveal the degree to which floodplain inundation is linked to water level in the major rivers associated with the floodplains. This information is increasingly needed to assess the environmental impact of river channel modifications, including impoundments as well as navigation projects.
Information on the mean annual inundation area is also required to estimate rates of trace gas exchange between tropical wetlands and the atmosphere.
Inundation patterns for six South American floodplain regions were revealed by analysis of the 37 GHz polarization difference ( ΔTobs) observed by the Scanning Multichannel Microwave Radiometer (SMMR) on the Nimbus-7 satellite. Flooded area was estimated at monthly intervals from December 1978 through August 1987 for the Amazon mainstem region and from January 1979 through August 1987 for the other five regions using mixing models that account for the major landscape units with distinctive microwave emission characteristics.
4. Quality Assessment:
The algorithms for estimating the fractional area of inundation from the 37 GHz ΔTobs are described by Sippel et al. (1994) and Hamilton et al. (1996). Error in the estimation of flooded area can arise from the five different input terms in the equation. Sippel et al. (1994) performed a sensitivity analysis individually for each term, choosing a typical annual cycle of flooded area for the entire Amazon mainstem, to demonstrate the sensitivity of the algorithm to errors in the input terms. The possible effect of error in ΔTobs and ΔTnf (ΔT value for nonflooded land) was evaluated by taking the standard deviation of 1,768 observations over upland areas (1.0 K) as an estimate of the overall precision for both of these terms. This may overestimate random instrument error or atmospheric variability because it incorporates any temporal variability in emission from the upland areas, although similar variability in the SMMR ΔTobs has been observed over stable regions of the Antarctic ice sheet (Gloersen et al., 1992), suggesting that instrument variability is the primary cause. Errors in the ΔTw (ΔT for open water), ΔTf (ΔT for seasonally flooded land), and fw (fractional area of open water) are indeterminate, so those terms were varied by arbitrary amounts in the sensitivity analysis.
The long-term inundation area record based on the prediction of flooded area from river stage was also examined (Figure 8 in Hamilton et al., 2002). The record provided an indication of interannual variability in flooded area. Long-term means for inundation area in these extended records resemble the means for the 9-year SMMR period, except for the Pantanal where the long-term mean is considerably lower. The correlation between flooded area and river stage was used to extend the inundation records over a 30-year period in the Mojos (1967–97) and a 58-year period (1927–85) in the Orinoco (Hamilton et al., 2004). Interannual variability in inundation is greater in the Mojos than the Orinoco. However, comparison of these data with a previously published analysis of the Pantanal wetland (Hamilton et al., 1996) showed that inundation patterns in these two floodplain regions were not as variable across years as they were in the Pantanal. The flood pulse is typically unimodal in most of the Pantanal (Hamilton, 2002), although more erratic patterns are often observed in the flood plains of the southern Pantanal, particularly those affected by the Miranda and Aquidauana rivers. Areas flooded by the Paraguay River show the most regular, predictable flood pattern.
5. Data Acquisition Materials and Methods:
Study Regions
The locations of the six floodplain regions analyzed in this study are depicted in Figure 1. All of these floodplains lie at low elevations (<250 m) where the climate is tropical and humid, although the precipitation is seasonal. Together these floodplain regions comprise much of the total floodplain area in the continent.
The Amazon River mainstem site represents the floodplain fringing the mainstem within Brazil (known as the Solimoes and Amazonas rivers), extending from the western Brazilian border (70 W) to the mouth. Tributary floodplains are not included except in the immediate vicinity of confluences. The Amazon River floodplain is largely covered with evergreen forest although more open grasslands become abundant below Santarem. The seasonal cycle of river discharge is attenuated by the differential timing of runoff from Andean watersheds as well as lowland watersheds on both sides of the equator. The mean annual discharge of the Amazon River at Obidos is 162,000 m3/s and the annual fluctuation in stage is 7–10 m. Mean annual precipitation varies across the Amazon Basin, averaging ca. 2,300 mm. Details on methods and results for analysis of passive microwave observations of the mainstem Amazon floodplain are available in Sippel et al. (1998).
The Amazon big reaches include the following tributaries: Madeira, Purus, and Jurua rivers.
The Llanos de Mojos (also spelled as Moxos) is a savanna region located in the upper Madeira River watershed in northeastern Bolivia, mostly between the Beni, Mamore, and Guapore (or Itenez) rivers. In this region, the natural vegetation tends to be evergreen forest in areas that are not subject to seasonal inundation, and inundation tends to maintain grassland or savanna vegetation. The Beni and Mamore rivers drain montane watersheds of the Andes and carry mean annual discharges of 9,000 and 8,400 m3/s, respectively, while the Guapore River drains lower elevations to the east in Bolivia and Brazil and carries a mean annual discharge of 2,100 m3/s [Guyot and Wasson, 1994]. River discharge is strongly seasonal and results in large fluctuations in water level, reaching 11 m in the Mamore River channel, although the river channels are incised into the plains and the depth of inundation in most of the savanna areas remains <1 m. Mean annual precipitation varies from 1,300 to 2,000 mm across the region, occurring mostly between September and May. Details on methods and results for analysis of passive microwave observations of the Mojos region can be found in Hamilton et al. (2004).
The Bananal floodplain is located in east-central Brazil along the Araguaia River, a tributary of the Tocantins River. Much of this floodplain is on the Bananal Island, which lies between two anabranches of the Araguaia River, but there is also extensive contiguous floodplain upriver of the island to 15 S latitude. The Araguaıa River carries a mean annual discharge of 1,680 m3/s. The floodplain vegetation is largely savanna, while surrounding uplands tend to be covered by tropical moist forest to the north and west, and savanna (much converted to agriculture) to the south and east. Annual rainfall averages 1,700 mm and is strongly seasonal. The Araguaia River stage varies by about 5 m over the seasonal cycle, but most of the floodplain is inundated to only 1–2 m depth or less.
The floodplains of Roraima include the savanna areas of Roraima State in northern Brazil as well as the contiguous Rupununi savannas of Guyana. Most of this territory lies within the watershed of the upper Branco River, a tributary of the Negro River that carries a mean annual discharge of 2,900 m3/s at the outflow from the region. The Rupununi savannas lie in the watershed of the Rupununi River, a smaller river that flows north into the Essequibo River. As in the Llanos de Mojos, the presence of savanna in this region tends to indicate seasonal inundation while areas without seasonal inundation tend to be evergreen forest, although human activities may have increased the extent of grassland at the expense of forest. Floodplain vegetation includes nearly treeless grasslands as well as Mauritia palm swamps. Much of the savanna floodplain is associated with several smaller tributary rivers that have distinct upland watersheds, including the Surumu and Parime rivers. The seasonal fluctuations in stage of these tributary rivers are unknown; the Branco River at Boa Vista varies by about 6 m over the annual cycle. Rainfall averages about 1,700 mm and is highly seasonal, with a marked dry season.
The Llanos del Orinoco is a region of alluvial plains between the Orinoco River and the Andean foothills. The climate here tends to support savanna vegetation regardless of whether seasonal inundation occurs, but in this study the Llanos del Orinoco region is defined as the lower-lying savanna areas that are subject to seasonal inundation. The floodplains of this region are drained by two major tributaries of the Orinoco River, both of which originate in the Andes: the Apure River (mean annual discharge, 2,300 m3/s) and the Meta River (5,600 m3/s). The Orinoco mainstem fluctuates by 10–15 m over the annual cycle, but tributary stage fluctuations are lesser within the Llanos where the floodplains absorb the excess discharge. Mean annual precipitation in the region is about 1,500 mm and is strongly seasonal. Details on methods and results for analysis of passive microwave observations of the Llanos del Orinoco can be found in Hamilton et al. (2004).
The Pantanal wetland is located on the upper Paraguay River, mostly in Brazil with smaller areas in Bolivia and Paraguay. The Pantanal is a complex of river floodplains lying in a vast sedimentary basin filled by the deposition of alluvial fans from several tributaries. Inundation patterns in the region vary depending on the source of floodwaters (e.g., overbank flow from rivers vs. delayed drainage of precipitation) as well as backwater effects due to the limited capacity of the river channels to convey the seasonal floodwaters. The Paraguay River drains the region and flows south to the Parana River; in the southern Pantanal the river carries a mean annual discharge of ca. 2,500 m3/s and fluctuates in stage by about 5 m. The Pantanal supports a variety of savanna and emergent marsh vegetation; upland areas that are not subject to inundation are generally savanna vegetation although much has recently been converted to agriculture. Annual rainfall is 1,000–1,500 mm and is seasonal. Details on the methods and results for analysis of passive microwave observations of the Pantanal can be found in Hamilton et al. (1996, 2004).
SMMR Data
The monthly SMMR data used in this data set were drawn from the global data set of 37 GHz observations that were originally described by Choudhury (1989, 1991). The SMMR instrument operated on board the Nimbus-7 satellite and measured the natural emission of microwave energy from the Earth’s surface and atmosphere. The SMMR observations, expressed as brightness temperatures (in degree Kelvin) and available at several frequencies and at both vertical and horizontal polarizations, were obtained from January 1979 through August 1987. The difference between vertically and horizontally polarized brightness temperatures observed by satellite at the 37 GHz frequency (ΔTobs) provided a sensitive indicator of the presence of surface water, particularly where water occurs against a background of vegetated land surfaces. The spatial resolution of the SMMR sensor was approximately 27 km at 37 GHz. The processed global data set was gridded into cells of 0.25 latitude by longitude.
The global SMMR observations were available for approximately 6-day intervals, and were compiled separately for day and night (local equator crossings at noon and midnight). After calculation of ΔTobs for each grid cell from the daytime brightness temperatures, the observations were ranked within each month and the second lowest value (out of 4 or 5) was selected, thereby yielding one ΔTobs value per month (Choudhury, 1989; Sippel et al., 1994). This screening served to eliminate outlying values that might have resulted from atmospheric scattering by heavy rainfall, or from temporary pooling of water on the land surface after heavy rainfalls.
Regional Boundary Delineation
The approximate boundaries of the floodplains were delineated using maps, remote sensing, and scientific publications, and by examination of the SMMR data for evidence of inundation. In the Llanos de Mojos, Llanos del Orinoco, and Pantanal, the subregions correspond approximately with hydrogeomorphic provinces, although the subregion boundaries are dictated by the coarse resolution of the SMMR data. The boundaries were altered in some cases to avoid crossing or bordering major openwater features such as the largest floodplain lakes or river channels. In the cases of the Amazon and Bananal floodplains, subregions reflect arbitrary subdivisions along the direction of river flow, and the Roraima floodplains were analyzed as a single region because of their relatively small extent. Regional and subregional boundaries were chosen to encompass the floodplain subject to inundation and therefore include some upland area along the outer edges. See Hamilton et al. (2002) for additional information.
Analysis
The approach to determine inundation area from the SMMR ΔTobs has been described in detail by Hamilton et al. (1996, 2002, 2004) and Sippel et al. (1998). The fractional inundation area within an aggregate of SMMR grid cells was estimated using linear mixing models that account for the microwave emission of the major landscape units, or end-members, within the subregion (Sippel et al., 1994). The model has three end-members that represented the contributions of water, nonflooded land, and inundated floodplain to the ΔTobs. The fractional area of open water was assumed to vary little over the annual cycle, and was measured from maps or remote sensing imagery. The fractional area of flooded land expanded during inundation with a concomitant reduction in the fractional area of nonflooded land, which included nonflooded floodplain as well as any upland area within the grid-cell aggregate.
The fractional inundation area was calculated for each monthly ΔTobs observation using equations and methods described in Hamilton et al. (2003). Inundation areas of the subregions were summed to yield the total inundation area for the region. Inundation area included the permanent open-water area of river channels and floodplain lakes unless noted. Concurrent data on river levels (stage) from sites with long records were examined to produce predictive relationships between river stage and flooded area for each region. See Hamilton et al. (1996, 2002, 2004) and Sippel et al. (1998) for site-specific methods.
6. Data Access:
This data is available through the Oak Ridge National Laboratory (ORNL) Distributed Active Archive Center (DAAC).
Data Archive Center:
Contact for Data Center Access Information:
E-mail: uso@daac.ornl.gov
Telephone: +1 (865) 241-3952
7. References:
Choudhary, B.J. 1989. Monitoring global land surface using Nimbus-7 37 GHz data: theory and examples. International Journal of Remote Sensing 10: 1579-1605.
Choudhary, B.J. 1991. Passive microwave remote sensing contribution to hydrological variables. Surveys in Geophysics. 13: 63-84.
Hamilton, S.K., S.J. Sippel, and J.M. Melack. 1996. Inundation patterns in the Pantanal wetland of South America determined from passive microwave remote sensing. Archiv fur Hydrobiologie, 137 (1): 1-23.
Hamilton, S.K., Sippel, S.J., and J.M. Melack. 2002. Comparison of Inundation Patterns among major South American Floodplains. Journal of Geophysical Research-Atmospheres, 107(D20): Article-8038.
Hamilton, S.K., S.J. Sippel, and J.M. Melack. 2004. Seasonal inundation patterns in two large savanna floodplains of South America: the Llanos de Moxos (Bolivia) and the Llanos del Orinoco (Venezuela and Colombia). Hydrological Processe, 18(11): 2103-2116.
Hess, L.L., J.M. Melack, E.M.L.M. Novo, C.C.F. Barbosa, and M. Gastil. 2003. Dual-season mapping of wetland inundation and vegetation for the central Amazon basin. Remote Sensing of Environment, 87: 404–428.
Sippel, S.J., Hamilton,S.K., and Melack, J.M. 1991. Inundation area and morphometry of lakes on the Amazon River floodplain, Brazil. Arch. Hydrobiol. 123: 385-400.
Sippel, S.J., S.K. Hamilton, J.M. Melack, and B.J. Choudhary. 1994. Determination of inundation area in the Amazon River floodplain using the SMMR 37 GHz polarization difference. Remote Sensing of Environment 48: 70-76.
Sippel, S.J., S.K. Hamilton, J.M. Melack, and E.M.M. Novo. 1998. Passive microwave observations of inundation area and the area/stage relation in the Amazon River floodplain. International Journal of Remote Sensing, 19(16): 3055-3074.
Related Publications
Justice, C.O., J.R.G. Townsend, and B.J. Choudhary. 1989. Comparison of AVHRR and SMMR data for monitoring vegetation phenology on a continental scale. International Journal of Remote Sensing 10: 1607-1632.
Hamilton, S.K. 2002. Hydrological controls of ecological structure and function in the Pantanal wetland (Brazil), pp. 133-158. IN: McClain, M.E. (ed.). The Ecohydrology of South American Rivers and Wetlands. International Association of Hydrological Sciences, 209 pp.
Ribeiro, M.N.G., and J. Adis. 1984. Local rainfall variability-a potential bias for bioecological studies in the central Amazon. Acta Amazonica 14: 159-174.