Get Data
Summary:
This data set contains chlorophyll concentration maps of the Amazon River floodplain region from Parintins (Amazonas) to Almeirim (Para). These chlorophyll fraction maps were derived from the Moderate Resolution Imaging Spectroradiometer (MODIS) surface reflectance product (MOD09) for 19 months from April 2002 to December 2003.
The study was conducted in a floodplain reach upstream from Santarem, Para, in order to assess seasonal changes in phytoplanktonic chlorophyll-a distributions in the floodplain Lake Curuai. MODIS reflectance data were acquired at four river stages: rising (April), high (June), decreasing (September), and low (November). Chlorophyll maps were derived and used to compute the weighted average of chlorophyll concentration from MODIS images in the region. Field measurements of suspended inorganic matter and chlorophyll-a in Lake Curuai were made almost concurrently with satellite overpasses (Barbosa, 2005). The images and the estimated chlorophyll concentrations were compared to measured chlorophyll concentrations at control points for different hydrological states. This data set may be applied to better understand the seasonal dynamics of primary production of the Amazon floodplains. The maps of chlorophyll-a concentration may be used to model spatial and temporal variations of primary production in this region.
The monthly chlorophyll-a maps are provided as GeoTIFF files. There are two formats: (1) color-mapped pixels and (2) pixels as chlorophyll-a concentrations. These latter images are not intended for browsing. These images have pixel values that are the chlorophyll-a concentration in mg/m3 and need to be download and opened in GIS software.
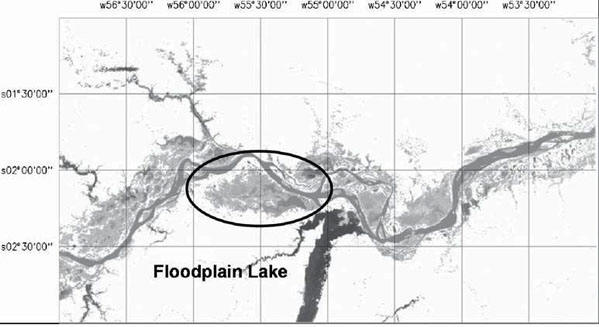
Figure 1. Study area and test site location. Curuaí Lake was the test site used to calibrate the model to map the chlorophyll distribution in the study area (Nova, 2006).
Data Citation:
Cite this data set as follows:
Novo, E.M.L.M., C.C.F. Barbosa, R.M. Freitas, Y.E. Shimabukuro, J.M. Melack, W.P. Filho. 2011. LBA-ECO LC-07 Amazon Floodplain Lake Chlorophyll from MODIS, Para, Brazil: 2002-2003. Data set. Available on-line [http://daac.ornl.gov] from Oak Ridge National Laboratory Distributed Active Archive Center, Oak Ridge, Tennessee, U.S.A. doi:10.3334/ORNLDAAC/1000
Implementation of the LBA Data and Publication Policy by Data Users:
The LBA Data and Publication Policy [http://daac.ornl.gov/LBA/lba_data_policy.html] is in effect for a period of five (5) years from the date of archiving and should be followed by data users who have obtained LBA data sets from the ORNL DAAC. Users who download LBA data in the five years after data have been archived must contact the investigators who collected the data, per provisions 6 and 7 in the Policy.
This data set was archived in March of 2011. Users who download the data between March 2011 and February 2016 must comply with the LBA Data and Publication Policy.
Data users should use the Investigator contact information in this document to communicate with the data provider. Alternatively, the LBA Web Site [http://lba.inpa.gov.br/lba/] in Brazil will have current contact information.
Data users should use the Data Set Citation and other applicable references provided in this document to acknowledge use of the data.
Table of Contents:
- 1 Data Set Overview
- 2 Data Characteristics
- 3 Applications and Derivation
- 4 Quality Assessment
- 5 Acquisition Materials and Methods
- 6 Data Access
- 7 References
1. Data Set Overview:
Project: LBA (Large-Scale Biosphere-Atmosphere Experiment in the Amazon)
Activity: LBA-ECO
LBA Science Component: Land Use and Land Cover
Team ID: LC-07 (Melack / Novo)
The investigators were Melack, John M.; Novo, Evlyn Marcia Leao de Moraes; Barbosa, Claudio; Filho, Waterloo Pereira; Freitas, Ramon Morais and Shimabukuro, Yosio Edemir . You may contact Novo, EMLM (for science) (evlyn@ltid.inpe.br) and Gastil-Buhl, M. (for data) (mary@icess.ucsb.edu)
LBA Data Set Inventory ID: LC07_Lake_Chlorophyll_MODIS
This data set includes a time series of chlorophyll maps of a section of the Amazon river and floodplains. The estimates provided are based on a linear mixing model derived from samples collected in the Lago Grande de Curuai lake and applied to MODIS reflectance values.
Related Data Sets
- LBA-ECO LC-07 Central Amazon Wetlands Mask, 100 m, version 0 (Mask used to to limit the analysis to the floodplain)
- LBA-ECO LC-07 Bathymetric Survey of Floodplain Lake, Lago Curuai, Para, Brazil: 2004 (same floodplain)
2. Data Characteristics:
Images are provided for 19 months from April 2002-December 2003.
The monthly chlorophyll maps are provided as GeoTIFF files. There are two formats: (1) color-mapped pixels and (2) pixels as chlorophyll-a concentrations. These latter images have pixels in floating point (32 bit/pixel; binary values) and are not intended for browsing. Download these and open in GIS software such as ENVI, SPRING, or ArcGIS.
The GeoTIFF files are georeferenced by their upper left hand corner coordinate (57W, 1S). Pixels are equal-angle, in geographic LAT/LON, not map projected. Pixel size is 0.00225 degrees.
Also, the 19 "pixels as chlorophyll-a concentration" maps have been combined into a single 19 band GeoTIFF file.
Files:
RIO_MasCla_PHYChl_mmmyyyy.tif:
There are 19 color-scaled images where mmmyy is the month and year.
These color mapped images use the color legend as in Novo, 2006. Each of the color_scaled GeoTIFF images has 3 bands as rgb. The DN of the pixels indicate the color and the colors are quantized as in the legend. These color-mapped images have corresponding "actual chl-a concentrations in mg/m3". The GeoTIFF files are described below.
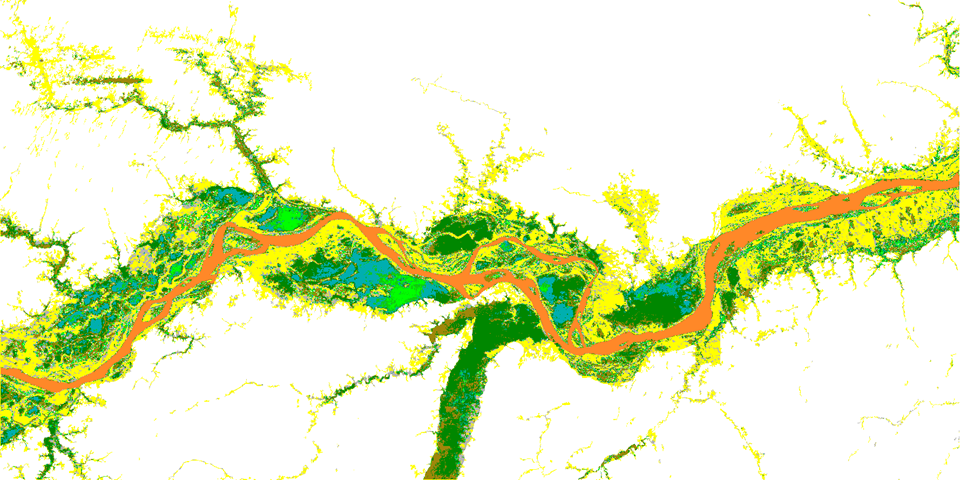
Figure 2. Chlorophyll concentrations in the floodplain region of Lake Curuai, April 2003. Chlorophyll maps were derived and used to compute the weighted average of chlorophyll concentration from MODIS reflectance values.
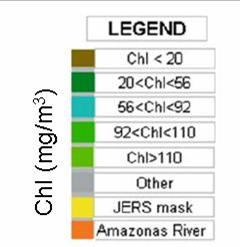
Figure 3. Legend shows the color-mapped chlorophyll value classes, wetlands, and river areas.
PHYTO_Chl_mmm_yyyy.tif:
There are 19 GeoTIFF files with pixels in floating point file format where mmm_yyyy is the month and year. These 32 bit pixel values are modelled chlorophyll-a concentration in mg/m3. To display these images a 0 to 255 linear stretch is recommended.
PHYTO_Chl_X.tif: This file has the 19 separate "pixels as chlorophyll-a concentration" files combined into a single GeoTIFF file with 19 bands.
Site boundaries: (All latitude and longitude given in decimal degrees)
| Site (Region) | Westernmost Longitude | Easternmost Longitude | Northernmost Latitude | Southernmost Latitude | Geodetic Datum |
|---|---|---|---|---|---|
| Para Western (Santarem) - Lago Curuai (Para Western (Santarem)) | -57 | -52.9995 | -1 | -3.00025 | World Geodetic System, 1984 (WGS-84) |
Time period:
- The data set covers the period 2002/04/01 to 2003/12/31
- Temporal Resolution: monthly
Platform/Sensor/Parameters measured include:
- TERRA (MORNING EQUATORIAL CROSSING TIME SATELLITE) / MODIS (MODERATE-RESOLUTION IMAGING SPECTRORADIOMETER) / WETLANDS
- TERRA (MORNING EQUATORIAL CROSSING TIME SATELLITE) / MODIS (MODERATE-RESOLUTION IMAGING SPECTRORADIOMETER) / CHLOROPHYLL
- TERRA (MORNING EQUATORIAL CROSSING TIME SATELLITE) / MODIS (MODERATE-RESOLUTION IMAGING SPECTRORADIOMETER) / LAKES
3. Data Application and Derivation:
This data set may be applied to better understand the seasonal dynamics of primary production of the Amazon floodplains. The maps of chlorophyll-a concentration may be used to model spatial and temporal variations in primary production in this region.
Three specific sources of data were used to derive this dataset. (1) MODIS / Terra - MOD09 product was used to map chlorophyll concentration. Medium resolution (250m x 250m) monthly images, MOD 09 Level 2 G Validated Version 3. (2) Chlorophyll field measurements, published in Barbosa, 2005, were used to calibrate the empirical mapping algorithm. (3) The MODIS data set was masked using a wetland mask (Hess et al. 2003) to limit the analysis to the floodplain. The Wetlands mask of the Central Amazon is a data set archived for this same LC-07 project.
4. Quality Assessment:
The regression equation expresses a nonlinear relationship between Chl and the phytoplankton fraction image. The standard error of estimate provided by the model is 19 mg m-3 and the adjusted R2 is 0.76; i.e., the model predicts, with an error of about 25%, chlorophyll concentration in the range between 10 and 120 mg m-3 in areas with suspended inorganic particle (ip) concentrations of 52 +/- 23 mg l-1. This range corresponds to digital numbers (DN) equivalent to chlorophyll fraction from 40 to 180.
To validate the empirical model suitability, it was applied to the image and the estimated chlorophyll concentration was compared to measured chlorophyll concentrations at control points for different hydrological states. There was a good agreement between the estimated and the measured chlorophyll concentration within the defined boundary conditions, which suggests that the model allows estimating the chlorophyll distribution provided that the class intervals are large enough to accommodate model variability.
5. Data Acquisition Materials and Methods:
Three specific sources of data were used to derive this dataset as described in Novo, 2006. (1) MODIS / Terra - MOD09 product was used to map chlorophyll concentration. Medium resolution (250m x 250m) monthly images, MOD 09 Level 2 G Validated Version 3. (2) Chlorophyll field measurements, published in Barbosa, 2005, were used to calibrate the empirical mapping algorithm. (3) The MODIS data set was masked using a wetland mask (Hess et al. 2003) to limit the analysis to the floodplain. The Wetlands mask of the Central Amazon is a data set archived for this same LC-07 project.
Site Description:
Curuaí Lake is composed of several depressions, which at high water coalesce
into Lago Grande de Curuaí (1.5°S 55.43°W). It is located along the Amazon
River, 900 km upstream from the river mouth at the Atlantic Ocean (Novo et al.
2006). The Amazon and the Tapajos rivers are the major sources of water to this
floodplain. The lake receives different types of water, i.e., white water from
the Amazon River during the overflow stage and black and clear water from the
local catchments during the low stage (Barbosa 2005). The lake’s ecology is
modulated by fluctuations in Amazon River water level.
Field Sampling:
From 2003 to 2004, field campaigns were undertaken to measure the concentrations of optically active components in Curuaí Lake. The campaigns spanned the seasonal changes in the Amazon River’s hydrograph. The average time spent on each campaign was 10 days, with about seven stations sampled per day. The mean daily average concentrations of chlorophyll remained relatively constant during the period of each campaign (Barbosa, 2005).
To guide sampling, MOD 09 images were downloaded from the Land Processes Distributed Active Archive Center (LP DAAC), located at the U.S. Geological Survey EROS Data Center (http://LPDAAC.usgs.gov), before each field campaign to ensure that a representative range of chlorophyll concentrations was sampled. The position of samples was defined by examining historical Landsat-TM images representative of each water stage. For each date, at least 70 sites covering the entire lake were identified for determination of the concentration of chlorophyll (Chl), suspended inorganic particles (ip), and dissolved organic carbon (DOC).
MODIS (MOD09) Data Processing:
The MODIS data set was first masked to limit the analysis to the Amazonian floodplain study location.
With the aid of Lake Curuai field samples of the 4 optically active components from open water, a series of prospective end-member pixel
samples were selected to run a linear mixing model. Candidate end-member pixels were selected to decompose the MODIS data into proportions
of reflected signals for each optically active component. It was determined that 3 end-members were appropriate; water (w), phytoplankton (phy), and inorganic particles (ip).
From this, a linear mixing model was developed that incorporated the three optically active components to the reflectance values of each MODIS band. From one MODIS image,
an empirical model was derived relating chlorophyll concentration measured in Lake Curuai to the phytoplankton (phy) contribution of the MODIS reflectance signal at a given pixel.
Finally, this model was applied to the phytoplankton fraction images derived from the MOD09 data to compute the weighted average chlorophyll concentration in the region from Parintins (Amazonas)
to Almeirin (Para) for 19 MODIS images from 2002 – 2003.
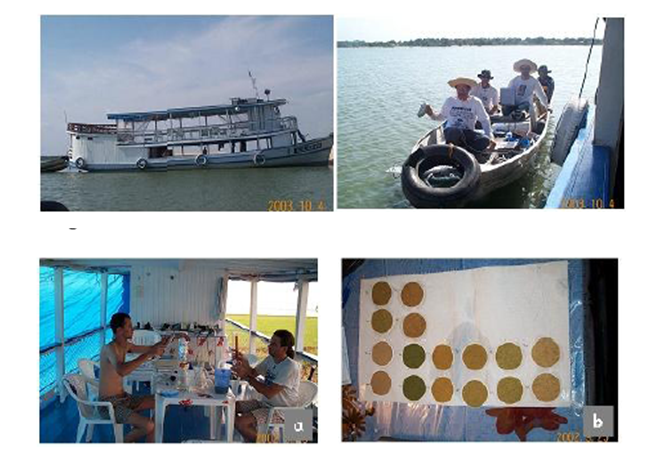
Figure 4. Field sampling in the floodplain Lake Curuai. From Barbosa, 2005.
6. Data Access:
Data are available through the Oak Ridge National Laboratory (ORNL) Distributed Active Archive Center (DAAC).
Data Archive Center:
Contact for Data Center Access Information:
E-mail: uso@daac.ornl.gov
Telephone: +1 (865) 241-3952
7. References:
Barbosa CCF (2005) Sensoriamento remoto da dinamica de circulao da agua do sistema planaAcie de CuruaiaA/Rio Amazonas. PhD thesis. National Institute for Space Research (INPE), Sao Jose dos Campos, Brazil.
Hess LL, Melack JM, Novo ELM, Barbosa CCF, Gastil M (2003) Dual season mapping of wetland inundation and vegetation for the central Amazon basin. Remote Sens Environ 87:404-428.doi:10.1016/j.rse.2003.04.001
Kirk JTO (1994) Light and photosynthesis in aquatic ecosystems, 2nd edn. Cambridge University Press, Cambridge. doi:10.1017/CBO9780511623370
Novo EMLD, Barbosa CCD, de Freitas RM, Shimabukuro YE, Melack JM, Pereira W. (2006) Seasonal changes in chlorophyll distributions in Amazon floodplain lakes derived from MODIS images. Limnology, 7, 153-161. doi:10.1007/s10201-006-0179-8
Nush EA (1980) Comparison of different methods for chlorophyll and phaeopigment determination. Arch Hydrobiol 4:14–36