Get Data
Summary:
This data set reports measurements of aquatic macrophyte biomass, phenology, leaf characteristics, and length and diameter of stems of both submerged and unsubmerged macrophytes. Data were collected from sites in the Monte Alegre Lake region on the eastern Amazon River floodplain in Para, Brazil. Ten field surveys were made at approximately monthly intervals from December 2003 to November 2004. There is one comma-delimited data file with this data set.
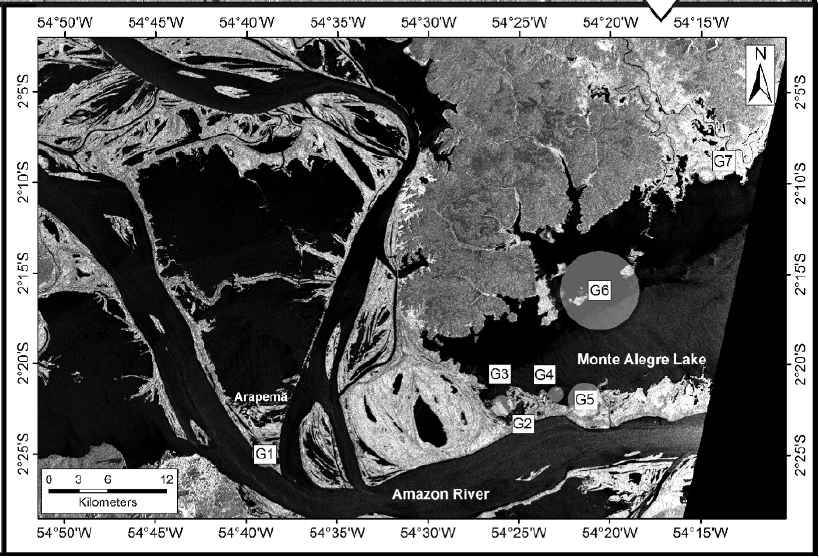
Figure 1. General region of macrophyte productivity studies in the Amazon River floodplain and expanded view of Monte Alegre Lake showing seven of the sampling sites. Shaded circles represent the maximum radius covered by sampling points at each location. From Silva et al., 2009.
Data Citation:
Cite this data set as follows:
Silva, T.S.F., D. Silva, M.P.F. Costa, and J.M. Melack. 2012. LBA-ECO LC-07 Aquatic Macrophyte Biomass, Monte Alegre Lake, Para, Brazil: 2003-2004. ORNL DAAC, Oak Ridge, Tennessee, USA. http://dx.doi.org/10.3334/ORNLDAAC/1127
Implementation of the LBA Data and Publication Policy by Data Users:
The LBA Data and Publication Policy [http://daac.ornl.gov/LBA/lba_data_policy.html] is in effect for a period of five (5) years from the date of archiving and should be followed by data users who have obtained LBA data sets from the ORNL DAAC. Users who download LBA data in the five years after data have been archived must contact the investigators who collected the data, per provisions 6 and 7 in the Policy.
This data set was archived in September of 2012. Users who download the data between September 2012 and August 2017 must comply with the LBA Data and Publication Policy.
Data users should use the Investigator contact information in this document to communicate with the data provider. Alternatively, the LBA website [http://lba.inpa.gov.br/lba/] in Brazil will have current contact information.
Data users should use the Data Set Citation and other applicable references provided in this document to acknowledge use of the data.
Table of Contents:
- 1 Data Set Overview
- 2 Data Characteristics
- 3 Applications and Derivation
- 4 Quality Assessment
- 5 Acquisition Materials and Methods
- 6 Data Access
- 7 References
1. Data Set Overview:
Project: LBA (Large-Scale Biosphere-Atmosphere Experiment in the Amazon)
Activity: LBA-ECO
LBA Science Component: Land Use and Land Cover
Team ID: LC-07 (Melack / Novo / Forsberg)
The investigators were Forsberg, Bruce R; Melack, John M.; Novo, Evlyn ; Affonso, Adriana Gomes; Albuquerque, Paulo C Gurgel; Alcantara, Enner Herenio; Alsdorf, Douglas; Arruda, Warey de Costa; Barbosa, Claudio; Belger, Lauren; Carvalho, Joao Carlos; Castellari, Sueli Pissarra; Correa, Denival Silva; Correia, Antonio ; Costa, Maycira ; da Costa Freitas, Corina; Dutra, Luciano Vieira; Elmiro, Marcos Timbo; Filho, Waterloo Pereira; Franca, Andreia Maria Silva; Freitas, Ramon Morais; Frickmann, Fernando Cruz ; Gama, Fabio Furlan; Gastil-Buhl, Mary; Goncalves, Fabio Guimaraes; Hess, Laura Lorraine; Jardim-Lima, Dayson Jose; Kemenes, Alexandre ; Kilham, Nina; Kramer, Marc Gerald; Lima, Ivan Bergier Tavares de; Londe, Luciana de Resende; Marshall, Bruce Gavin; Mertes, Leal Mura, Jose Claudio; Rudorff, Conrado de Moraes; Sant'Anna, Sidnei J.S.; Santos, Claudia Cristina dos; Santos, Joao Roberto dos; Shimabukuro, Yosio Edemir; Silva, Claudio Roberto; Silva, Thiago Sanna Freire; Titoneli, Fernanda and Vasconcelos, Cintia Honorio. You may contact Silva, Thiago Sanna Freire (thiago@dsr.inpe.br).
LBA Data Set Inventory ID: LC07_Biomass_LGrande
This data set reports measurements of aquatic macrophyte biomass, phenology, leaf characteristics, and length and diameter of stems of both submerged and unsubmerged macrophytes. Data were collected from sites in the Monte Alegre Lake region on the eastern Amazon River floodplain in Para, Brazil. Ten field surveys were made at approximately monthly intervals from December 2003 to November 2004.
2. Data Characteristics:
Data are presented in one ASCII comma separated file:
Biomass_Lago_Grande.csv
| Column | Heading | Units/format | Description |
|---|---|---|---|
| 1 | Sample_ID | Sample Name (SITE_SAMPLE_SUBSAMPLE). Sites are Arapari (ARA); Curuai (C); Lago Grande (G). Only Lago Grande was sampled continuously on all 10 missions. Eg: C11.1 is Curuai site, sample 11, subsample 1 | |
| 2 | Mission | Field mission number (from 1 to 10) | |
| 3 | Latitude | decimal degrees | Latitude in decimal degrees |
| 4 | Longitude | decimal degrees | Longitude in decimal degrees |
| 5 | Dom_spp | Dominant species (see Table 1) | |
| 6 | Dom_spp2 | Second most common species (see Table 1) | |
| 7 | Sample_type | Type of sample: 1 - observation (presence/description, no biomass); 2 - Partial Sample (10% of individuals; minimum of 9; sampled for biomass); 3 - Complete Sample (all individuals sampled for biomass) | |
| 8 | Date | YYYYMMDD | Sample collection date |
| 9 | Time | HH:MM | Sample collection time in local time (local time is UTC-3) |
| 10 | Water_depth | cm | Water depth at sampling point reported in centimeters |
| 11 | Stem_density | ind/m2 | Number of individuals per square meter |
| 12 | N_rammets | Number of secondary individuals (rammets); if registered separately by collector | |
| 13 | Dev_stage | Development Stage (1 = growing; 2 = mature; 3 = Flowering; 4 = Fructifying; 5 = Senescence/Partially Dry; 6 = Sprouting; 0 = Dead/Completely Dry) | |
| 14 | Stem_length_emerg | cm | Emergent stem length in centimeters |
| 15 | Stem_dia_emerg | cm | Emergent stem diameter in centimeters |
| 16 | Stem_incl_emerg | degrees | Emergent stem inclination (degrees: 0 = vertical/nadir; 90 = horizontal) |
| 17 | Stem_nodes_emerg | Number of emergent stem nodes | |
| 18 | N_leaves | Average number of leaves per individual | |
| 19 | Width_leaf | cm | Average leaf width reported in centimeters |
| 20 | Length_leaf | cm | Average leaf length reported in centimeters |
| 21 | Incl_leaf | degrees | Leaf inclination (degrees: 0 = vertical/nadir; 90 = horizontal) |
| 22 | N_samples_emerg | Number of emergent stems sampled for biomass (sum of triplicate samples) | |
| 23 | Stem_length_submerg | cm | Submerged stem length in centimeters |
| 24 | Stem_dia_submerg | cm | Submerged stem diameter in centimeters |
| 25 | Stem_nodes_submerg | Number of submerged stem nodes | |
| 26 | Root_presence | Presence of attached roots (1 = present in one of the triplicates; 2 = present in 2 of the triplicates; 3 = present in 3 of the triplicates) | |
| 27 | N_samples_submerg | Number of submerged stems sampled for biomass (sum of triplicate samples) | |
| 28 | Biomass_fresh_emerg_ind | g/ind | Emergent fresh biomass in grams per individual |
| 29 | Biomass_dry_emerg_ind | g/ind | Emergent dry biomass in grams per individual |
| 30 | Biomass_fresh_submerg_ind | g/ind | Submerged fresh biomass in grams per individual |
| 31 | Biomass_dry_submerg_ind | g/ind | Submerged dry biomass in grams per individual |
| 32 | Biomass_fresh_emerg_area | g/m2 | Emergent fresh biomass in grams per square meter calculated as mean mass per individual multiplied by stem density |
| 33 | Biomass_dry_emerg_area | g/m2 | Emergent dry biomass in grams per square meter calculated as mean mass per individual multiplied by stem density |
| 34 | Biomass_fresh_submerg_area | g/m2 | Submerged fresh biomass in grams per square meter calculated as mean mass per individual multiplied by stem density |
| 35 | Biomass_dry_submerg_area | g/m2 | Submerged dry biomass in grams per square meter calculated as mean mass per individual multiplied by stem density |
| 36 | Biomass_fresh_emerg_quad | g/m2 | Emergent fresh biomass: for complete samples total fresh biomass in grams per square meter calculated as total measured biomass in quadrant divided by area of the quadrant |
| 37 | Biomass_dry_emerg_quad | g/m2 | Emergent dry biomass: for complete samples total dry biomass in grams per square meter calculated as total measured biomass in quadrant divided by area of the quadrant |
| 38 | Biomass_fresh_submerg_quad | g/m2 | Submerged fresh biomass: for complete samples total fresh biomass in grams per square meter calculated as total measured biomass in quadrant divided by area of the quadrant |
| 39 | Biomass_dry_submerg_quad | g/m2 | Submerged dry biomass: for complete samples total dry biomass in grams per square meter: calculated as total measured biomass in quadrant divided by area of the quadrant |
| 40 | Total_stem_length | cm | Total stem length calculated as Col 14 plus Col 23 reported in centimeters |
| 41 | Total_biomass_fresh_area | g/m2 | Total fresh biomass in grams per square meter calculated as Col 32 plu Col 34 |
| 42 | Total_biomass_fresh_ind | g/ind | Total fresh biomass in grams per individual calculated as Col 28 plus Col 30 |
| 43 | Total_biomass_fresh_quad | g/m2 | Total observed fresh biomass in grams per square meter calculated as Col 36 plus Col 38 |
| 44 | Total_biomass_dry_area | g/m2 | Total dry biomass in grams per square meter calculated as Col 33 plus Col 35 |
| 45 | Total_biomass_dry_ind | g/ind | Total dry biomass in grams per individual calculated as Col 29 plus Col 31 |
| 46 | Total_biomass_dry_quad | g/m2 | Total observed dry biomass in grams per square meter calculated as Col 37 plus Col 39 |
| 47 | Mean_stem_diam_total | cm | Mean stem diameter for all stems reported in centimeters calculated as the average of Col 15 and Col 24 |
| 48 | Nodes_total | Total number of nodes calculated as the sum of Col 17 and Col 25 | |
| missing data are indicated by -9999 | |||
Example data records:
|
Sample_ID,Mission,Latitude,Longitude,Dom_spp,Dom_spp2,Sample_type,Date,Time, Water_depth,Stem_density,N_rammets,Dev_stage,Stem_length_emerg,Stem_dia_emerg,Stem_incl_emerg, Stem_nodes_emerg,N_leaves,Width_leaf,Length_leaf,Incl_leaf,N_samples_emerg,Stem_length_submerg, Stem_dia_submerg,Stem_nodes_submerg,Root_presence,N_samples_submerg,Biomass_fresh_emerg_ind, Biomass_dry_emerg_ind,Biomass_fresh_submerg_ind,Biomass_dry_submerg_ind,Biomass_fresh_emerg_area, Biomass_dry_emerg_area,Biomass_fresh_submerg_area,Biomass_dry_submerg_area,Biomass_fresh_emerg_quad, Biomass_dry_emerg_quad,Biomass_fresh_submerg_quad,Biomass_dry_submerg_quad,Total_stem_length, Total_biomass_fresh_area,Total_biomass_fresh_ind ,Total_biomass_fresh_quad,Total_biomass_dry_area,Total_biomass_dry_ind, Total_biomass_dry_quad,Mean_stem_diam_total,Nodes_total ARA10.1,1,-2.407360077,-54.65909958,8,-9999,1,20031218,-9999, -9999,-9999,-9999,-9999,-9999,-9999,-9999,-9999, -9999,-9999,-9999,-9999,-9999,-9999,-9999,-9999, -9999,-9999,-9999,-9999,-9999,-9999,-9999,-9999, -9999,-9999,-9999,-9999,-9999,-9999,-9999, -9999,-9999,-9999,-9999,-9999, -9999,-9999,-9999 ARA10.2,1,-2.409640074,-54.65719986,4,-9999,2,20031218,-9999, 0,108,-9999,1, 106.7,0.7,-9999,6,-9999, -9999,-9999,-9999,27,0,0,0,3,-9999, -9999,7.8,-9999,0,-9999,840.8,-9999, 0,-9999,-9999,-9999,0,106.7,-9999,-9999, -9999,840.8,7.8,-9999,0.4,6 ARA12.1,1,-2.407860041,-54.65840149,-9999,-9999,2,20031218,-9999, 10,541,-9999,6,15,-9999,-9999,-9999,2.7, -9999,-9999,-9999,12,8.3,0.5,1.3,3, 12,-9999,0.1,-9999,0.3,-9999,64.9,-9999, 161.6,-9999,-9999,-9999,-9999,23.3,-9999,-9999, -9999,226.4,0.4,-9999,-9999,-9999 C1.1,1,-2.169420004,-55.58169937,-9999,-9999,1,20031219,-9999, -9999,-9999,-9999,-9999,-9999,-9999,-9999,-9999,-9999,-9999, -9999,-9999,-9999,-9999,-9999,-9999,-9999,-9999,-9999,-9999, -9999,-9999,-9999,-9999,-9999,-9999,-9999,-9999,-9999,-9999, -9999,-9999,-9999,-9999,-9999,-9999, -9999,-9999,-9999 |
Table 1. Species Codes
| Species code | Species name | Common Name |
|---|---|---|
| 0 | Bare Ground | Bare Ground |
| 1 | Paspalum fasciculatum | Muri |
| 2 | Eichornia sp | Moreru |
| 3 | Paspalum repens | Premembeca |
| 4 | Hymenachne amplexicaulis | Rabo de Rato |
| 5 | Ambrosia armtemisifolia | Artemísia |
| 7 | Oryza perennis | Arroz Bravo (Pripomonga) |
| 8 | Echinochloa polystachya | Canarana |
| 9 | Mimosa sp. | Juquiri |
| 10 | Stachytarpheta cayenensis | Rinchão |
| 12 | Cyperus sp. | Priprioca |
| 13 | Urena lobata | Malva |
| 14 | Open Water | Open Water |
| 15 | Scoparia dulcis | Vassourinha |
| 16 | Hibiscus bifurcatus | Manjorana |
Site boundaries: (All latitude and longitude given in decimal degrees)
| Site (Region) | Westernmost Longitude | Easternmost Longitude | Northernmost Latitude | Southernmost Latitude | Geodetic Datum |
|---|---|---|---|---|---|
| Para Western (Santarem) - Lago Grande
de Monte Alegre (Para Western (Santarem)) |
-54.84258 | -53.95092 | -1.99914 | -2.68247 | World Geodetic System, 1984 (WGS-84) |
Time period:
- The data set covers the period 2003/12/14 to 2004/12/04
- Temporal Resolution: measurements were made during ten campaigns each of different lengths
Platform/Sensor/Parameters measured include:
- FIELD SURVEY / BALANCE / VEGETATION BIOMASS
3. Data Application and Derivation:
These repeated measures of vegetation biomass can be used to calculated net primary production for individual species and regions as well as overall for the study area.
4. Quality Assessment:
Biomass samples were taken using a destructive method that is limited by the size of the plants and the depth of the water column, limiting accurate sampling of submerged biomass. Therefore, it is expected that submerged biomass measurements will have a higher degree of inaccuracy, and an underestimation bias. Furthermore, plant material was stored during fieldwork, and posteriorly taken for drying and weighing. The storage and transfer processes might have incurred in small material loss between collection time and dry biomass weight determination. Given the above, we estimate the detection limit as approximately 10 grams in dry weight.
5. Data Acquisition Materials and Methods:
Study area:
The sampling sites were established at the Monte Alegre Lake region, Amazon River. Macrophyte communities in the region are mostly composed of emergent C3 and C4 grasses, with floating genera commonly observed as secondary species, interspersed with the dominant vegetation. Submerged species are rare due to turbidity but occur occasionally in places with clear water input. Most communities develop in regions of variable water level, between the upland and the permanently flooded areas, and have rapid growth at the beginning of the flooding phase.
Field Sampling:
Ten field surveys were conducted during the period of December 2003 to November 2004, at the best possible interval rate within the existing logistical constraints. The data collection design was established to also accommodate ground truthing for satellite imagery analysis in the region. The sampling design was stratified, with seven main sample sites, chosen for the known occurrence of macrophytes. Within each of these sites, one or more sampling transects were determined based on the extent and shape of the stands, reaching up to 100 m into the stand, perpendicular to the shoreline. Five to ten sampling points were visually distributed along the transect(s).
Within each sampling point, triplicate measurements were done by randomly placing a 50 x 50 cm aluminum quadrat in the immediate vicinity of the point. Data from the plants inside the quadrat were recorded separately for each triplicate, and then aggregated by averaging the triplicate observations, yielding one set of observations per geographic location. Data in this spreadsheet correspond to the aggregated measurements of each triplicate sample.
Three types of sample were established for data collection, in order to optimize sampling effort and maximize the number of samples:
- Observation Samples (OS) - Cover type and macrophyte dominant species were determined visually, and the plot was photographed. No other data were collected.
- Partial Samples (PS) - Ten percent of the total number of individual stems in the quadrat was clipped or 9 stems for quadrats with less than a hundred individuals. Plants were first clipped at the water surface level, and then submerged parts were sampled by pulling the stems from the soft substratum.
- Complete Samples (CS) - After the initial collection of the ten percent sample, all remaining individuals in the quadrat were clipped in the same fashion, and weighed separately from the initial partial sample.
Biomass and phenometric determination
Biomass samples were washed from debris and manually compressed prior to sample storage. Samples were later oven-dried (80 degrees C) to constant weight in a laboratory to determine dry biomass, to the nearest 0.1 g. For CS samples, the ten percent fraction and the remaining individuals were weighed separately.
Water depth and phenometric plant variables were recorded for each quadrat, for both CS and PS samples. For the phenometric data, at least three random individuals were measured for each triplicate, and the average was recorded.
6. Data Access:
This data is available through the Oak Ridge National Laboratory (ORNL) Distributed Active Archive Center (DAAC).
Data Archive Center:
Contact for Data Center Access Information:
E-mail: uso@daac.ornl.gov
Telephone: +1 (865) 241-3952
References
none cited
Related Publications
- Silva, T.S.F., M.P.F. Costa and J.M. Melack. 2009. Annual net primary production of macrophytes in the eastern Amazon floodplain. Wetlands, 29, 747-758. doi: 10.1672/08-107.1
- Silva, T.S.F., Costa, M.P.F., and Melack, J.M. 2010. Assessment of two biomass estimation methods for aquatic vegetation growing on the Amazon Floodplain. Aquatic Botany, 92(3), 161-167. doi:10.1016/j.aquabot.2009.10.015