Get Data
Summary:
This data set provides South American Land Data Assimilation System (SALDAS) atmospheric forcing data necessary for land surface modeling for South America. The data were derived by combining modeled and observation based sources.
The forcing data cover the entire continent of South America at 0.125 degree resolution and are built around the model-calculated values of air temperature, wind speed and specific humidity at two meters, surface pressure, downward shortwave and longwave surface radiation, and precipitation from the South American Regional Reanalysis (SARR). These SARR data (Aravequia et al. 2007), which were released in 2006 by INPE/CPTEC, are a medium-term, dynamically consistent, high-resolution (0.125 degree), high-frequency, atmospheric data set covering South America. The forcing data are available at a 3-hourly time step for a 5-year period from 2000 to 2004.
There are 60 monthly *.zip files with each zipped file containing ~240 3-hourly time step data files for that particular month in NetCDF format. Each zipped file is approximately one GB in size.
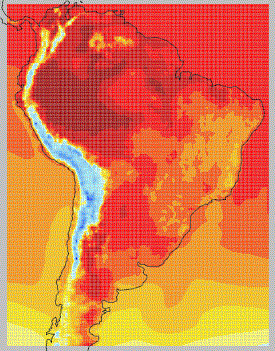
Figure 1. Temperature data for December 31, 2001 at 2100 hours
Data Citation:
Cite this data set as follows:
de Goncalves, L.G.G., W.J. Shuttleworth, D. Vila, E. Larroza, M.J. Bottino, D.L. Herdies, J.A. Aravequia, J.G. de Mattos, D.L. Toll, M. Rodell and P. Houser. 2013. LBA-ECO CD-36 South American Land Data Assimilation System Atmospheric Forcing Data. Data set. Available on-line [http://daac.ornl.gov] from Oak Ridge National Laboratory Distributed Active Archive Center, Oak Ridge, Tennessee, U.S.A. http://dx.doi.org/10.3334/ORNLDAAC/1162
Implementation of the LBA Data and Publication Policy by Data Users:
The LBA Data and Publication Policy [http://daac.ornl.gov/LBA/lba_data_policy.html] is in effect for a period of five (5) years from the date of archiving and should be followed by data users who have obtained LBA data sets from the ORNL DAAC. Users who download LBA data in the five years after data have been archived must contact the investigators who collected the data, per provisions 6 and 7 in the Policy.
This data set was archived in June 2013. Users who download the data between June 2013 and May 2018 must comply with the LBA Data and Publication Policy.
Data users should use the Investigator contact information in this document to communicate with the data provider.
Data users should use the Data Set Citation and other applicable references provided in this document to acknowledge use of the data.
Table of Contents:
- 1 Data Set Overview
- 2 Data Characteristics
- 3 Applications and Derivation
- 4 Quality Assessment
- 5 Acquisition Materials and Methods
- 6 Data Access
- 7 References
1. Data Set Overview:
Project: LBA (Large-Scale Biosphere-Atmosphere Experiment in the Amazon)
Activity: LBA-ECO
LBA Science Component: Land Surface Hydrology
Team ID: CD-36 (Bastidas / Shuttleworth / Nobre)
The investigators were Bastidas, Luis A; Shuttleworth, William James; Nobre, Carlos Afonso; Goncalves, Luis Gustavo; Rosero, Enrique and Rosolem, Rafael. You may contact de Goncalves, Luis G. (luis.g.degoncalves@nasa.gov) and de Mattos, Joao G. Z. (jgerd@cptec.inpe.br).
LBA Data Set Inventory ID: CD36_SALDAS
This data set provides South American Land Data Assimilation System (SALDAS) atmospheric forcing data necessary for land surface modeling for South America which are derived by combining modeled and observation based sources.
The forcing data cover the entire continent of South America at 0.125 degree resolution and are built around the model-calculated values of air temperature, wind speed and specific humidity at two meters, surface pressure, downward shortwave and longwave surface radiation, and precipitation from the South American Regional Reanalysis (SARR). These SARR data (Aravequia et al. 2007), which were released in 2006 by INPE/CPTEC, are a medium-term, dynamically consistent, high-resolution (0.125 degree), high-frequency, atmospheric dataset covering South America. The forcing data are available at a 3-hourly time step for a 5-year period from 2000 to 2004.
2. Data Characteristics:
The forcing data cover the entire continent of South America at 0.125 degree resolution and are built around the model-calculated values of air temperature, wind speed and specific humidity at 2 meters, surface pressure, downward shortwave and longwave surface radiation, and precipitation from South American Regional Reanalysis (SARR). These SARR data (Aravequia et al. 2007), which were released in 2006 by INPE/CPTEC, are a medium-term, dynamically consistent, high-resolution, high-frequency, atmospheric dataset covering South America. Currently they are
available for a 5-year period from 2000 to 2004.
The 3-hourly data files were zipped by year and month and named as YYYYMM.zip where YYYY represents the year and MM represents the month, e.g., 200001.zip would contain the data for
the year 2000 and the month of January. Each zipped file is about 1 GB in size.
-Each zipped file contains 240 or 248 (224 or 232 for February) 3-hourly data files; representing 8 files for each day of the month.
-Data files are named YYYYMMDDHH00.nc where YYYY represents the year, MM represents the month, DD represents the day of the month, and HH00 represents the hour of the day. All the data files are in NetCDF format.
For example, the 200001.zip file contains the data files:
| 200001010000.nc 200001010300.nc ... 200007152100.nc 200007160000.nc ... 200012311800.nc 200012312100.nc |
Each file contains 3-hourly data for the following variables:
| Description | Variable Name |
|---|---|
| Rainfall rate [kg/m^2/s] | WIND |
| Snowfall rate [kg/m^2/s] | PRATE |
| Near surface air temperature [K] | SWEQ |
| Near surface specific humidity [kg/kg] | TMP |
| Surface pressure [Pa] | SPF_H |
| Surface incident shortwave radiation [W/m^2] | SWAVR |
| Surface incident longwave radiation [W/m^2] | LWAVR |
Site boundaries: (All latitude and longitude given in decimal degrees)
| Site (Region) | Westernmost Longitude | Easternmost Longitude | Northernmost Latitude | Southernmost Latitude | Geodetic Datum |
|---|---|---|---|---|---|
| All sites (South America) | -82.9375 | -33.9375 | -48.8125 | 11.9375 | World Geodetic System, 1984 (WGS-84) |
Time period:
- The data set covers the period 2000/01/01 to 2004/12/31
- Temporal Resolution: 3 hours
Platform/Sensor/Parameters measured include:
- COMPUTER MODEL / MODEL ANALYSIS / LAND COVER
- COMPUTER MODEL / MODEL ANALYSIS / CLIMATE
3. Data Application and Derivation:
SALDAS data can be used for a variety of applications, including initiating weather and climate simulations and water management.
From de Goncalves et al. (2006): The SALDAS data set has also been adopted as the regional forcing data for the model comparisons currently being made under the Large-scale Biosphere–Atmosphere Experiment in Amazonia (LBA) Model Intercomparison Study (MIP; see protocol at http://www.climatemodeling.org/lba-mip/).
4. Quality Assessment:
From de Goncalves et al. (2006): The topography used in the Eta model when calculating the SARR differs substantially from the SALDAS topography which is derived from USGS GTOPO30 global 30 second elevation map (Row, Hastings, and Dunbar, 1995), and adjustments in the air temperature, humidity, surface pressure and downward longwave radiation are required to allow for these differences in altitude. The air temperature and surface pressure at 2 m are adjusted using the standard vertical atmospheric lapse rate, specific humidity is adjusted by assuming a constant relative humidity between the two elevations, and the longwave radiation is corrected based on the ratio between vapor pressure at the two levels and temperature between the two levels applied to the Stefan-Boltzmann equation. For a more detailed description of the elevation correction procedures, see Cosgrove et al. (2003).
5. Data Acquisition Materials and Methods:
From de Goncalves et al. (2006): The SARR data are derived using the modified version of the Eta model (Chou and Herdies, 1996) and the Regional Physical-space Statistical System (RPSAS) data assimilation scheme applied at 40-Km horizontal resolution and 38 vertical levels. This system integrates upper air and surface observations from several sources over South America, including vertical soundings from the RACCI/LBA and SALLJEX field campaigns over the Amazon and the low-level jet regions along the Andes, respectively. The quality of the reanalysis is assumed to be superior to the operational Eta model analyses because the model and data assimilation systems remained frozen during the analysis, a larger number of observation were used, and more output fields were saved therefore allowing more comprehensive evaluation.
The topography used in the Eta model when calculating the SARR differs substantially from the SALDAS topography which is derived from USGS GTOPO30 global 30 second elevation map (Row, Hastings, and Dunbar, 1995), and adjustments in the air temperature, humidity, surface pressure and downward longwave radiation are required to allow for these differences in altitude. The air temperature and surface pressure at 2 m are adjusted using the standard vertical atmospheric lapse rate, specific humidity is adjusted by assuming a constant relative humidity between the two elevations, and the longwave radiation is corrected based on the ratio between vapor pressure at the two levels and temperature between the two levels applied to the Stefan-Boltzmann equation. For a more detailed description of the elevation correction procedures, see Cosgrove et al. (2003).
Since the main goal of SALDAS is to provide more realistic and accurate datasets over South America than already available from existing global reanalyzes, downward shortwave radiation and precipitation are observation based derived from GOES satellite measurements and real time TRMM Multisatellite Precipitation Analysis (TMPA-RT) retrievals (Huffman et al, 2007), respectively. In order to reduce the bias of satellite rainfall retrievals, TMPA-RT is combined with surface rain gauges (when available), using additive and multiplicative methods (Vila et al, 2008). The data sets are linearly interpolated in space and time to 1/8 degree resolution and 3-hourly frequency, respectively, except the downward shortwave radiation which is adjusted following changes in the zenithal angle, expressed as a function of hour of the day and latitude.
Data Center Processing
The original 3-hourly data files were received in grib format and were converted by the ORNL DAAC to NetCDF format through the following steps:
- The first step was the identification of the grib data file variables. These eight variables are as listed in section below. Comparison of the results of a direct reading of the grib files with the provided grad control file indicated a mismatch of the variable names. The mismatch occurred because the external table used in identifying the variables was not provided in the grib format.
- To identify the variables, a crosswalk match of the variables names to their specific indices was done using the National Center for Environmental Program (NCEP) reanalysis grib table, which is one of the World Meteorological Organization’s (WMO) standard tables. The mapping of the variables in the provided grad control file to the NCEP table parameters is shown below.
| Variables | Long Name | Units | Parameter number in NCEP table |
|---|---|---|---|
| WIND | Wind speed | m/s | 32 |
| PRATE | Precipitation rate | kg/m^2/s | 59 |
| SRWEQ | Snowfall rate water equiv. | kg/m^2/s | 64 |
| TMP | Temperature | K | 11 |
| SPFH | Specific humidity | kg/kg | 51 |
| PRES | Pressure | Pa | 1 |
| SWAVR | Short wave radiation | W/m^2 | 116 |
| LWAVR | Long wave radiation | W/m^2 | 115 |
6. Data Access:
This data is available through the Oak Ridge National Laboratory (ORNL) Distributed Active Archive Center (DAAC).
Data Archive Center:
Contact for Data Center Access Information:
E-mail: uso@daac.ornl.gov
Telephone:
+1 (865) 241-3952
7. References:
Aravequia, J. A.; Herdies, D. L.; Sapucci, L. F.; Andreoli, R. V.;
Ferreira, S. F.S.; Goncalves, L.G.G. (2007), Reanalise Regional 2000-2004 sobre
a America do Sul com o Modelo RPSAS/ETA: Description do Experimento e dos
Produtos Derivados. Boletim da SBMET. V.31 n.02.
Chou, S. C.; Herdies, D.
L., 1996: Test runs using Eta model over South America. In: 15th Conference on
weather Analysis and Forecasting, 1996, Virginia. 15th conference on
weather analysis and forecasting, 1996. v. 1.
Cosgrove, B.A., Dag
Lohmann, Kenneth E. Mitchell, Paul R. Houser, Eric F. Wood, John C. Schaake,
Alan Robock, Curtis Marshall, Justin Sheffield, Qingyun Duan, Lifeng Luo, R.
Wayne Higgins, Rachel T. Pinker, J. Dan Tarpley, and Jesse Meng, (2003),
Real-time and retrospective forcing in the North American Land Data Assimilation
System (NLDAS) project. Journal of Geophysical Research, Vol. 108, No. D22,
8842, doi:10.1029/2002JD003118
Huffman G. J., R. F. Adler, D. T. Bolvin,
G. Gu, E. J. Nelkin, K. P. Bowman, Y. Hong, E. F. Stocker and D. B. Wolff
(2007), The TRMM Multisatellite Precipitation Analysis (TMPA): Quasi-Global,
Multiyear, Combined-Sensor Precipitation Estimates at Fine Scales, J.
Hydrometeor.,8, 38-55.
Row, L. W., D. A. Hastings, and P. K. Dunbar, 1995: TerrainBase: Worldwide Digital Terrain Data Documentation Manual. National Geophysical Data Center, Boulder, CO, CD-ROM.
Vila, D., L.G.G. de Goncalves, J.R. Rozante and D.L.
Toll, (in press). Statistical Evaluation of Combined Daily Gauge Observations
and Rainfall Satellite Estimations over Continental South America. Journal of
Hydrometeorology.
Related Publications
- de Goncalves, L.G.G., W.J. Shuttleworth, E.J. Burke, P. Houser, D.L. Toll, M. Rodell, and K. Arsenault. 2006. Toward a South America Land Data Assimilation System: Aspects of land surface model spin-up using the simplified simple biosphere. Journal of Geophysical Research-Atmospheres 111(D17):110, doi:10.1029/2005JD006297.
- de Goncalves, L.G.G., W.J. Shuttleworth, S.C. Chou, Y.K. Xue, P.R. Houser, D.L. Toll, J. Marengo, and M. Rodell. 2006. Impact of different initial soil moisture fields on Eta model weather forecasts for South America. Journal of Geophysical Research-Atmospheres 111(D17):D17102, doi:10.1029/2005JD006309.
- de Goncalves, L.G.G., W.J. Shuttleworth, B. Nijssen, E.J. Burke, J.A. Marengo, S.C. Chou, P. Houser, and D.L. Toll. 2006. Evaluation of model-derived and remotely sensed precipitation products for continental South America. Journal of Geophysical Research-Atmospheres 111(D16):D16113, doi:10.1029/2005JD006276.
- de Goncalves, L.G.G., W.J. Shuttleworth, D. Vila, E. Larroza, M.J. Bottino, D.L. Herdies, J.A. Aravequia, J.G. de Mattos, D.L. Toll, M. Rodell and P. Houser. The South American Land Data Assimilation System (SALDAS) 5-Year Retrospective Atmospheric Forcing Datasets. Journal of Hydrometeorology (accepted).