Get Data
Summary:
This data set is a compilation of carbon and energy eddy covariance flux, meteorology, radiation, canopy temperature, humidity, and CO2 profiles and soil moisture and temperature profile data that were collected at nine towers across the Brazilian Amazon. Independent investigators provided the data from a variety of flux tower projects over the period 1999 thru 2006. The data have been harmonized across projects, additional quality control checks were performed, and the data were aggregated to several time intervals.
The Amazonian sites and nine towers include:
- Reserva Cuieiras near Manaus (K34 forest tower)
- Tapajos National forest, near Santarem (K67 and K83 forest towers, and K77 pasture/agriculture tower)
- Caxiuana National forest (CAX forest tower), near Belem
- Reserva Jaru (RJA forest tower)
- Fazenda Nossa Senhora (FNS pasture tower), near Ji-Parana
- Tocantins-Javaes site (JAV seasonally flooded ecotone tower)
- Reserva Pe-de-Gigante in Sao Paulo state (PDG savanna tower)
Refer to the companion file SITE_DESCRIPTIONS_INVESTIGATORS.pdf for the list of investigators and contact information.
Two versions of data are provided. One version is as received from the investigators and the second was processed through a series of automated and manual quality control steps. The companion file CD32_QAQC_Brasilflux_network.pdf provides the quality control procedures.
This data set includes 18 compressed (*.zip) data files with the two versions of data files for each of the nine sites.
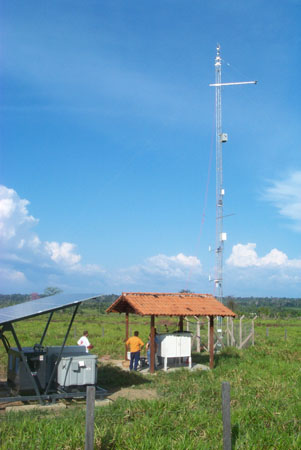
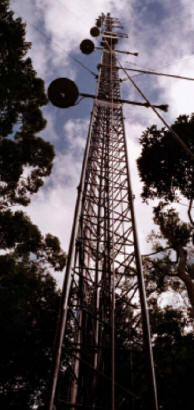
Figure 1. Santarem km 77 eddy flux and micrometeorological
measurement pasture site (Fitzjarrold and Sakai, 2010).
Figure 2. The Pará Western (Santarém) - km 67, Primary Forest Tower (Hutyra
et al., 2008).
Data Citation:
Cite this data set as follows:
Saleska, S.R., H.R. da Rocha, A.R. Huete, A.D. Nobre, P. Artaxo, and Y.E. Shimabukuro. 2013. LBA-ECO CD-32 Flux Tower Network Data Compilation, Brazilian Amazon: 1999-2006. Data set. Available on-line [http://daac.ornl.gov] from Oak Ridge National Laboratory Distributed Active Archive Center, Oak Ridge, Tennessee, USA http://dx.doi.org/10.3334/ORNLDAAC/1174
Implementation of the LBA Data and Publication Policy by Data Users:
The LBA Data and Publication Policy [http://daac.ornl.gov/LBA/lba_data_policy.html] is in effect for a period of five (5) years from the date of archiving and should be followed by data users who have obtained LBA data sets from the ORNL DAAC. Users who download LBA data in the five years after data have been archived must contact the investigators who collected the data, per provisions 6 and 7 in the policy.
This data set was archived in July 2013. Users who download the data between July 2013 and June 2018 must comply with the LBA Data and Publication Policy.
Data users should use the Investigator contact information in this document to communicate with the data provider.
Data users should use the Data Set Citation and other applicable references provided in this document to acknowledge use of the data.
Table of Contents:
- 1 Data Set Overview
- 2 Data Characteristics
- 3 Applications and Derivation
- 4 Quality Assessment
- 5 Acquisition Materials and Methods
- 6 Data Access
- 7 References
1. Data Set Overview:
Project: LBA (Large-Scale Biosphere-Atmosphere Experiment in the Amazon)
Activity: LBA-ECO
LBA Science Component: Carbon Dynamics
Team ID: CD-32 (Saleska / da Rocha / Artaxo / Nobre / Shimabukuro)
The investigators were Saleska, Scott R.; Rocha, Humberto Ribeiro da; Artaxo, Paulo Eduardo; Huete, Alfredo R.; Nobre, Antonio Donato; Parker, Geoffrey; Ratana, Piyachat; Restrepo-Coupe, Natalia; Shimabukuro, Monica Takako; Shimabukuro, Yosio Edemir and Tannus, Rafael Nora. You may contact Saleska, Scott R. (saleska@email.arizona.edu) and Restrepo-Coupe, Natalia (ncoupe@email.arizona.edu).
LBA Data Set Inventory ID: CD32_Brazil_Flux_Network
This data set is a compilation of carbon and energy eddy covariance flux, meteorology, radiation, canopy temperature, humidity, and CO2 profiles, and soil moisture and temperature profile data that were collected at nine towers across the Brazilian Amazon. Independent investigators provided the data from variety of flux tower projects over the period 1999 thru 2006. The data have been harmonized across projects, additional quality control checks performed, and aggregated to several time intervals.
Related Data Sets (data from the flux tower sites for similar time periods)
- LBA-ECO CD-10 CO2 & H2O Eddy Flux Data at km 67 Tower Site, Tapajos National Forest (data for the period 2002/01/01 to 2006/01/18 )
- LBA-ECO CD-10 H2O Profiles at km 67 Tower Site, Tapajos National Forest (data for the period 2002/01/01 to 2006/01/18 )
- LBA-ECO CD-10 CO2 Profiles at km 67 Tower Site, Tapajos National Forest (data for the period 2002/01/01 to 2006/01/18 )
- LBA-ECO CD-10 Temperature Profiles at km 67 Tower Site, Tapajos National Forest (data for the period 2002/01/01 to 2006/01/18 )
- LBA-ECO CD-03 Flux-Meteorological Data, km 77 Pasture Site, Para, Brazil: 2000-2005 (data for the period 2000/09/01 to 2006/01/01)
- LBA-ECO CD-04 CO2 Profiles, km 83 Tower Site, Tapajos National Forest (data for the period 2000/07/01 to 2004/03/12 )
- LBA-ECO CD-04 Meteorological and Flux Data, km 83 Tower Site, Tapajos National Forest (data for the period 2000/06/29 to 2004/03/11)
- LBA-ECO CD-02 Carbon and Oxygen Isotopes in Atmospheric CO2 in the Amazon: 1999-2004 (data for the period 1999/03/01 to 2004/03/31)
- LBA-ECO CD-04 CO2 and Heat Flux, km 83 Gap Tower Site, Tapajos National Forest (data for the period 2002/06/03 to 2004/01/30 )
- LBA-ECO CD-04 Meteorological and Flux Data, km 83 Tower Site, Tapajos National Forest (data for the period period 2000/06/29 to 2004/03/11)
- LBA-ECO TG-07 Soil Trace Gas Fluxes km 67 Seca-Floresta Site, Tapajos National Forest (data for the period 2000/01/12 to 2004/04/28 )
- LBA-ECO CD-04 Soil Respiration, km 83 Tower Site, Tapajos National Forest, Brazil (data for the period 2001/12/19 to 2002/03/01)
2. Data Characteristics:
This data set contains 18 compressed (*.zip) data files that includes two versions of data files for each of the nine sites. The two versions of the data include an original time series, and a quality-controlled (QAQC) version (refer to section 4.0). The *.zip files also have six files in .pdf format which provide graphs of selected variables (the MAN_K34 zip files do not have graphs for monthly data so there are only five .pdf's).
File naming conventions:
The 18 *.zip files are named as X_XT.zip or X_XT_QAQC.zip, where X is one of the following nine study areas, XT is a tower designation, and QAQC indicates a set of quality assured data files.
Example compressed file names: MAN_K34.zip and MAN_K34_QAQC.zip.
When expanded, the *.zip files each contain eight comma-delimited (.csv) data files of hourly, daily, daily daytime, daily nighttime, monthly, monthly daytime, monthly nighttime, and monthly cycle data.
Files are named according to the site flux tower, a temporal value, and _qaqc for quality-assured data.
Example data file names: PDG_Avg_day.csv and PDG_Avg_day_day_qaqc.csv
The *.zip files also contain files in .pdf format named as X_XT_fig_variable.pdf or X_XT_fig_variable_qaqc.pdf,. where X is one of the following nine study areas, XT is a tower designation, and qaqc indicates a set of quality assured data files. See Table 1 for a description of the variables. The .pdf's provide graphs of selected data results.
Example data file names: MAN_K34_fig_radiation.pdf and MAN_K34_fig_radiation_qaqc.pdf
Descriptions of data file "times"and example file names:
The example file names provided are for the original time series. The quality-assured data files follow the same naming conventions and include _qaqc in the file names. For additional information, refer to the companion file Data_file_descriptions.pdf.
1. Hourly data:
Data source: Original and quality assured time series data.
Data aggregation intervals: Data reported at 10:00 are from aggregating measurements between 10:00 and 11:00. Hour runs from 0 (zero) to 23.
Units: Precipitation (prec) units are mm hr-1. Other variable units as averaged over the aggregation interval..e., data at 10:00 are from aggregating measurements between 10:00 and
11:00.
Example file name: PDG_Avg_hour.csv
NOTE: There are no original time series hourly files for the K77, RON_RJA, and RON_FNS sites; however, there are quality control-hourly files for those sites.
2. Daily data:
Data source: Hourly data
Data aggregation intervals: Julian day (day)
Units: Precipitation (prec) units are mm hr-1 as average. Other variable units as averaged over the aggregation interval.
Example file name: PDG_Avg_day.csv
3. Daily daytime data:
Data source: Hourly data
Data aggregation intervals: For a Julian day (day), Day-time is from 6:00 to 17:00 local time. Manaus K34 nighttime set
is from 7:00 to 18:00 local time. Variable set to missing if less than 8 hours of data.
Units: Precipitation (prec) units are mm hr-1 as average. Other variable units as averaged over the aggregation interval.
Example file name: RJA_Avg_day_day.csv
4. Daily nighttime data:
Data source: Hourly data
Data aggregation intervals: For a Julian day (day), Nighttime set is from18:00 to 5:00 local time. Manaus K34 nighttime set is from19:00 to 6:00 local time. Variable set to missing if less than 8 hours of data.
Units: Precipitation (prec) units are mm hr-1 as average. Other variable units as averaged over the aggregation interval.
Example file name: RJA_Avg_day_night.csv
5. Monthly data:
Data source: Daily data.
Data aggregation intervals: Month. Variable set to missing if less than 7 days of data, except precipitation.
Units: Precipitation (prec) units are (mm day-1) as average. Other variable units as averaged over the aggregation interval.
Example file name: K67_Avg_month.csv
6. Monthly daytime data:
Data source: Daily data.
Data aggregation intervals: Month. Daytime set is from 6:00 to 17:00 local time. Manaus K34 nighttime set is from7:00 to 18:00 local time. Variable set to missing if less than 7 days of data, except precipitation.
Units: Precipitation (prec) units are (mm day-1) as average. Other variable units as averaged over the aggregation interval.
Example data file: K77_avg_month_day.csv
7. Monthly nighttime data:
Data source: Daily data.
Data aggregation intervals: Month. Nighttime set is from 18:00 to 5:00 local time. Manaus K34 nighttime set
is from 19:00 to 6:00 local time. Variable set to missing if less than 7 days of data, except precipitation.
Units: Precipitation (prec) units are (mm day-1) as average. Other variable units as averaged over the aggregation interval.
Example data file: BAN_Avg_month_night.csv
8. Monthly daily cycle:
Data source: Hourly data
Data aggregation intervals: Hourly averages per month. Julian day set as the first day of the month. Missing if less than 7 days of data. Hour runs from 0 (zero) to 23.
Units: Precipitation (prec) units are mm hr-1 as average. Other variable units as averaged over the aggregation interval.
Example data file: BAN_Avg_month_cycle.csv
Table 1. Data Variables (18 *.zip files):
| Column | Column Heading | Units/format | Description | Range |
|---|---|---|---|---|
| 1 | year | YYYY | Year (YYYY) | 1999-2006 |
| 2 | day | DDD | Julian day | 0-366 |
| 3 | hour | HH | Hour (HH) | 0-23 |
| 4 | min | mm | Minutes | 0 |
| 5 | ta | C | AWS air temperature (degrees C) | 0-40 |
| 6 | taed | C | Sonic temperature (degrees C) | 0-40 |
| 7 | wd | degrees | Wind direction (Cup Anemometer) | |
| 8 | wded | degrees | Wind direction (Sonic Anemometer) | |
| 9 | pressed | Kpa | Pressure eddy system | 90-110 |
| 10 | press | Kpa | Pressure: Automatic Weather Station (AWS) | 40-110 |
| 11 | rg | W/m | Global incident radiation (W/m) | 20-1200 |
| 12 | rr | W/m | Global reflected radiation (W/m) | 20-800 |
| 13 | par | umol photons m2/s | PAR incident radiation (umol photons m2/s) | 0-2600 |
| 14 | rpar | umol photons m2/s | PAR reflected radiation (umol photons m2/s) | 0-1300 |
| 15 | Rn | W/m2 | Net radiation (W/m2) | 100-1010 |
| 16 | FG | W/m2 | Soil heat flux (W/m2) | 26-32 |
| 17 | wsed | m/s | Wind speed (m/s) (Cup Anemometer) | 0-19 |
| 18 | ws | m/s | Wind speed (m/s) (Sonic Anemometer) | 0-26 |
| 19 | H | W/m2 | Sensible heat flux corrected for air heat capacity that can change with humidity (w/m2) | 100-600 |
| 20 | Hraw | W/m2 | Sensible heat flux (raw, without correction) (w/m2) | 100-600 |
| 21 | LE | W/m2 | Latent heat flux corrected for air heat capacity that can change with humidity (W/m2) | 100-1000 |
| 22 | Leraw | W/m2 | Latent heat flux (raw, without correction) (W/m2) | 100-1000 |
| 23 | Fc | umol CO2/m2/s | CO2 turbulent flux at the top of the canopy, corrected for air heat capacity that can change with humidity (umol CO2/m2/s) | 60-70 |
| 24 | fcraw | umol CO2/m2/s | CO2 turbulent flux (raw, without correction) (60-70 umol CO2/m2/s) | 60-70 |
| 25 | CO2 | ppm | CO2 concentration IRGA (ppm) | 140-170 |
| 26 | sCO2 | umol CO2/m2/s | Canopy storage flux of CO2 (umol CO2/m2/s) | -90 - 40 |
| 27 | NEE | umol CO2/m2/s | Net ecosystem exchange of CO2 (umol CO2/m2/s) | -70 - 70 |
| 28 | NEEf | umol CO2/m2/s | Filtered net ecosystem exchange (umol CO2/m2/s) | -70 - 70 |
| 29 | mrs | umol CO2/m2/ | Soil respiration (umol CO2/m2/s) | -9999 - -9999 |
| 30 | ust | m/s | Friction velocity (m/s) | 0.00-2.00 |
| 31 | rh | % | Relative humidity (percent) | 10-130 |
| 32 | prec | mm | Precipitation (mm) | 0-80 |
| 33 | H2O | mmol/mol | H2O concentration IRGA (mmol/mol) | 2-80 |
| 34 | FH2O | mmol/m2/s | Rate of vertical transfer of H2O (mmol/m2/s) | 15-20 |
| 35 | U | m/s | zonal wind (m/s) (Cup Anemometer) | 15-20 |
| 36 | Ued | m/s | Zonal wind (m/s) (Sonic Anemometer) | 10-13 |
| 37 | V | m/s | Meridional wind (m/s) (Cup Anemometer) | 19-15 |
| 38 | Ved | m/s | Meridional wind (m/s) (Sonic Anemometer) | 30-10 |
| 39 | ee | Kpa | Vapor pressure (Kpa) | 0-20 |
| 40 | ees | KPa | Saturation vapor pressure (KPa) | 0-13 |
| 41 | dpt | C | Dew point temperature (C) | 30-6- |
| 42 | tsavg | C | Average soil temperature (C) | 5-40 |
| 43 | eqetmp | C | Equivalent temperature (C) | -9999 - -9999 |
| 44 | abshu | g/m3 | Absolute humidity (g/m3) | -9999 - -9999 |
| 45 | slopee | KPa/oC | Slope of saturation vapor pressure (KPa/oC) | -9999 - -9999 |
| 46 | radtop | W/m2 | Hourly theoretical radiation (W/m2) | -9999 - -9999 |
| 47 | rgs | W/m2 | Long wave radiation in (W/m2) | 0-1200 |
| 48 | rgsout | W/m2 | Long wave radiation out (W/m2) | 0-200 |
| 49 | rgl | W/m2 | Short wave radiation in (W/m2) | 0-600 |
| 50 | rglout | W/m2 | Short wave radiation out (W/m2) | 0-600 |
| 51 | stdW | m/s | Standard deviation, vertical wind (m/s) | -9999 - -9999 |
| 52 | ang | degrees | Rotation angle | -9999 - -9999 |
| 53 | Tau | kg/m2/s | Rate of vertical tranf. of momentum (kg/m2/s) | -9999 - -9999 |
| 54 | Zl | Atmospheric stability parameter | -9999 - -9999 | |
| 55-64 | tprof1-tprof10 | C | Canopy temperature profile | 10-50 |
| 65 | avgprofT | C | Average profile temperature | 10-50 |
| 66-75 | msoil1-msoil10 | m3/m3 | Soil humidity profile (m3/m3) | 0-5 |
| 76 | totaltet | m3/m3 | Total H2O in the soil (m3/m3) | 0-5 |
| 77-86 | pCO2_1-pCO2_10 | ppm | CO2 concentration profile (ppm) | 200-600 |
| 87 | avgsto | ppm | Average storage (ppm) | 200-600 |
| 88-97 | H2O1-H2O10 | mmol/mol | H20 concentration profile (mmol/mol) | 10-85 |
| 98 | avgprofW | mmol/mol | Average H2O profile | 10-85 |
| 99-103 | Wind1-Wind5 | m/s | Wind profile (m/s) | 0-25 |
| 104 | Wavg | m/s | Wind profile (m/s) | 0-25 |
| 105-109 | tsoil1-tsoil5 | C | Soil temperature profile (degrees C) | 5-40 |
| Missing values and values for bad data are represented as -9999 | ||||
Example data records for PDG_Avg_day.csv:
| year,day,hour,min,ta,taed,wd,wded,pressed,press,rg,rr, par,rpar,Rn,FG,wsed,ws,H,Hraw,LE,Leraw,Fc,fcraw, CO2,sCO2,NEE,NEEf,mrs,ust,rh,prec,H2O,FH2O,U,Ued, V,Ved,ee,ees,dpt,tsavg,eqtemp,abshu,slopee,radtop,rgs,rgsout, rgl,rglout,stdW,ang,Tau,zl,tprof1,tprof2,tprof3,tprof4,tprof5,tprof6, tprof7,tprof8,tprof9,tprof10,avgprofT,msoil1,msoil2,msoil3,msoil4,msoil5,msoil6,msoil7, msoil8,msoil9,msoil10,totaltet,pCO2_1,pCO2_2,pCO2_3,pCO2_4,pCO2_5,pCO2_6,pCO2_7, pCO2_8,pCO2_9,pCO2_10,avgsto,H2O1,H2O2,H2O3,H2O4,H2O5,H2O6,H2O7,H2O8, H2O9,H2O10,avgprofW,Wind1,Wind2,Wind3,Wind4,Wind5,WAvg,tsoil1,tsoil2,tsoil3, tsoil4,tsoil5 2001,1,0,0,23.9109,-9999,131.1567,-9999,-9999,930.6594,-9999,-9999, -9999,18189.78,245.2306,-9999,-9999,4.0409,-9999,-9999,-9999,-9999,-9999,-9999, -9999,-9999,-9999,-9999,-9999,-9999,71.5611,0,-9999,-9999,-9999,-9999, -9999,-9999,2.0703,3.0341,-9999,-9999,-9999,-9999,-9999,-9999,9999,-9999, -9999,-9999,-9999,-9999,-9999,-9999,-9999,-9999,-9999,-9999,-9999,-9999, -9999,-9999,-9999,-9999,-9999,-9999,-9999,-9999,-9999,-9999,-9999,-9999, -9999,-9999,-9999,-9999,-9999,-9999,-9999,-9999,-9999,-9999,-9999,-9999, -9999,-9999,-9999,-9999,-9999,-9999,-9999,-9999,-9999,-9999,-9999,-9999, -9999,-9999,-9999,-9999,-9999,-9999,-9999,-9999,-9999,-9999,-9999,-9999,-9999 2001,2,0,0,23.3028,-9999,126.191,-9999,-9999,931.375,-9999,-9999, -9999,25309.288,194.2731,-9999,-9999,2.7937,-9999,-9999,-9999,-9999,-9999,-9999, -9999,-9999,-9999,-9999,-9999,-9999,70.9788,0,-9999,-9999,-9999,-9999, -9999,-9999,1.9799,2.9248,-9999,-9999,-9999,-9999,-9999,-9999,-9999,-9999, -9999,-9999,-9999,-9999,-9999,-9999,-9999,-9999,-9999,-9999,-9999,-9999, -9999,-9999,-9999,-9999,-9999,-9999,-9999,-9999,-9999,-9999,-9999,-9999, -9999,-9999,-9999,-9999,-9999,-9999,-9999,-9999,-9999,-9999,-9999,-9999, -9999,-9999,-9999,-9999,-9999,-9999,-9999,-9999,-9999,-9999,-9999,-9999, -9999,-9999,-9999,-9999,-9999,-9999,-9999,-9999, -9999,-9999,-9999,-9999,-9999 |
Site boundaries:(All latitude and longitude given in decimal degrees)
| Site (Region) | Westernmost Longitude | Easternmost Longitude | Northernmost Latitude | Southernmost Latitude | Geodetic Datum |
|---|---|---|---|---|---|
| Para Western (Santarem) - km 67 Primary Forest Tower Site (Para Western (Santarem)) | -54.95900 | -54.95900 | -2.85700 | -2.85700 | World Geodetic System, 1984 (WGS-84) |
| Para Western (Santarem) - km 77 Pasture Tower Site (Para Western (Santarem)) | -54.88850 | -54.88850 | -3.02020 | -3.02020 | World Geodetic System, 1984 (WGS-84) |
| Para Western (Santarem) - km 83 Logged Forest Tower Site (Para Western (Santarem)) | -54.97070 | -54.97070 | -3.01700 | -3.01700 | World Geodetic System, 1984 (WGS-84) |
| Amazonas (Manaus) - ZF2 km 34 (Amazonas (Manaus)) | -60.20910 | -60.00000 | -2.50000 | -2.60900 | World Geodetic System, 1984 (WGS-84) |
| Para Eastern (Belem) - FLONA Caxiuana (Para Eastern (Belem)) | -51.45360 | -51.45360 | -1.74830 | -1.74830 | World Geodetic System, 1984 (WGS-84) |
| Rondonia - Fazenda Nossa Senhora (Rondonia) | -62.35720 | -62.35720 | -10.76180 | -10.76180 | World Geodetic System, 1984 (WGS-84) |
| Rondonia - Jaru Biological Reserve Tower B (Rondonia) | -61.93310 | -61.93310 | -10.07800 | -10.07800 | World Geodetic System, 1984 (WGS-84) |
| Tocantins - Ilha do Bananal (Tocantins) | -50.1591111 | -50.1591111 | -9.824416667 | -9.824416667 | World Geodetic System, 1984 (WGS-84) |
| Sao Pablo - Reserva Pe-de-Gigante (Sao Pablo) | -47.6498889 | -47.6498889 | -21.61947222 | -21.61947222 | World Geodetic System, 1984 (WGS-84) |
Time period:
- The data set covers the period 1999/01/01 to 2006/12/31.
- Temporal Resolution: Hourly, daily, monthly
Platform/Sensor/Parameters measured include:
- TOWER / ANEMOMETER / AIR TEMPERATURE
- TOWER / IRGA (INFRARED GAS ANALYZER) / CARBON DIOXIDE
- COMPUTER MODEL / ANALYSIS / RESPIRATION
- COMPUTER MODEL / ANALYSIS / HEAT FLUX
- COMPUTER MODEL / ANALYSIS / NET RADIATION
- COMPUTER MODEL / ANALYSIS / CARBON DIOXIDE
- COMPUTER MODEL/ ANEMOMETER / WIND PROFILES
3. Data Application and Derivation:
Typical Application of Data
This data product is an assimilation of eddy flux data that was independently produced and generously provided by the PIs of a variety of tower projects in the Amazon of Brazil. This integrated dataset is intended to facilitate integrative studies and data-model synthesis from a common reference point.
4. Quality Assessment:
Two versions of the data are provided: original time series and a quality controlled (QAQC) version. The QAQC version was tested for: outliers comparison between AWS and eddy sensors-- sensors at same height, wind speed (acceptable variation is two standard deviation units form the linear regression), and unresponsive sensors.
Please refer to the companion file CD32_QAQC_Brasilflux_Network.pdf for a discussion on the quality control procedures. See SITE_qaqc_merge.pdf with plots to review the flagged and removed data.
5. Data Acquisition Materials and Methods:
Study Areas:
This data set is an assimilation of eddy flux data that was independently produced and provided by the investigators of a variety of tower projects in the Amazon of Brazil (refer to SITE_DESCRIPTIONS_INVESTIGATORS.pdf for the list of investigators and contact information). Data are provided from nine flux network towers for the period 1999 thru 2006.
- Reserva Cuieiras near Manaus (K34 forest tower)
- Tapajos National forest, near Santarem (K67 and K83 forest towers, and K77 pasture/agriculture tower)
- Caxiuana National forest (CAX forest tower), near Belem
- Reserva Jaru (RJA forest tower)
- Fazenda Nossa Senhora (FNS pasture tower), near Ji-Parana
- Tocantins-Javaes site (JAV seasonally flooded ecotone tower)
- Reserva Pe-de-Gigante in Sao Paulo state (PDG savanna tower)
Table 2. Nine towers and corresponding study areas (information for these sites may also be found at the FLUXNET web site, http://fluxnet.ornl.gov/):
| Study Area_Tower | Description | Fluxnet Site Name/Site Code | Altitude (m) | Measurement Height (m) | Time Series |
|---|---|---|---|---|---|
| TOC_BAN | Tocantins State, Bananal seasonally flooded forest, mixture of cerrado, cerrado and campo (natural grassland) | Ecotone Bananal Island/ BR-Ban |
120.000 | 40.000 | 24-Oct-03 to 8-Dec-06 |
| MAN_K34 | Manaus, km 34 tropical forest site | Manaus-ZF2 K34/ BR-Ma2 |
130.000 | 50.000 | 14-Jun-99 to 30-Sep-06 |
| STM_K67 | Santarem, km 67 tropical forest site | Santarem-Km67-Primary Forest/ BR-Sa1 ** |
130.000 | 63.000 | 2-Jan-02 to 23-Jan-06 |
| STM_K77 | Santarem, km 77 pasture-agriculture site | Santarem-Km77-Pasture/ BR-Sa2 |
130.000 | 18.000 | 1-Jan-00 to 30-Dec-05 |
| STM_K83 | Santarem, km 83 selectively logged tropical forest | Santarem-Km83-Logged Forest/ BR-Sa3 *** |
130.000 | 64.000 | 29-Jun-00 to 12-Mar-04 |
| RON_RJA | Rondonia State, Reserva Jaru, tropical dry forest | Rond.- Rebio Jaru Ji Parana-Tower B/ BR-Ji3 |
191.000 | 60.000 | 23-Mar-99 to 14-Nov-02 |
| RON_FNS | Rondonia State, Fazenda Nossa Senhora, pasture | Rond.- Faz. Nossa Senhora-Ji Parana-pasture/ BR-Ji1 |
306.000 | 8.5000 | 4-Feb-99 to 4-Nov-02 |
| PA_CAX | Para State, Caxiuana tropical forest | Caxiuana Forest-Almeirim/ BR-Cax |
130.000 | 51.5000 | 1-Jan-99 to 30-Jul-03 |
| SP_PDG | Sao Paulo State, Reserva Pe-de-Gigante (PDG) cerrado | Sao Paulo Cerrado/ BR-Sp1 |
690.000 | 21.000 | 1-Jan-04 to 31-Dec-06 |
** Site information and data are also available from AmeriFlux (http://ameriflux.ornl.gov/). In AmeriFlux, site name= LBA Tapajos KM67 Mature Forest/BR-Sa1
*** Site information and data are also available from AmeriFlux (http://ameriflux.ornl.gov/). In AmeriFlux, site name= LBA Tapajos KM83 Logged Forest/BR-Sa3
Data Processing
The data compilation, harmonization across projects, quality control checks, and aggregation to the various time intervals was performed at the University of Arizona (MATLAB R2007b code) by the LBA CD-32 eddy covariance towers and integrated database project. This data set provides the original time series, Version_1.1.b, and QAQC, Version_1.1b_qaqc, data products.
Flux Calculation Methods:
The reported values were used for CO2 eddy flux at the top of the canopy (Fc) and canopy storage flux (SCO2). At RJA and Km34, SCO2 was calculated as the spatial integration of the CO2 temporal change at five different levels within the canopy (Kruijt et al., 2004).
The biotic flux measured as NEE was calculated as the sum of Fc and SCO2. Fc nighttime values during low friction velocity (u*) were discarded (Saleska et al., 2003). A different u* threshold value used at each site, in general, the selection of the u* value was based on previous studies (Araujo et al., 2002; Kruijt et al., 2004; Saleska et al., 2003).
At K77, NEE values were used where the nocturnal accumulation method was applied to estimate nighttime fluxes with low u* according to Sakai et al. (2003). NEE is assumed equivalent to Fc at two sites, the FNS and PDG.
In order to better capture the ‘true’ gross ecosystem productivity (GEP) seasonality, if 30% of the total length of the SCO2 time series was missing, hourly SCO2 values were estimated based on a site-specific SCO2-filling method.
The diel method was used at K34 and BAN (Hutyra et al., 2007). SCO2 was calculated by logarithmic and linear regressions following Iwata et al. (2005) at RJA and CAX, respectively.
GEP and ecosystem respiration (Reco) were calculated and filled using a standard method implemented at the Biogeochemical Ecology Research Lab at the University of Arizona, based on previous work by Saleska et al. (2003). Reco was calculated as the average of nighttime NEE 2 days before and 2 days after the missing value (5 days). If not enough data were available in order to calculate the average (min 10 hours), we extended the window from 5 to 11 to 15 to 21 and to 31 days.
GEP was calculated as GEP= -NEE -Reco. The missing data were modeled by a look up table (LUT) of mean GEP vs. photosynthetic active radiation (PAR) and time of day (HR). This LUT was calculated by a moving window of 5 days. PAR was divided into bins of 200 m-2 s-1 widths and HR was divided into 2-hour bins. Gaps inside the LUT were filled using a linear interpolation, and if extrapolation was required, the nearest neighbor method was used. This particular method may account for the differences in photosynthetic activity between morning and afternoon and the sensitivity to soil moisture, given the 11 days window. However, if not enough data were available (min 16 hours) this 11-days window was extended to 21, or 31 days. Canopy photosynthetic capacity (Pc) was calculated as the mean GEP in the fixed range PAR light interval between 725 and 875 umol m-2 s-1 (Hutyra et al., 2007).
6. Data Access:
These data are available through the Oak Ridge National Laboratory (ORNL) Distributed Active Archive Center (DAAC).
Data Archive Center:
Contact for Data Center Access Information:
E-mail: uso@daac.ornl.gov
Telephone: +1 (865) 241-3952
7. References:
Araujo, A.C., A.D. Nobre, B. Kruijt, J.A. Elbers, R. Dallarosa, P. Stefani, C. von Randow, A.O. Manzi, A.D. Culf, J.H.C. Gash, R. Valentini, and P. Kabat, Comparative measurements of carbon dioxide fluxes from two nearby towers in a central Amazonian rainforest: The Manaus LBA site, Journal of Geophysical Research, 107 (D20), doi:10.1029/2001JD000676, 2002.
Borma, L.S., H.R. da Rocha, and O.M.R. Cabral, Atmosphere and hydrological controls of the evapotranspiration over a floodplain forest in the Bananal Island region, Amazonia., Journal of Geophysical Research - Biogeosciences, 114, G01003, doi:10.1029/2007JG000641, 2009.
Carswell, F.E., A.L. Costa, M. Palheta, Y. Malhi, P. Meir, J.D.R. Costa, M.D. Ruivo, L.D.M. Leal, J.M.N. Costa, R.J. Clement, and J. Grace, Seasonality in CO2 and H2O flux at an eastern Amazonian rain forest, Journal of Geophysical Research, 107 (D20), 8076, doi:10.1029/2000JD000284, 2002.
Christoffersen, B.O., Restrepo-Coupe, N., Arain, M.A., Baker, I.T., Cestaro, B.P., Ciais, P., Fisher, J.B., Galbraith, D., Guan, X., Gulden, L., van den Hurk, B., Ichii, K., Imbuzeiro, H., Jain, A., Levine, N., Miguez-Macho, G., Poulter, B., Roberti, D.R., Sakaguchi, K., Sahoo, A., Schaefer, K., Shi, M., Verbeeck, H., Yang, Z.-L., Araújo, A.C., Kruijt, B., Manzi, A.O., da Rocha, H.R., von Randow, C., Muza, M.N., Borak, J., Costa, M.H., Gonçalves de Gonçalves, L.G., Zeng, X., Saleska, S.R., 2014. Mechanisms of water supply and vegetation demand govern the seasonality and magnitude of evapotranspiration in Amazonia and Cerrado. Agric. For. Meteorol. 191, 33-50. doi:10.1016/j.agrformet.2014.02.008
Fitzjarrald, D.R. and R.K. Sakai. 2010. LBA-ECO CD-03 Flux-Meteorological Data, km 77 Pasture Site, Para, Brazil: 2000-2005. Data set. Available on-line [http://daac.ornl.gov] from Oak Ridge National Laboratory Distributed Active Archive Center, Oak Ridge, Tennessee, U.S.A. doi:10.3334/ORNLDAAC/962
Goulden, M.L., S.D. Miller, H.R. da Rocha, M.C. Menton, H.C. de Freitas, A.M.E.S. Figueira, and C.A.D. de Sousa, Diel and seasonal patterns of tropical forest CO2 exchange, Ecological Applications, 14 (4), S42-55, 2004.
Hutyra, L., S. Wofsy and S. Saleska. 2008. LBA-ECO CD-10 CO2 and H2O Eddy Fluxes at km 67 Tower Site, Tapajos National Forest. Data set. Available on-line [http://daac.ornl.gov] from Oak Ridge National Laboratory Distributed Active Archive Center, Oak Ridge, Tennessee, U.S.A. doi:10.3334/ORNLDAAC/860
Hutyra, L. R., J. W. Munger, S. R. Saleska, E. Gottlieb, B. C. Daube, A. L. Dunn, D. F. Amaral, P. B. de Camargo, and S. C. Wofsy (2007), Seasonal controls on the exchange of carbon and water in an Amazonian rain forest, J. Geophys. Res., 112, G03008, doi:10.1029/2006JG000365.
Iwata, Hiroki, Yadvinder Malhi, and Celso von Randow. 2005.Gap-filling measurements of carbon dioxide storage in tropical rainforest canopy airspace. Agricultural and Forest Meteorology 132: 305–314
Kruijt, B., J.A. Elbers, C. von Randow, A.C. Arajo, P.J. Oliveira, A. Culf, A.O. Manzi, A.D. Nobre, P. Kabat, and E.J. Moors, The robustness of eddy correlation fluxes for Amazon rain forest conditions, Ecological Applications, 14 (sp4), 101-113, 2004.
Miller, S.D., M.L. Goulden, M.C. Menton, H.R.d. Rocha, H.C. Freitas, A.M.S. Figueira, and C.A.D. Sousa, Biometric and micrometeorological measurements of tropical forest carbon balance, Ecological Applications, 14 (4), S114-S126, 2004.
da Rocha, H., H.C. Freitas, R. Rosolem, R.I.N. Juárez, R.N. Tannus, M.A. Ligo, O.M.R. Cabral, and M.A.F. Silva Dias, Measurements of CO2 exchange over a woodland savanna (Cerrado Sensu stricto) in southeast Brasil, Biota Neotropica, 2 (1), 2002.
da Rocha, H.R., M.L. Goulden, S.D. Miller, M.C. Menton, L.D.V.O. Pinto, H.C. Freitas, and A.M.S. Figueira, Seasonality of water and heat fluxes over a tropical forest in eastern Amazonia, Ecological Applications, 14 (4), S22-S32, 2004.
Restrepo-Coupe, N., Rocha, H.R. da, Christoffersen, B., Araujo, A.C. da, Borma, L.S., Cabral, O.M.R., Camargo, P.B. de, Cardoso, F.L., Costa, A.C.L. da, Fitzjarrald, D.R., Goulden, M.L., Hutyra, L.R., Kruijt, B., Maia, J.M.F., Malhi, Y.S., Manzi, A.O., Miller, S.D., Nobre, A.D., Randow, C. von, Sá, L.D. da A., Sakai, R.K., Tota, J., Wofsy, S.C., Zanchi, F.B., Saleska, S.R., 2013. What drives the seasonality of productivity across the Amazon basin? A cross-site analysis of eddy flux tower measurements from the Brasil flux network. Agric. For. Meteorol. 182-183, 128-144.
Sakai, R.K., D.R. Fitzjarrald, O.L.L. Moraes, R.M. Staebler, O.C. Acevedo, M.J. Czikowsky, R. Silva, E. Brait, and V. Miranda, Land-use change effects on local energy, water and carbon balances in an Amazonian agricultural field, Global Change Biology, 10 (5), 895-907, 2003.
Saleska, S.R., S.D. Miller, D.M. Matross, M.L. Goulden, S.C. Wofsy, H.R. da Rocha, P.B. de Camargo, P. Crill, B.C. Daube, H.C. de Freitas, L. Hutyra, M. Keller, V. Kirchhoff, M. Menton, J.W. Munger, E.H. Pyle, A.H. Rice, and H. Silva, Carbon in Amazon forests: Unexpected seasonal fluxes and disturbance-induced losses, Science, 302, 1554-1557, 2003.
Souza-Filho, J.D., A. Ribeiro, M. H. Costa, and J. C. Cohen, Control mechanisms of the seasonal variation of transpiration in a northeast Amazonia tropical rainforest (in Portuguese), Acta Amazonica, 35 (2), 223-229, 2005.
von Randow, C., A.O. Manzi, B. Kruijt, P.J. de Oliveira, F.B. Zanchi, R.L. Silva, M.G. Hodnett, J.H.C. Gash, J.A. Elbers, M.J. Waterloo, F.L. Cardoso, and P. Kabat, Comparative measurements and seasonal variations in energy and carbon exchange over forest and pasture in South West Amazonia, Theoretical and Applied Climatology, 78 (1-3), 5-26, 2004.
Related Publications
- da Rocha, H.R., A.O. Manzi, O.M. Cabral, S.R. Saleska, S.D. Miller, M.L. Goulden, S.C. Wofsy, N. R.-Coupe, L.S. Borma, A.D. Nobre, G. Vourlitis, J.S. Nogueira, F.L. Cardoso, B. Kruijt, H. Freitas, C. von Randow, R.G. Aguiar, and J.F. Maia. 2009. Patterns of water and heat flux across a biome gradient from tropical forest to savanna in Brazil. Journal of Geophysical Research - Biogeosciences, 114 (G00B12), doi:10.1029/2007JG000640.
- Saleska, S.R., Rocha, H.R. da, Kruijt, B., Nobre, A.D., 2009. Ecosystem Carbon Fluxes and Amazonian Forest Metabolism, in: Amazonia and global change. American Geophysical Union, Washington DC.
- Restrepo-Coupe, N., Christoffersen, B., Rocha, H.R. da, Araujo, A.C. da, Borma, L.S., Cabral, O.M.R., Camargo, P.B. de, Cardoso, F.L., Costa, A.C.L. da, Fitzjarrald, D.R., Goulden, M.L., Hutyra, L.R., Kruijt, B., Maia, J.M.F., Malhi, Y.S., Manzi, A.O., Miller, S.D., Nobre, A.D., Randow, C. von, Sá, L.D. da A., Sakai, R.K., Tota, J., Wofsy, S.C., Zanchi, F.B., Saleska, S.R., submitted. Gross Ecosystem Productivity Seasonality in the Tropics: Issues Posed by the Absence of Co2 Profile Measurements at Eddy-Flux Systems. Agricultural and Forest Meteorology.
- Restrepo-Coupe, N., Rocha, H.R. da, Christoffersen, B., Araujo, A.C. da, Borma, L.S., Cabral, O.M.R., Camargo, P.B. de, Cardoso, F.L., Costa, A.C.L. da, Fitzjarrald, D.R., Goulden, M.L., Hutyra, L.R., Kruijt, B., Maia, J.M.F., Malhi, Y.S., Manzi, A.O., Miller, S.D., Nobre, A.D., Randow, C. von, Sá, L.D. da A., Sakai, R.K., Tota, J., Wofsy, S.C., Zanchi, F.B., Saleska, S.R., submitted. What drives the seasonality of productivity across the Amazon basin? A cross-site analysis of eddy flux tower measurements from the Brasil flux network. Agricultural and Forest Meteorology.
- Saleska, S.R., Didan, K., Huete, A.R., da Rocha, H.R., 2007. Amazon Forests Green-Up During 2005 Drought. Science 318, 612.