Get Data
Summary:
A Vaisala CT-25K ceilometer was installed at an old-growth forest site located at the km 67 Eddy Flux Tower site in the Tapajos National Forest, Para, Brazil, off Kilometer 67 of BR-163 south of Santarem in April 2001 and remained operational through December 2003, with reliable data being collected between May 2001 and June 2003.
Annual, 2001 to 2003, 30-minute average
cloud base and backscatter profile data and measurement statistics
(sample count, variance, skewness, and kurtosis) are
presented in 15 ASCII comma-delineated files. In addition, the cloud
base values (m) and measurement statistics for the three reported cloud
base levels have been consolidated in three annual comma-separated files.
The ceilometer provides 15-second measurements of cloud base (three levels up to 7500 m), echo intensity, and a 30-m resolution backscatter profile. The ceilometer reports vertical visibility during periods when the sky is obscured but a cloud base is not detectable. The ceilometer was operational for a sufficient amount of time to examine wet-to-dry season variations in cloud cover fraction and cloud base height.
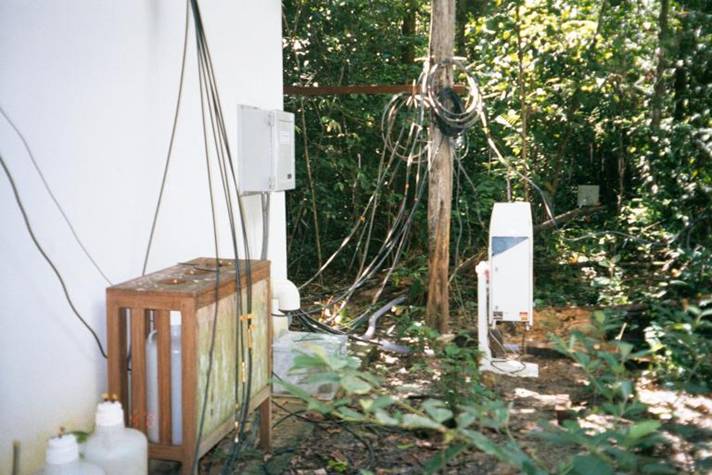
Vaisala CT-25K ceilometer as installed at the old-growth forest site located at the km 67 Eddy Flux Tower site in the Tapajos National Forest.
Data Citation:
Cite this data set as follows:
Czikowsky, M.J. 2009. LBA-ECO CD-03 Cloud Base-Backscatter Data, km 67 Tower Site, Tapajos National Forest. Data set. Available on-line [http://daac.ornl.gov] from Oak Ridge National Laboratory Distributed Active Archive Center, Oak Ridge, Tennessee, U.S.A. doi:10.3334/ORNLDAAC/942
Implementation of the LBA Data and Publication Policy by Data Users:
The LBA Data and Publication Policy [http://daac.ornl.gov/LBA/lba_data_policy.html] is in effect for a period of five (5) years from the date of archiving and should be followed by data users who have obtained LBA data sets from the ORNL DAAC. Users who download LBA data in the five years after data have been archived must contact the investigators who collected the data, per provisions 6 and 7 in the Policy.
This data set was archived in August of 2009. Users who download the data between August 2009 and September 2014 must comply with the LBA Data and Publication Policy.
Data users should use the Investigator contact information in this document to communicate with the data provider. Alternatively, the LBA Web Site [http://lba.inpa.gov.br/lba/] in Brazil will have current contact information.
Data users should use the Data Set Citation and other applicable references provided in this document to acknowledge use of the data.
Table of Contents:
- 1 Data Set Overview
- 2 Data Characteristics
- 3 Applications and Derivation
- 4 Quality Assessment
- 5 Acquisition Materials and Methods
- 6 Data Access
- 7 References
1. Data Set Overview:
Project: LBA (Large-Scale Biosphere-Atmosphere Experiment in the Amazon)
Activity: LBA-ECO
LBA Science Component: Carbon Dynamics
Team ID: CD-03 (Fitzjarrald / Moraes)
The investigators were Fitzjarrald, David R.; Czikowsky, Matthew J.; Sakai, Ricardo K.; Moraes, Osvaldo L. M. and Acevedo, Otavio C. . You may contact Fitzjarrald, Dr. David R. (fitz@asrc.cestm.albany.edu) and Sakai, Dr. Ricardo K. (sakai@asrc.cestm.albany.edu)
LBA Data Set Inventory ID: CD03_Ceilometer_Km67
A Vaisala CT-25K ceilometer was installed at an old-growth forest site located at the km 67 Eddy Flux Tower site in the Tapajos National Forest off kilometer 67 of BR-163 south of Santarem in April 2001 and remained operational through December 2003, with reliable data being collected between May 2001 and June 2003.
The ceilometer provides 15-second measurements of cloud base (three levels up to 7500 m), echo intensity, and a 30-m resolution backscatter profile. The ceilometer reports vertical visibility during periods when the sky is obscured but a cloud base is not detectable. The ceilometer was operational for a sufficient amount of time to examine wet-to-dry season variations in cloud cover fraction and cloud base height.
Related Data Sets:
2. Data Characteristics:
Annual, 2001 to 2003, 30-minute average cloud base, backscatter profile data and measurement statistics (sample count, variance, skewness, and kurtosis) are presented in 15 ASCII comma-delineated files. There are several data gaps in each file that are noted in Section 4.
In addition, the cloud base values (m) and measurement statistics for the three reported cloud base levels have been consolidated in three annual comma-separated files.
Annual 30-minute average cloud base and backscatter profile data files:
For each year, the 30-minute average cloud base with backscatter and measurement statistics including the sample count, variance, skewness, and kurtosis are reported in separate ASCII comma-delineated files -- 5 files per year for a total of 15 files.
The data file naming structure follows this pattern:
CD03_Ceilometer_data-type_YYYY.csv
Where data-type will be Backscatter, Sample_Count, Variance, Skewness, or Kurtosis and YYYY will be 2001, 2002, or 2003.
For example: CD03_Ceilometer_Backscatter_2001.csv, CD03_Ceilometer_Variance_2002.csv, and CD03_Ceilometer_Kurtosis_2003.csv
Data file header and column descriptions:
Following is an example of the header for a Backscatter data file. Note that columns 5-7 contain the Cloud Base heights (m) that were derived from the backscatter profile measurements. Columns 8-258 are the 30-minute average backscatter values at the indicated heights.
For the Sample_Count, Variance, Skewness, and Kurtosis data types, the file structure is the same as Backscatter, but the values are the measurement statistics for the respective Backscatter value. For example, in CD03_Ceilometer_Sample_Count_2001.csv, columns 5-7 contain the Sample Count for Cloud Base height values at level 1, 2, and 3, respectively. Values in columns 8-258 are the number of 15-second measurements included in the respective 30-minute backscatter averages at the indicated heights.
Example Backscatter data file header: (Headers are not shown for the other data types).
| Filename:CD03_Ceilometer_Backscatter_2001.csv File creation date: 16-June-2008 Associated LBA Data Set Inventory ID: CD03_Ceilometer_Km67 Moment 1 output file File generated by ceilHexavg1.f - avg. per.= 30 min with post-processing using SAS to reformat data file as csv and remove padded blank spaces. | |||
| Column Number | Heading | Units/Formats | Description |
|---|---|---|---|
| 1 | Year | YYYY | Year |
| 2 | Day | Decimal day of year (GMT). Note: The values are the middle of the 30-minute averaging period. Local time is GMT-4. | |
| 3 | Hour | Decimal hour of the day (GMT). Note: The values are the middle of the 30-minute averaging period - 5.25 represents the average for the 05:00-05:30 time period. | |
| 4 | Seconds | Number of seconds into the day (GMT). | |
| 5 | BS_Cloud_1 | m | Cloud base for level 1 (m) - (a value of -9999 indicates no cloud base was detected) |
| 6 | BS_Cloud_2 | m | Cloud base for level 2 (m) - (a value of -9999 indicates no cloud base was detected) |
| 7 | BS_Cloud_3 | m | Cloud base for level 3 (m) - (a value of -9999 indicates no cloud base was detected) |
| Cols 8-258 | Backscatter_height | 10000*srad*km | Data are range and sensitivity normalized backscatter. There are 251 values, representing the average of 15 second backscatter measurements from 0 to 25000 feet at 100-foot (~30 m) resolution. The first value (column 8) is the backscatter at a height of 0 feet, column 9 is the backscatter at a height of 100 feet, and column 258 is the backscatter at 25000 feet. |
Example data file records:
Note that 258 columns will not load completely into an Excel 2003 spread sheet because of the 256 column limit. Excel 2007 has no such limit.
Backscatter:
| Header
records omitted
Year,Day,Hour,Seconds,BS_Cloud_1,BS_Cloud_2,BS_Cloud_3,Backscatter_0ft,Backscatter_100ft, Backscatter_200ft,Backscatter_300ft,Backscatter_400ft,Backscatter_500ft,Backscatter_600ft, Backscatter_700ft,Backscatter_800ft,Backscatter_900ft,Backscatter_1000ft,Backscatter_1100ft, ... ,Backscatter_24000ft,Backscatter_24100ft,Backscatter_24200ft,Backscatter_24300ft, Backscatter_24400ft,Backscatter_24500ft,Backscatter_24600ft,Backscatter_24700ft, Backscatter_24800ft,Backscatter_24900ft,Backscatter_25000ft 2001,121.947914,22.75,81900,3992.88,-9999,-9999,2.41,1.48,1,1,0,0,0,0,0,0,0,0, ... 0.04,-0.04,-0.07,0,-0.04,0,0.07,-0.04,0,0.07,0.07 |
Sample Count:
|
Header
records omitted Year,Day,Hour,Seconds,SC_Cloud_1,SC_Cloud_2,SC_Cloud_3,Sample_Count_0ft,Sample_Count_100ft, Sample_Count_200ft,Sample_Count_300ft,Sample_Count_400ft,Sample_Count_500ft,Sample_Count_600ft, Sample_Count_700ft,Sample_Count_800ft,Sample_Count_900ft,Sample_Count_1000ft,Sample_Count_1100ft, ... ,Sample_Count_24000ft,Sample_Count_24100ft,Sample_Count_24200ft,Sample_Count_24300ft, Sample_Count_24400ft,Sample_Count_24500ft,Sample_Count_24600ft,Sample_Count_24700ft, Sample_Count_24800ft,Sample_Count_24900ft,Sample_Count_25000ft 2001,121.947914,22.75,81900,1,0,0,27,27,27,27,27,27,27,27,27,27,27,27, ... 27,27,27,27,27,27,27,27,27,27,27 |
Variance:
|
Header
records omitted Year,Day,Hour,Seconds,V_Cloud_1,V_Cloud_2,V_Cloud_3,Variance_0ft,Variance_100ft, Variance_200ft,Variance_300ft,Variance_400ft,Variance_500ft,Variance_600ft, Variance_700ft,Variance_800ft,Variance_900ft,Variance_1000ft,Variance_1100ft, ... ,Variance_24000ft,Variance_24100ft,Variance_24200ft,Variance_24300ft, Variance_24400ft,Variance_24500ft,Variance_24600ft,Variance_24700ft, Variance_24800ft,Variance_24900ft,Variance_25000ft 2001,121.947914,22.75,81900,-9999,-9999,-9999,0.57,0.51,0,0,0,0,0,0,0,0,0,0, ... 0.19,0.19,0.27,0.28,0.19,0,0.38,0.19,0,0.27,0.27 |
Skewness:
|
Header
records omitted Year,Julian_day,Hour,Seconds,Skew_Cloud_1,Skew_Cloud_2,Skew_Cloud_3,Skewness_0ft,Skewness_100ft, Skewness_200ft,Skewness_300ft,Skewness_400ft,Skewness_500ft,Skewness_600ft, Skewness_700ft,Skewness_800ft,Skewness_900ft,Skewness_1000ft,Skewness_1100ft, ... ,Skewness_24000ft,Skewness_24100ft,Skewness_24200ft,Skewness_24300ft, Skewness_24400ft,Skewness_24500ft,Skewness_24600ft,Skewness_24700ft, Skewness_24800ft,Skewness_24900ft,Skewness_25000ft 2001,121.947914,22.75,81900,-9999,-9999,-9999,0.94,0.07,-9999,-9999,-9999,-9999,-9999,-9999,-9999, -9999,-9999,-9999, ... 4.63,-4.63,-3.07,0,-4.63,-9999,4.63,-4.63,-9999,3.07,3.07 |
Kurtosis:
|
Header
records omitted Year,Julian_day,Hour,Seconds,Kurt_Cloud_1,Kurt_Cloud_2,Kurt_Cloud_3,Kurtosis_0ft,Kurtosis_100ft, Kurtosis_200ft,Kurtosis_300ft,Kurtosis_400ft,Kurtosis_500ft,Kurtosis_600ft, Kurtosis_700ft,Kurtosis_800ft,Kurtosis_900ft,Kurtosis_1000ft,Kurtosis_1100ft, ... ,Kurtosis_24000ft,Kurtosis_24100ft,Kurtosis_24200ft,Kurtosis_24300ft, Kurtosis_24400ft,Kurtosis_24500ft,Kurtosis_24600ft,Kurtosis_24700ft, Kurtosis_24800ft,Kurtosis_24900ft,Kurtosis_25000ft 2001,121.947914,22.75,81900,-9999,-9999,-9999,-0.24,-2.07,-9999,-9999,-9999,-9999,-9999, -9999,-9999,-9999,-9999,-9999, ... 20.22,20.22,7.74,9.52,20.22,-9999,20.22,20.22,-9999,7.74,7.74 |
Compiled annual data files of cloud base values and measurement statistics for the reported cloud base levels:
The cloud base values (m) and measurement statistics for the three reported cloud base levels (columns 5, 6, and 7 for each data type) have been consolidated in 3 annual comma-separated files.
The data file naming structure follows this pattern:
CD03_Ceilometer_cloud_level_only_YYYY.csv
Where YYYY will be 2001, 2002, or 2003.
For example: CD03_Ceilometer_cloud_level_only_2001.csv
Data file header and column descriptions:
|
Filename:CD03_Ceilometer_Cloud_level_only_2001.csv
File creation date: 08-June-2009
Associated LBA Data Set Inventory ID: CD03_Ceilometer_Km67 |
|||
| Column Number | Heading | Units/Formats | Description |
|---|---|---|---|
| 1 | Year | YYYY | Year |
| 2 | Day | Decimal day of year (GMT). Note: The values are the middle of the 30-minute averaging period. | |
| 3 | Hour | Decimal hour of the day (GMT). Note: The values are the middle of the 30-minute averaging period - 5.25 represents the average for the 05:00-05:30 time period. | |
| 4 | Seconds | Number of seconds into the day (GMT). | |
| 5 | BS_Cloud_1 | m | Cloud base for level 1 (m) - (a value of -9999 indicates no cloud base was detected) |
| 6 | BS_Cloud_2 | m | Cloud base for level 2 (m) - (a value of -9999 indicates no cloud base was detected) |
| 7 | BS_Cloud_3 | m | Cloud base for level 3 (m) - (a value of -9999 indicates no cloud base was detected) |
| 8 | SC_Cloud_1 | number | Sample Count for cloud base at level 1 - (a value of 0 indicates no cloud base was detected) |
| 9 | SC_Cloud_2 | number | Sample Count for cloud base at level 2 - (a value of 0 indicates no cloud base was detected) |
| 10 | SC_Cloud_3 | number | Sample Count for cloud base at level 3 - (a value of 0 indicates no cloud base was detected) |
| 11 | V_Cloud_1 | Variance for cloud base at level 1 - (a value of -9999 indicates no cloud base was detected) | |
| 12 | V_Cloud_2 | Variance for cloud base at level 2 - (a value of -9999 indicates no cloud base was detected) | |
| 13 | V_Cloud_3 | Variance for cloud base at level 3 - (a value of -9999 indicates no cloud base was detected) | |
| 14 | Skew_Cloud_1 | Skewness for cloud base at level 1 - (a value of -9999 indicates no cloud base was detected) | |
| 15 | Skew_Cloud_2 | Skewness for cloud base at level 2 - (a value of -9999 indicates no cloud base was detected) | |
| 16 | Skew_Cloud_3 | Skewness for cloud base at level 3 - (a value of -9999 indicates no cloud base was detected) | |
| 17 | Kurt_Cloud_1 | Kurtosis for cloud base at level 1 - (a value of -9999 indicates no cloud base was detected) | |
| 18 | Kurt_Cloud_2 | Kurtosis for cloud base at level 2 - (a value of -9999 indicates no cloud base was detected) | |
| 19 | Kurt_Cloud_3 | Kurtosis for cloud base at level 3 - (a value of -9999 indicates no cloud base was detected) | |
Example Cloud Base data file records:
| Header records omitted Year,Day,Hour,Seconds,BS_Cloud_1,BS_Cloud_2,BS_Cloud_3,SC_Cloud_1,SC_Cloud_2,SC_Cloud_3,V_Cloud_1, V_Cloud_2,V_Cloud_3,Skew_Cloud_1,Skew_Cloud_2,Skew_Cloud_3,Kurt_Cloud_1,Kurt_Cloud_2,Kurt_Cloud_3 2001,121.947914,22.75,81900,3992.88,-9999,-9999,1,0,0,-9999,-9999,-9999,-9999,-9999,-9999,-9999,-9999,-9999 2001,121.96875,23.25,83700,-9999,-9999,-9999,0,0,0,-9999,-9999,-9999,-9999,-9999,-9999,-9999,-9999,-9999 ... 2001,365.947906,22.75,81900,6596.29,6652.26,-9999,81,6,0,46.09,51.68,-9999,-0.43,-1.03,-9999,-0.61,-0.65,-9999 2001,365.96875,23.25,83700,6498.46,-9999,-9999,120,0,0,29.14,-9999,-9999,-0.55,-9999,-9999,-0.1,-9999,-9999 2001,365.989594,23.75,85500,6449.04,6656.07,-9999,115,4,0,30.27,187.22,-9999,0.85,0.71,-9999,2.08,-1.72,-9999 |
Site boundaries: (All latitude and longitude given in degrees and fractions)
| Site (Region) | Westernmost Longitude | Easternmost Longitude | Northernmost Latitude | Southernmost Latitude | Geodetic Datum |
|---|---|---|---|---|---|
| Para Western (Santarem) - km 67 Primary Forest Tower Site (Para Western (Santarem)) | -54.95900 | -54.95900 | -2.85700 | -2.85700 | World Geodetic System, 1984 (WGS-84) |
Time period:
- The data set covers the period 2001/04/07 to 2003/12/20.
- Temporal Resolution: Almost continuous data set.
Platform/Sensor/Parameters measured include:
- GROUND-BASED OBSERVATION / CEILOMETER (Vaisala, model CT25K) / CLOUD BASE
- GROUND-BASED OBSERVATION / CEILOMETER (Vaisala, model CT25K) / AEROSOL BACKSCATTER
3. Data Application and Derivation:
Typical Application of Data:
Ceilometers have been used to observe boundary-layer aerosols (e.g.
Zephoris et al. 2005) and boundary-layer mixing height (e.g. Eresmaa et
al. 2006).
The ceilometer is also able to detect rain droplets quite well through
the use of the
ceilometer backscatter profile. The rain droplets are a large target
for the laser
compared to other aerosols; therefore a strong, distinct return signal
is seen
from the cloud base to the surface on the backscatter profile. By
determining a
return-echo threshold value for rain droplets, rain events can be
detected from the
ceilometer backscatter profile. The threshold value can be verified
using tipping-bucket rain
gauge data from the same site.
Using the ceilometer data complements the
traditional rain-gauge
approach as the ceilometer detects all rain events, including light
ones when the rain
gauge may not catch any rainfall due to wind, etc. or not enough to
force a tip.
Second, the ceilometer gives the instantaneous start time for
precipitation,
whereas with the tipping bucket rain gauge, light precipitation may
have been falling
for several minutes before the first tip is recorded.
Calculated Variables:
The variables calculated include the backscatter coefficient Beta(z) at
profile heights from the surface to 25,000 feet at 100-foot (~30 m
resolution),
and is internally calculated by the software. The cloud-base heights
(up to three) are
also internally calculated by the software.
Processing Steps:
The raw data provided by the ceilometer were cloud-base and backscatter
profile information reported every 15 seconds. From these data, an
averaging
program was used to calculate the statistical moments (mean, variance,
skewness,
and kurtosis) of the cloud-base and backscatter profile at 30-minute
intervals. Each
cloud base level was averaged, as well as backscatter profile level. A
value of
-9999 was assigned if no cloud base was reported during the interval.
No further
processing of the raw data from the ceilometer was done before the
averaging program was
run on the data.
Processing Changes and Special corrections/Adjustments:
No changes or special corrections were made to the data during
processing.
4. Quality Assessment:
Errors and Limitations:
Potential sources of error may come from contamination of the
ceilometer window by dirt or debris. From the users guide, in these
instances it is stated that cloud height information is correct if it
is detected. If cloud base heights are not detected, high clouds may be
missed. Direct rain drops on the window are also a potential source of
error. However, this has a minimal impact because the ceilometer was
equipped with an internal blower which automatically turns on when
droplets hit the window to keep the window dry in such cases.
There are no known instances of the data-processing algorithm being unreliable. For the ceilometer used at the km 67 LBA site, the ceilometer window had a special protective coating applied to it for use in tropical environments. The window coating reacted with the environmental conditions (heat, humidity), causing pitting and permanent contamination of the window over time. Data collected after June 2003 had continuous warning messages reported; such data should be used with caution. Data collected in June 2003 or earlier had no continuous warning messages reported and are considered good.
Due to remoteness of the ceilometer
installation field site and difficulty in the logistics to maintain
continuous power to the site, there are frequent gaps in the
data set. No gap-filling was performed to this data set. Primary reasons
for data gaps are either power outages (failed generator) or a shutdown
in the data-acquisition computer or data-acquisition programs running
on that computer. Known prolonged data gaps are listed below. The
ceilometer was installed in April 2001, with the first good data being
collected on May 1, 2001 (day-of-year 121).
Data gaps in 2001:
Day-of-year 143-151 (May 23-31)
Day-of-year 161 (Jun 10)
Day-of-year 191 (Jul 10)
Day-of-year 197-199 (Jul 16-18)
Day-of-year 208-221 (Jul 27-Aug 9)
Day-of-year 224-225 (Aug 12-13)
Day-of-year 230 (Aug 18)
Day-of-year 233 (Aug 21)
Day-of-year 290-292 (Oct 17-19)
Data gaps in 2002:
Day-of-year 2-31 (Jan 2-31)
Day-of-year 84-112 (Mar 25-Apr 22)
Day-of-year 181-182 (Jun 30-Jul 1)
Day-of-year 198-203 (Jul 17-22)
Day-of-year 210-211 (Jul 29-30)
Day-of-year 331-335 (Nov 27-Dec 1)
Day-of-year 363-365 (Dec 29-31)
Data gaps in 2003:
Day-of-year 11-12 (Jan 11-12)
Day-of-year 44-90 (Feb 13-Mar 31)
Day-of-year 158-160 (Jun 7-9)
Day-of-year 168-169 (Jun 17-18)
Day-of-year 172-174 (Jun 21-23)
Day-of-year 179-181 (Jun 28-30)
Day-of-year 183-186 (Jul 2-5)
Day-of-year 197 (Jul 16)
Day-of-year 204 (Jul 23)
Day-of-year 216 (Aug 4)
Day-of-year 219-223 (Aug 7-11)
Day-of-year 239-292 (Aug 27-Oct 19)
Day-of-year 309-310 (Nov 5-6)
Day-of-year 315 (Nov 11)
Day-of-year 323-325 (Nov 19-21)
Day-of-year 357-365 (Dec 23-31)
Quality Assessment Activities:
All collected data were plotted and visually inspected by the submitter
following processing for validation. Numerous repeated data lines were
removed during this process. Data collected until June 2003 are
considered good. Continuous
warnings were reported from the ceilometer after June 2003 due to
window contamination; therefore data collected after June 2003 are not
considered good. Cloud-base measurement accuracy is 50
feet (~15 m).
5. Data Acquisition Materials and Methods:
A Vaisala CT-25K ceilometer was installed at
the km 67 Eddy Flux Tower site between April 2001 and December 2003,
with reliable data being collected between May 2001 and June 2003. The
CT-25K ceilometer employs pulsed diode laser LIDAR technology
(LIDAR=Light detection and ranging), where short, powerful laser pulses
are sent out in a vertical or near-vertical direction. The reflection
of light - backscatter - caused by haze, fog, mist, virga,
precipitation and clouds is measured as the laser pulses traverse the
sky. The resulting backscatter profile, i.e. signal strength versus
height, is stored and processed and the cloud bases are detected.
Knowing the speed of light, the time delay between the launch of the
laser pulse and the detection of the backscatter signal indicates the
cloud base height. The CT25K is able to detect three cloud layers
simultaneously. Along with cloud base measurements the ceilometer
provided 15 second measurements of a backscatter profile from the
surface to 25000 ft at 100 ft resolution.
Data from the ceilometer were sent out via an RS232 serial stream and
collected on a Linux computer that also collected eddy-flux data,
temperature, wind, humidity and CO2 profiles as well as radiation data.
The time stamps on the ceilometer data therefore correspond to these
other measurements collected at this site.
Due to the large amounts of data in each backscatter profile raw 15 second data was averaged to 5 minutes to perform rain identification analysis. Please note the 30-minute averaged ceilometer data submitted to this archive were created using the same averaging programs as the 5-minute-averaged data used in the rain-event identification analysis. The threshold value for precipitation was found to be between 1.2 and 1.5 (units are log(1000*srad*km)-1) based on the review of many days of rainfall data from a tipping bucket gauge at the same site. Histograms of backscatter intensity showed the largest decrease in the number of observed backscatter densities between 1.2 and 1.3 indicating the rain threshold since most of the time it is not raining. Thus we used a rain threshold value of 1.3. Additionally the heights at which to average the backscatter profile needed to be determined. Backscatter profile data was averaged three ways; first the lower 90 m (three range gates), second the lowest level up to 75 % of the cloud base height and finally the lowest level up to 50% of the cloud base height. Averaging the backscatter profile up to 50 % of the cloud base height produced the best results.
Additional details on ceilometer measurements and calculation of cloud base and backscatter is provided in the companion file, CD03_Ceilometer_Km67_Methods.pdf.
-
Sensors used include:
- CEILOMETER - Vaisala, model CT25K
6. Data Access:
This data is available through the Oak Ridge National Laboratory (ORNL) Distributed Active Archive Center (DAAC).
Data Archive Center:
Contact for Data Center Access Information:
E-mail: uso@daac.ornl.gov
Telephone: +1 (865) 241-3952
7. References:
Eresmaa, N., A. Karppinen, . M. Joffre, J. Rasanen, and H. Talvitie, 2006: Mixing height determination by ceilometer. Atmos. Chem. Phys., 6, 1485-1493.
Vaisala Oyj: Ceilometer CT-25K User's Guide.
Vantaa, Finland, 2002, 161
pp.
Zephoris, M., H. Holin, F. Lavie, N. Cenac, M. Cluzeau, O. Delas, F.
Eideliman, J. Gagneux, A. Gander, and C. Thibord, 2005: Ceilometer
observations of aerosol layer structure above the Petit Luberon during
ESCOMPTE's IOP 2. Atmos. Research, 74, 581-595.
doi:10.1016/j.atmosres.2004.06.014
Related Publications
- Czikowsky, M. J. 2008. Observing transient characteristics of the components of the hydrological balance. Ph.D. Thesis SUNY, Albany