Get Data
Summary:
This data set reports the measurement of stable carbon, nitrogen, and oxygen isotope ratios in organic material (plant, litter and soil samples) in forest canopy profiles and pasture (grasses and shrubs) as well as corresponding carbon and nitrogen tissue concentrations in a number of different sites across Brazil. The sampling design captured the temporal variation in rainfall from 1999-2004. Carbon and nitrogen isotope ratios can act as a proxy for interpreting aspects of the carbon and nitrogen cycles in Amazonian rainforests. Data are in three comma-delimited ASCII files.
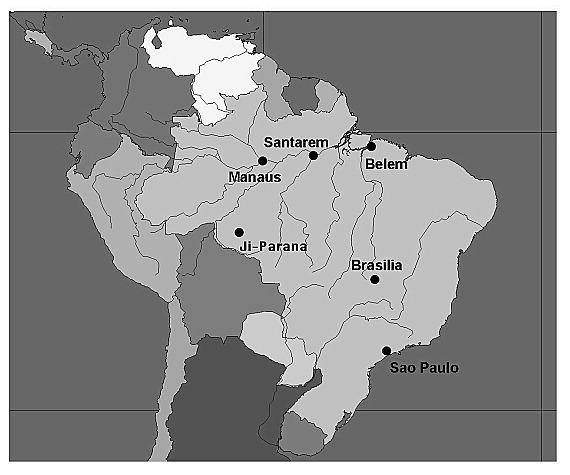
Figure 1. Map of Brazil and other countries in South America, with the locations of the cities (Santarém, Manaus, and Ji-Paraná) near the field sampling sites.
Data Citation:
Cite this data set as follows:
Ehleringer, J., L.A. Martinelli, J.P. Ometto, T.F. Domingues, L. Flanagan, J. Berry, C. Cook, and G.B. Nardoto. 2010. LBA-ECO CD-02 Carbon, Nitrogen, Oxygen Stable Isotopes in Organic Material, Brazil. Data set. Available on-line [http://daac.ornl.gov] from Oak Ridge National Laboratory Distributed Active Archive Center, Oak Ridge, Tennessee, U.S.A. doi: 10.3334/ORNLDAAC/983
Implementation of the LBA Data and Publication Policy by Data Users:
The LBA Data and Publication Policy [http://daac.ornl.gov/LBA/lba_data_policy.html] is in effect for a period of five (5) years from the date of archiving and should be followed by data users who have obtained LBA data sets from the ORNL DAAC. Users who download LBA data in the five years after data have been archived must contact the investigators who collected the data, per provisions 6 and 7 in the Policy.
This data set was archived in July 2010. Users who download the data between July 2010 and June 2015 must comply with the LBA Data and Publication Policy.
Data users should use the Investigator contact information in this document to communicate with the data provider. Alternatively, the LBA Web Site [http://lbaeco-archive.ornl.gov/] in Brazil will have current contact information.
Data users should use the Data Set Citation and other applicable references provided in this document to acknowledge use of the data.
Table of Contents:
- 1 Data Set Overview
- 2 Data Characteristics
- 3 Applications and Derivation
- 4 Quality Assessment
- 5 Acquisition Materials and Methods
- 6 Data Access
- 7 References
1. Data Set Overview:
Project: LBA (Large-Scale Biosphere-Atmosphere Experiment in the Amazon)
Activity: LBA-ECO
LBA Science Component: Carbon Dynamics
Team ID: CD-02 (Ehleringer / Martinelli)
The investigators were Cook, Craig; Domingues, Tomas Ferreira; Ehleringer, James; Flanagan, Lawrence; Martinelli, Luiz Antonio; Ometto, Jean Pierre H.B.; Berry, Joseph and Nardoto, Gabriela Bielefeld . You may contact Ehleringer, Jim (ehleringer@biology.utah.edu) .
LBA Data Set Inventory ID: CD02_C_N_O_Organic
This data set reports the measurement of stable carbon, nitrogen, and oxygen isotope ratios in organic material (plant, litter and soil samples) in forest canopy profiles and pasture (grasses and shrubs) as well as corresponding carbon and nitrogen tissue concentrations in a number of different sites across Brazil. Carbon and nitrogen isotope ratios can act as a proxy for interpreting aspects of the carbon and nitrogen cycles in Amazonian rainforests. The objective was to measure carbon and nitrogen isotope ratios of organic material (plant, litter and soil organic matter) in forest canopy profiles and pasture (grasses and shrubs) as well as corresponding carbon and nitrogen tissue concentrations in a number of different sites. The sampling design captured the temporal variation in rainfall over the course of several years. No future modifications of these data are planned.
-
For additional information, please see the following web site:
- Ehleringer LBA Web Site
2. Data Characteristics:
Data are in three comma-delimited ASCII files. In all files 9999 is used to signify missing data points.
File 1: LBA-ECO_CD02_Stable_Isotope_CNO_Organic_Matter.csv
Contains stable isotope data on C, N and O from organic matter
collected at LBA ECO focus regions in Amazonia, Para, and Rondonia between
March 1999 and August 2004:
- Amazonas (Manaus), Sites: ZF2 - Transect E-W, ZF2 km 14, ZF3
- Para Western (Santarem), Sites: SECA Control, km 77, km 67, km 83, km 117, SECA Dry, Mojui
- Rondonia, Sites: Jaru Biological Reserve Tower A ( Rebio), Fazenda Nossa Senhora (Fz N Senhora)
| Column number | Column heading | Units/format | Description |
|---|---|---|---|
| 1 | Region | Sampling region | |
| 2 | Site | Sampling site | |
| 3 | Latitude | degrees | Location in decimal degrees ( += N and - = S) |
| 4 | Longitude | degrees | Location in decimal degrees (+= E and - = W) |
| 5 | Ecosystem | Vegetation forest or pasture | |
| 6 | Description | Information about the sample recorded in the field, may include; canopy position, life form, common name, scientific name, plot | |
| 7 | Sample_type | Values are leaves, litter, or soil | |
| 8 | Year | YYYY | Year of sample collection |
| 9 | Month | MM | Month of sample collection |
| 10 | Height | meters | Sampling height |
| 11 | Time | HH:MM | Sampling time 24 hour clock in local time which is UTC -4 for all sites and sampling dates |
| 12 | delta_15N | parts per mil | Isotopic ratio of 15N/14N in organic material referenced to N2, measured with continuous flow on Finigan Delta Plus at CENA |
| 13 | delta_13C | parts per mil | Isotopic ratio of 13C/12C in organic material referenced to PDB, measured with continuous flow on Finigan Delta Plus at CENA |
| 14 | C | % | Carbon content referenced to working standard at CENA (Centro de Energia Nuclear na Agricultura at the University of Sao Paulo) |
| 15 | N | % | Nitrogen content referenced to working standard at CENA (Centro de Energia Nuclear na Agricultura at the University of Sao Paulo) |
| 16 | C_to_N | Mass based ratio of carbon to nitrogen | |
| 17 | delta_18O | parts per mil | Isotopic ratio of 18O/16O in cellulose referenced to SMOW, measured with continuous flow on Finigan Delta Plus at CENA |
| missing data are represented by 9999 (note this value is used rather than the more common -9999 due to the large number of negative values for delta variables) | |||
Example data records:
| Region,Site,Latitude,Longitude,Ecosystem,Description,Sample_type,Year,Month,Height,Time,delta_15N,delta_13C,C,N,C_to_N,delta_18C Manaus,ZF2 - Transect E-W,-2,-61,2500 m,Litter,1999,3,0,-999,4.3,-31.1,45.33,1.82,25.01,9999 Manaus,ZF2 - Transect E-W,-2,-61,2500 m,Litter,1999,3,0,-999,4.8,-32.6,43.54,1.21,36.21,9999 Manaus,ZF2 - Transect E-W,-2,-61,2500 m,Litter,1999,3,0,-999,4.3,-30.9,43.92,1.66,26.54,9999 ... Santarem,Mojui,-2.76667,-54.5792,Pasture,Shrub,Leaves,2002,10,0.5,14:30,6.9,-29.6,47.5,1.9,24.62,9999 Santarem,Mojui,-2.76667,-54.5792,Pasture,Shrub,Leaves,2002,10,0.5,14:33,8.1,-31.5,45.68,1.3,36.35,9999 ... Santarem,SECA Dry,-2.857,-54.959,Forest,Ucuubarana,2004,8,16,-999,6.2,-32.5,50.93,1.72,29.62,9999 Santarem,SECA Dry,-2.857,-54.959,Forest,Muirapiranga branca,Leaves,2004,8,20,-999,9.8,-31.5,41.008,1.97,20.9,9999 Santarem,SECA Dry,-2.857,-54.959,Forest,Quaruba branca,Leaves,2004,8,24,-999,5.4,-30.2,42.76,1.27,33.69,9999 |
File 2: LBA-ECO-CD02_Stable_Isotopes_CN_Leaf_tissue.csv Contains data on leaf tissue C and N concentrations as well as stable isotope values for both elements for foliage collected in and around the three eddy flux tower sites near Santarem Para between November 1999 and December 2003:
- Para Western (Santarem): km 67 Seca-Floresta (SECA Control) Site
- Para Western (Santarem): km 77 Pasture Tower Site
- Para Western (Santarem): km 67 Primary Forest Tower Site
- Para Western (Santarem): km 83 Logged Forest Tower Site
- Para Western (Santarem): Mojui
| Column number | Column heading | Units/format | Description |
|---|---|---|---|
| 1 | Year | YYYY | Year of sample collection |
| 2 | Month | MM | Month of sample collection |
| 3 | Season | Season (Dry or Wet) | |
| 4 | Species | Where identified: vegetation genus and species | |
| 5 | Site | Sampling site | |
| 6 | Longitude | Location in decimal degrees ( += E and - = W) | |
| 7 | Latitude | Location in decimal degrees ( += N and - = S) | |
| 8 | Treatment | Logged forest, primary forest or pasture | |
| 9 | Height | m | Sampling height |
| 10 | Funct_group | Functional group broadly defined as canopy position (Grass, Liana, Mid Canopy, Sapling, Top Canopy, Understory) | |
| 11 | Obs | Field observations | |
| 12 | Leaf_area | m^2 | Leaf area in square meters |
| 13 | Leaf_dry | g | Weight after drying at 65 degrees C |
| 14 | SLA | m^2 g^-1 | Specific leaf area calculated as area/ mass |
| 15 | SLW | g m^-2 | Specific leaf weight calculated as mass/area |
| 16 | delta_15N | per mil | Isotopic ratio of 15N/14N in organic material referenced to N2, measured with continuous flow on Finigan Delta Plus at CENA |
| 17 | delta_13C | per mil | Isotopic ratio of 13C/12C in organic material referenced to PDB, measured with continuous flow on Finigan Delta Plus at CENA |
| 18 | C | % | Concentration of C in organic matter measured by combustion on an elemental analyzer at CENA |
| 19 | N | % | Concentration of N in organic matter measured by combustion on an elemental analyzer at CENA |
| 20 | C_to_N | Mass based ratio of C to nitrogen | |
| 21 | N_pool_mass | g g^-1 | Nitrogen pool per g leaf tissue |
| 22 | N_pool_area | g m^-2 | Nitrogen pool per m squared leaf area |
| missing data are represented by 9999 ( note this value is used rather than the more common -9999 due to the large number of negative values for delta variables) | |||
Example data records:
|
Year,Month,Season,Species,Site,Longitude,Latitude,Treatment,Height,Funct-group,obs,Leaf_area,Leaf_dry,SLA,SLW,delta-15N,delta_13C,C,N,C_to_N,N_pool_mass,N_pool_area 1999,11,Dry,Brachiaria brizantha,km 77,-3.0202,-54.959,Pasture,9999,Grass,Light 1,9999,9999,9999,9999,3.3,-13.3,40.5,0.7,60.49,0.0007,9999 1999,11,Dry,Brachiaria brizantha,km 77,-3.0202,-54.959,Pasture,9999,Grass,Light 2,9999,9999,9999,9999,2.1,-12.9,37.4,1,39.34,0.01,9999 1999,11,Dry,Tachigalia myrmecophila,SECA Control,-2.857,-54.959,Primary Forest,27,Top Canopy,Light 1,0.007,9999,9999,9999,7,-29.5,49.3,3.4,14.34,0.034,9999 ... 2001,3,Wet,Brachiaria brizantha,km 77,-3.0202,-54.959,Pasture,1,Grass,Light 1,0.0057,0.4166,0.014,72.51,3.44,-12.33,40.45,1.26,32.23,0.013,0.91 2001,3,Wet,Brachiaria brizantha,km 77,-3.0202,-54.959,Pasture,1,Grass,CO2 1,0.0067,0.4752,0.014,71.25,0.65,12.06,40.85,1.21,33.76,0.012,0.86 2001,3,Wet,Brachiaria brizantha,km 77,-3.0202,-54.959,Pasture,1,Grass,RH% 1,0.0044,0.2809,0.016,63.76,-0.15,-11.61,42.52,1.24,34.29,0.012,0.79 ... 2003,12,Dry,Memora tanaeciicarpa,SECA Control,-2.857,-54.959,Primary Forest,27,Liana,light,0.0058,0.59,0.01,101.1,7.55,-29.64,43.44,2.46,17.66,0.025,2.49 2003,12,Dry,Memora tanaeciicarpa,SECA Control,-2.857,-54.959,Primary Forest,27,Liana,CO2,0.0056,0.519,0.011,93.07,7.26,-29.97,43.555,2.42,18.04,0.024,2.25 2003,12,Dry,Memora tanaeciicarpa,SECA Control,-2.857,-54.959,Primary Forest,27,Liana,RH,0.003,0.371,0.008,122.35,8.28,-29.19,43.69,2.23,19.59,0.022,2.73 |
File 3:
LBA-ECO_CD02_Geographic_Variability_CN_Organic_Matter.csv
Contains C and N concentration and delta 13C and delta 15N as well as
Ca and P concentrations for foliar tissue from five different study
sites in the Amazon region:
- Santarem: Flona Site km 67
- Manaus: ZF2 Site km 34 - north-south transect (plateau and swale)
- Manaus: ZF2 Site km 25 - campinarana
- Sao Gabriel da Cachoeira: National Park of Pico da Neblina
- Brasilia: IBGE Reserve
In addition there are C and N concentrations and delta stable isotope values for wood and soil organic matter from the same 5 study sites. All data in this file was collected between January 2002 and October 2003.
| Column number | Column heading | Units/format | Description |
|---|---|---|---|
| 1 | Site | Research Site | |
| 2 | Longitude | degrees | Location in decimal degrees ( += E and - = W) |
| 3 | Latitude | degrees | Location in decimal degrees ( += N and - = S) |
| 4 | Year | YYYY | Year of sample collection |
| 5 | Month | MM | Month of sample collection |
| 6 | Sample_type | Sample type: Leaves, Litter, or Soil | |
| 7 | Family | Vegetation family | |
| 8 | Species | Vegetation species from Manaus and Sao Gabriel identified by Carneiro and Pereira, INPA, Manaus, AM, Brazil | |
| 9 | Legumes_non-legumes | Species are classified as belonging to the Legume family or not | |
| 10 | Soil_depth | cm | Soil depth in centimeters (cm) |
| 11 | Notes | Field observations which may include a description of the vegetation type ( burned cerrado,unburned cerrado, or campiranha), topography (plateau or swale) or if the sample was collected from a liana or a location in the subcanopy | |
| 12 | delta_13C | per mil | Isotopic ratio of 13C/12C in organic material referenced to PDB, measured with continuous flow on Finigan Delta Plus at CENA |
| 13 | C | % | Carbon content referenced to working standard at CENA (Centro de Energia Nuclear na Agricultura at the University of Sao Paulo) |
| 14 | delta_15N | per mil | Isotopic ratio of 15N/14N in organic material referenced to N2, measured with continuous flow on Finigan Delta Plus at CENA |
| 15 | N | % | Nitrogen content referenced to working standard at CENA (Centro de Energia Nuclear na Agricultura at the University of Sao Paulo) |
| 16 | C_to_N | Mass ratio of carbon to nitrogen | |
| 17 | Ca | g kg^-1 | Calcium concentration determined by nitric acid digest and measured on an atomic absorption spectrophotometer at CENA |
| 18 | P | g kg^-1 | Phosphorus concentration determined by nitric acid digest method and measured on a spectrophotometer at CENA |
|
missing data are represented by 9999 ( note this value is used rather than the more common -9999 due to the large number of negative values for delta variables) |
|||
Example data records:
| Site,Longitude,Latitude,year,Month,Sample_type,Family,Species,Legumes_non-legumes,Soil_depth,Notes,delta_13C,C,delta_15N,N,C_to_N,Ca,P km 67,-54.95,-2.85,2003,6,Leaves,Caesalpiniaceae,Chamaecrista xinguensis,Legumes,9999,None,-33.23,53.74,7.48,3.63,14.79,9999,9999 km 67,-54.95,-2.85,2003,6,Leaves,Caesalpiniaceae,Chamaecrista xinguensis,Legumes,9999,None,-33.79,47.21,7.74,3.21,14.71,9999,9999 km 67,-54.95,-2.85,2003,6,Leaves,Caesalpiniaceae,Chamaecrista xinguensis,Legumes,9999,None,-32.69,49.4,6.91,4.06,12.18,9999,9999 ... ZF2 km 34,-60,-2.5,2003,5,Leaves,Caesalpiniaceae,Batesia floribunda Spruce ex Benth.,Legumes,9999,plateau,-30.42,52.51,2.53,1.55,33.81,9999,9999 ZF2 km 34,-60,-2.5,2003,5,Leaves,Caesalpiniaceae,Batesia floribunda Spruce ex Benth.,Legumes,9999,plateau,-30.46,50.42,3.91,2.61,19.3,4.81,0.6 ZF2 km 34,-60,-2.5,2003,5,Leaves,Caesalpiniaceae,Batesia floribunda Spruce ex Benth.,Legumes,9999,plateau,-31.96,49.92,1.33,1.63,30.6,5.8,0.46 ... IBGE Reserve,-47.51,-15.15,2002,7,Soil,Not provided,Not provided,Not provided,20 to 30,unburned,-23.88,3.15,6.47,0.15,21.18,9999,9999 IBGE Reserve,-47.51,-15.15,2002,7,Soil,Not provided,Not provided,Not provided,30 to 40,unburned,-23.19,3.02,7.87,0.16,19.07,9999,9999 IBGE Reserve,-47.51,-15.15,2002,7,Soil,Not provided,Not provided,Not provided,40 to 50,unburned,-23.03,1.98,8.6,0.1,19.33,9999,9999 |
Site boundaries: (All latitude and longitude given in degrees and fractions)
| Site (Region) | Westernmost Longitude | Easternmost Longitude | Northernmost Latitude | Southernmost Latitude | Geodetic Datum |
|---|---|---|---|---|---|
| Rondonia - Fazenda Nova Vida (Rondonia) | -62.811 | -62.811 | -10.156 | -10.156 | World Geodetic System, 1984 (WGS-84) |
| Amazonas (Manaus) - ZF2 km 34 (Amazonas (Manaus)) | -60.20910 | -60.00000 | -2.50000 | -2.60900 | World Geodetic System, 1984 (WGS-84) |
| Para Western (Santarem) - km 67 Primary Forest Tower Site (Para Western (Santarem)) | -54.95900 | -54.95900 | -2.85700 | -2.85700 | World Geodetic System, 1984 (WGS-84) |
| Para Western (Santarem) - km 67 Seca-Floresta Site (Para Western (Santarem)) | -55.00000 | -55.00000 | -2.75000 | -2.75000 | World Geodetic System, 1984 (WGS-84) |
| Para Western (Santarem) - km 83 Logged Forest Tower Site (Para Western (Santarem)) | -54.97070 | -54.97070 | -3.01700 | -3.01700 | World Geodetic System, 1984 (WGS-84) |
| Para Western (Santarem) - km 77 Pasture Tower Site (Para Western (Santarem)) | -54.88850 | -54.88850 | -3.02020 | -3.02020 | World Geodetic System, 1984 (WGS-84) |
| Para Western (Santarem) - Mojui (Para Western (Santarem)) | -54.57917 | -54.57917 | -2.76667 | -2.76667 | World Geodetic System, 1984 (WGS-84) |
| Amazonas (Manaus) - ZF2 km 14 (Amazonas (Manaus)) | -60.11520 | -60.11520 | -2.58900 | -2.58900 | World Geodetic System, 1984 (WGS-84) |
| Amazonas (Manaus) - ZF3 Fazenda Dimona (Amazonas (Manaus)) | -59.00000 | -59.00000 | -2.00000 | -2.00000 | World Geodetic System, 1984 (WGS-84) |
| Rondonia - Jaru Biological Reserve Tower A (Rondonia) | -61.93090 | -61.93090 | -10.08320 | -10.08320 | World Geodetic System, 1984 (WGS-84) |
| Amazonas (Manaus) - ZF2 km 25 - INPA Forest Management Site (Amazonas (Manaus)) | -61.00000 | -61.00000 | -2.00000 | -2.00000 | World Geodetic System, 1984 (WGS-84) |
| Brasilia - Reserva Ecologica do Roncador IBGE (Brasilia) | -47.85060 | -47.85060 | -15.93280 | -15.93280 | World Geodetic System, 1984 (WGS-84) |
| Amazonas (Manaus) - Pico Da Neblina National Park (Amazonas (Manaus)) | -66.50000 | -66.50000 | 0.48300 | 0.48300 | World Geodetic System, 1984 (WGS-84) |
Time period:
- The data set covers the period 1999/03/01 to 2004/08/31.
- Temporal Resolution: Quarterly and monthly
Platform/Sensor/Parameters measured include:
- LABORATORY / MASS SPECTROMETER / STABLE ISOTOPES
- LABORATORY / AA (ATOMIC ABSORPTION SPECTROMETER) / LEAF CHARACTERISTICS
3. Data Application and Derivation:
Tropical forests play a central role in the global carbon cycle and improving our understanding of the factors that influence net carbon gain or loss in these ecosystems will improve our understanding of the global carbon cycle. Carbon isotope ratio analyses of plant materials can provide insight into carbon cycle dynamics by providing a quantitative assessment of stomatal limitations to photosynthesis (Farquhar et al. 1989, Ehleringer and Monson 1993) . Variations in the delta 13C of leaves in tropical forests are strongly correlated with position in the canopy profile with lighter foliar delta 13C (more negative) values found in the understory as compared to the canopy (Medina and Minchin 1980, Ehleringer et al. 1986). Variations in delta 13C values between sites may be driven by differences in forest stand structure and resulting effects on light availability and vapor pressure deficit.
Nitrogen isotope ratios provide information about N cycling within ecosystems (Hogberg 1990, Evans and Ehleringer 1993, Martinelli et al. 1999 and many more). Foliar and soil delta 15N patterns in tropical forests have been shown to be elevated relative to values in temperate forests (Martinelli et al. 1999). This pattern may be a result of gaseous N losses associated with microbial metabolism (Austin and Vitousek 1998) or the abundance of leguminous trees and their associated N fixing abilities in tropical forests.
Both N and C isotopes and the variability in delta values within and across sites may be used as a proxy for interpreting aspects of the C and N cycles in Amazonian rainforests.
4. Quality Assessment:
Stable isotope ratios of carbon and nitrogen were measured relative to international recognized standards. Internal working standards (Atropine and soil standard no. 502-308 from LECO Corporation) were included in every run, as regular laboratory procedure. The precision of measurements was plus or minus 0.3 %, 0.1 %, 0.25 per mil and 0.35 per mil for C, N, delta 13C and delta 15N, respectively. Precision for P and Ca analyzes were Ca (3%) and P (<1%).
5. Data Acquisition Materials and Methods:
Leaf samples were collected from plants along a height profile through the canopy at all sites during each study period. Three samples of leaf litter were randomly collected from each study site during each sample trip. All samples were oven-dried at 65 degrees C until constant weight and then ground to a fine powder. Soil samples were air-dried, sieved using a 2-mm mesh and homogenized. A smaller sub-sample was taken, handpicked to remove fine roots and other debris and then pounded. A 1.5-2 mg sub-sample of ground material or 15-20 mg sub-sample of pounded soil were placed and sealed in a tin capsule and loaded into a ThermoQuest-Finnigan Delta Plus isotope ratio mass spectrometer (Finnigan-MAT; CA, USA) in line with an Elemental Analyzer (Carla Erba model 1110; Milan, Italy) at the Laboratory of Isotope Ecology (CENA-USP, Brazil). From these analyzes we obtained both isotope ratio (delta 13C and delta 15N and in a limited number of cases delta 18O from cellulose) as well as tissue elemental content (C and N). Foliar Ca and P concentrations were determined after a tissue digestion with nitric acid + perchloric acid (5:1). P concentrations were determined using color spectrophotometry, Ca concentrations were determined using Atomic Absorption spectrophotometry with the addition of 0.25% Lanthanum oxide solution (to avoid Al interference).
6. Data Access:
This data is available through the Oak Ridge National Laboratory (ORNL) Distributed Active Archive Center (DAAC).
Data Archive Center:
Contact for Data Center Access Information:
E-mail: uso@daac.ornl.gov
Telephone: +1 (865) 241-3952
7. References:
Austin, A and PM Vitousek. 1998. Nutrient dynamics on a precipitation gradient. Oecologia 113:519-529.
Ehleringer, JR et al. 1986. Leaf carbon isotope and mineral composition in subtropical plants along an irradiance cline. Oecologia 70: 520-526
Ehleringer, JR and RK Monson. 1993. Evolutionary and ecological aspects of photosynthetic pathway variation. Ann Rev. Ecol. Systemat. 24: 411-439.
Evans, RD and JR Ehleringer. 1993. A break in the nitrogen cycle in aridlands? Evidence from delta 13N of soils. Oecologia 94: 314-317
Farquhar, GD et al. 1989. Carbon isotope discrimination and photosynthesis. Ann. Rev. Plant Physiol. Plant Mol. Biol. 40: 503-537.
Hogberg, P. 1990. 15N natural abundance as a possible marker of the ectomycorrhizal habit of trees in mixed African woodlands. New Phytol. 115: 483-486.
Martinelli, LA et al. 1999. Nitrogen stable isotopic composition of leaves and soil: tropical vs. temperate forests. Biogeochemistry 46:45-65.
Medina, E. and P. Minchin. 1980. Stratification of delta 13C values of leaves in Amazonian rainforests. Oecologia 45: 355-378.
Related Publications
- Ometto, J.P.H.B., L.B. Flanagan, L.A. Martinelli, M.Z. Moreira, N. Higuchi, and J.R. Ehleringer. (2002) Carbon isotope discrimination in forest and pasture ecosystems of the Amazon Basin, Brazil. Global Biogeochemical Cycles 16(4):1109, doi:10.1029/2001GB001462.
- Ometto, J.P.H., L.B. Flanagan, L.A. Martinelli, and J.R. Ehleringer. (2005) Oxygen isotope ratios of waters and respired CO2 in Amazonian forest and pasture ecosystems. Ecological Applications 15(1):58-70.
- Ehleringer JR, Bowling DR, Flanagan L, Fessender J, Helliker B, Martinelli LA; Ometto JPHB (2002) Stable isotopes and carbon cycle in forests and grasslands. Plant Biology, 4: 181-189
- Ometto, J.P.H.B., J.R. Ehleringer, T.F. Domingues, J.A. Berry, F.Y. Ishida, E. Mazzi, N. Higuchi, L.B. Flanagan, G.B. Nardoto, and L.A. Martinelli. 2006. The stable carbon and nitrogen isotopic composition of vegetation in tropical forests of the Amazon Basin, Brazil. Biogeochemistry 79(1-2):251-274.
- Martinelli LA, Ometto JPHB, Ishida FY, Domingues TF, Nardoto GB, Oliveira RS, Ehleringer JR. The use of carbon and nitrogen stable isotopes to track effects of land-use changes in the Brazilian Amazon region. In: TE Dawson & RTW Siegwolf (Eds), Stable isotopes as indicators of ecological changes. Elsevier, San Francisco, EUA, p. 301-318, 2007