Documentation Revision Date: 2016-07-26
Data Set Version: V1
Summary
These measurements are one part of an innovative multi-instrument remote sensing payload flown for the CARVE campaign.
There are 121 data files in netCDF (*.nc) format, one for each CARVE campaign flight, with this data set. Note that data from 2015 have not been released yet.
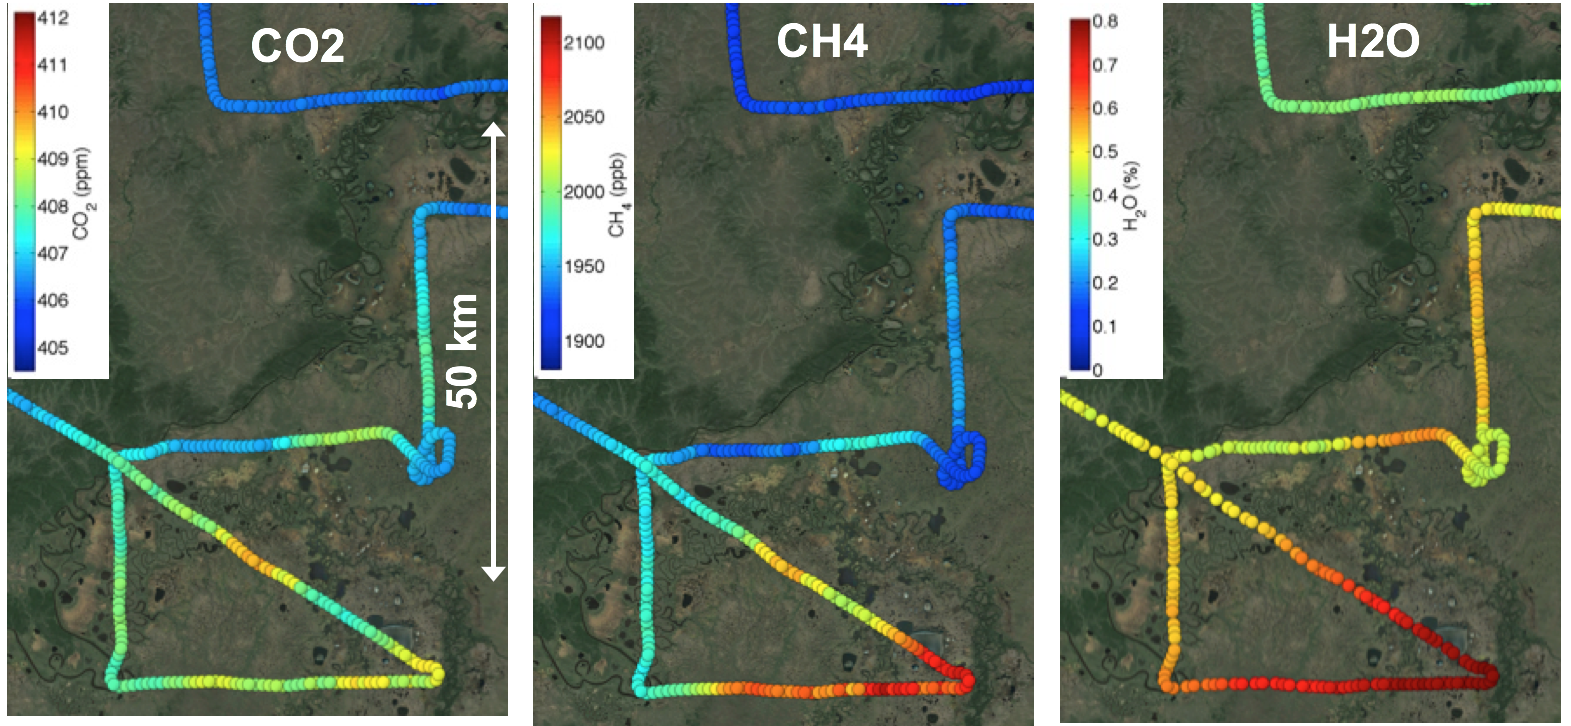
Figure 1: Carbon dioxide, methane, and water vapor concentrations measured during a CARVE flight over the Innoko National Wildlife Refuge, Alaska, on 4 May 2015
Citation
Sweeney, C., J.B. Miller, A. Karion, S.J. Dinardo, and C.E. Miller. 2016. CARVE: L2 Atmospheric CO2, CO and CH4 Concentrations, NOAA CRDS, Alaska, 2012-2015. ORNL DAAC, Oak Ridge, Tennessee, USA. http://dx.doi.org/10.3334/ORNLDAAC/1401
Table of Contents
- Data Set Overview
- Data Characteristics
- Application and Derivation
- Quality Assessment
- Data Acquisition, Materials, and Methods
- Data Access
- References
Data Set Overview
Project: Carbon in Arctic Reservoirs Vulnerability Experiment (CARVE)
The Carbon in Arctic Reservoirs Vulnerability Experiment (CARVE) collected detailed measurements of greenhouse gases on local to regional scales in the Alaskan Arctic and demonstrated new remote sensing and improved modeling capabilities to quantify Arctic carbon fluxes and carbon cycle-climate processes. CARVE science fills a critical gap in Earth science knowledge and satisfies high priority objectives across NASA’s Carbon Cycle and Ecosystems, Atmospheric Composition, and Climate Variability & Change focus areas as well as the Air Quality and Ecosystems elements of the Applied Sciences program. CARVE data also complements and enhances the science return from current NASA and non-NASA sensors.
Related Data:
Airborne CARVE greenhouse gas concentrations merged from both the NOAA and Harvard Picarro CRDS instruments are also available: CARVE: L2 Merged Atmospheric CO2, CO, O3 and CH4 Concentrations, Alaska, 2012-2015
A full list of CARVE data products is available at: https://carve.ornl.gov/dataproducts.html
Data Characteristics
Spatial Coverage: CARVE flights over the Alaskan and Canadian Arctic
Spatial Resolution: Point measurements
Temporal Coverage: Periodic flights occurred during the growing seasons (approx. March – November) of 2012 through 2015.
Temporal Resolution: All measurements were interpolated to 2-second intervals for distribution with this data set.
Study Area (coordinates in decimal degrees)
|
Site |
Westernmost Longitude |
Easternmost Longitude |
Northernmost Latitude |
Southernmost Latitude |
|
Alaskan and Canadian Arctic |
-168.11 |
-131.75 |
71.56 |
60.21 |
Data File Information
All data are stored in NetCDF (*.nc) version 4 file format. Each file provides measurements of dry mole fractions of atmospheric CO2, CH4, and CO, and the H2O concentration acquired during a single flight. A 3-species instrument (CO2, CH4, H2O) was used for 2012 flights. Thus, CO values in the 2012 data files are set to -999.9 for consistency of file structure across the entire data set. All four gas species are included in the data files for 2013 - 2015.
Table 1. CARVE file naming convention. Example file name: carve_AtmosISGA_L2_N_b23_20120524_20150713021204.nc
|
Name element |
Example value |
Units |
|
Project name |
carve |
|
|
Instrument |
AtmosISGA |
|
|
Processing level |
L2 |
|
|
Investigator group |
N |
NOAA ESRL group |
|
Build ID |
b23 |
|
|
Flight date |
20120524 |
yyyymmdd |
|
Processing date and time |
20150713021204 |
yyyymmddhhmmss |
Data variables
Each file contains 8 geolocation variables and 8 science measurement variables described in Table 2.
Table 2. Data variables in each netCDF file. Fill value or missing data were set to -999.9 for all variables.
|
Variable name |
Description |
Units |
|
Geolocation measurements |
|
|
|
center_lat |
latitude |
degrees North |
|
center_lat_standard_error |
latitude standard_error |
degrees North |
|
center_lon |
longitude |
degrees east |
|
center_lon_standard_error |
longitude standard error |
degrees east |
|
height |
height of aircraft above ground |
meters |
|
height_standard_error |
height standard error |
meters |
|
geolocation_qc |
geolocation status flag |
0 = Success, 1 = Error |
|
time |
time |
seconds since 1980-1-6 0:0:0 |
|
Science measurements |
|
|
|
co |
Carbon monoxide dry mole fraction measurements at 2-second intervals |
parts per billion (1x10^-9) |
|
co_qc |
QC flag for carbon monoxide measurements |
see Table 3 |
|
co2 |
Carbon dioxide dry mole fraction measurements at 2-second intervals |
parts per million (1x10^-6) |
|
co2_qc |
QC flag for carbon dioxide measurements |
see Table 3 |
|
ch4 |
Methane dry mole fraction measurements at 2-second intervals |
parts per billion (1x10^-9) |
|
ch4_qc |
QC flag for methane measurements |
see Table 3 |
|
h2o |
Water vapor concentration at 2-second intervals |
percent (1x10^-2) |
|
h2o_qc |
QC flag for water vapor measurements |
see Table 3 |
Table 3. QC flag value descriptions
|
QC Flag |
Flag Meaning |
Description |
|
0 |
Valid |
|
|
1 |
OutOfRange |
CO, CO2, or CH4 mole fractions are above or below the laboratory standards used to calibrate the instrument. If water vapor H20 > 3%, all three gases received a 1 flag. Laboratory standards for each year are listed in Table 4. |
|
2 |
CavityAnomaly |
Substantial variation in cavity pressure and/or temperature during course of observation |
|
3 |
SuspectedLeak |
Variation in cavity pressure is beyond 139.5-140.5 torr or the cavity temperature is beyond 44.98-45.02 C |
Calibration:
CO2, CH4, and CO measurements are reported on their respective World Meteorological Organization (WMO) standard scales:
- NOAA 2007 CO2 standard scale (see Zhao and Tans, 2006)
- NOAA 2004 CH4 standard scale (see Dlugokencky et al., 2005)
- NOAA 2004 CO standard scale (see Novelli et al., 1991)
H2O measurements used the manufacturer’s calibration.
Application and Derivation
These data files contain high-frequency atmospheric CO2, CH4, CO, and H2O content observations for CARVE flights during March– November of 2012 to 2015. The CARVE project was designed to collect detailed measurements of important greenhouse gases on local to regional scales in the Alaskan arctic and demonstrate new remote sensing and improved modeling capabilities to quantify Arctic carbon fluxes and carbon cycle-climate processes. The CARVE data provide insights into Arctic carbon cycling that may be useful in numerous applications.
Quality Assessment
Continuous measurements from the NOAA CRDS instrument were calibrated against on-board standard gas samples once every 30 minutes by an automated system.
Table 4. Laboratory uncertainty standards from calibration of CRDS instrument. These values represent the maximum and minimum concentrations of standard gases used to calibrate the instrument in the given year. These values are for the user’s reference since the line absorption is expected to remain fairly linear.
|
Gas |
2012 |
2013 |
2014 |
|
CO (ppb) |
NA |
30 - 252 |
82 - 409 |
|
CO2 (ppm) |
355.36 - 471.12 |
362.8 - 474.3 |
375.4 - 460.0 |
|
CH4 (ppb) |
1706.5 - 1874.4 |
1706.5 - 2161.9 |
1761 - 3049 |
Allan variance analyses of the Picarro signals against calibrated gas samples demonstrated excellent performance. Measured precisions (1 std) for 2.5-second integration times are 0.012 ppm for CO2, 0.118 ppb for CH4, and 2.319 ppb for CO. This outstanding performance provides CARVE with high sensitivity to rapid changes in atmospheric concentrations of these gases.
Data Acquisition, Materials, and Methods
CARVE Flights
These data represent one part of the data collected by the Carbon in Arctic Reservoirs Vulnerability Experiment. A C-23 Sherpa aircraft made frequent flights out of Fairbanks, Alaska between March and November over multiple years, observing the spring thaw, summer draw-down, and fall refreeze of the Arctic growing season. Flights concentrate observations on three study domains: the North Slope, the interior, and the Yukon River valley. North Slope flights cover regions of tundra and continuous permafrost and were anchored by flux towers in Barrow, Atqasuk, and Ivotuk. Flights to Prudhoe Bay characterize the CO2 and CH4 emissions from oil and natural gas processing plants. Flights over interior Alaska sample discontinuous permafrost, boreal forests, and wetlands. A complete list of CARVE flights can be found at: https://carve.ornl.gov/flights.html. Flight paths and atmospheric gas concentrations for CARVE surveys can be visualized through the CARVE Flight Data Visualization Tool (http://carve.ornl.gov/visualize) and are illustrated in Figure 2.
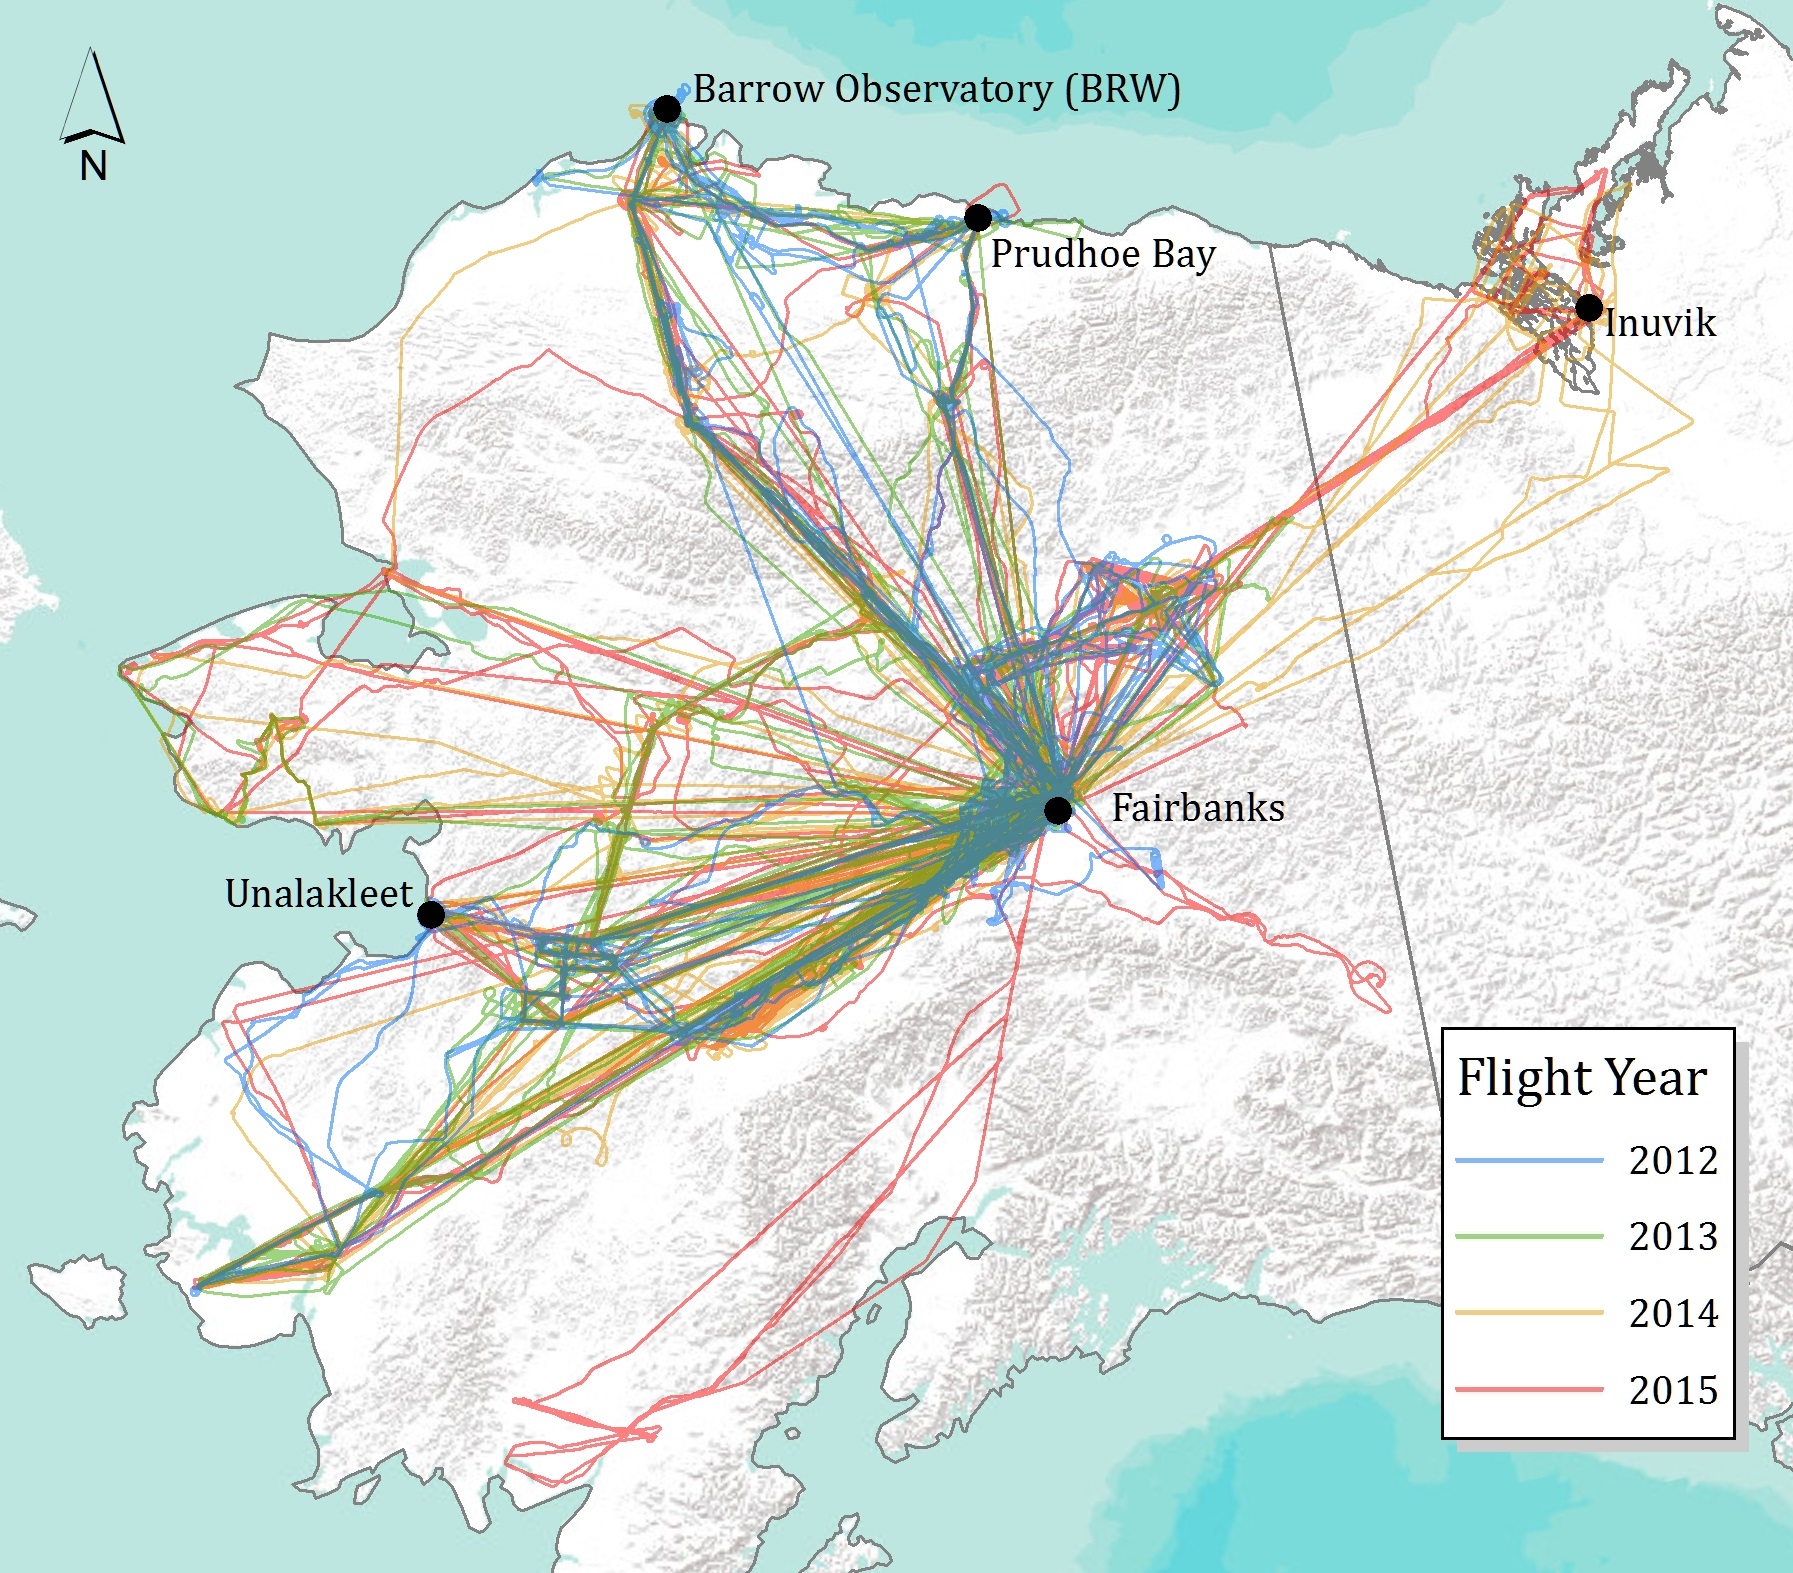
Figure 2. CARVE flights during 2012-2015 delivered measurements over continuous and discontinuous permafrost regimes.
The CARVE aircraft carried a remote sensing and atmospheric sampling payload consisting of the following instruments: a passive/active L-band system (PALS), a Fourier transform spectrometer (FTS), and an in situ gas analyzer suite (ISGAS) with a gas analyzer and flask sampling system (see https://carve.ornl.gov/documentation.html). All instruments were controlled by a master computer system (Data Acquisition and Distribution System, DADS). Data were logged and UTC time stamped at 1 second intervals. DADS also recorded GPS data (Lat, Lon, elevation), aircraft pitch, roll, and yaw, as well as basic meteorological data from onboard instruments.
In situ gas analyzer
This data set includes continuous, in situ measurements from the gas analyzer, a cavity ring-down spectroscopy (CRDS) instrument (Picarro Inc.) used for rapid measurement of trace gas mole fractions (Crosson, 2008). Gas measurements from samples collected with the flask system are distributed as a separate CARVE data set. CRDS is a technique for measuring quantities of gaseous substances based on the rate of light intensity decay following laser illumination of a highly-reflective containment cavity. A CRDS system measures the time constant of decay to 1/e of its initial intensity, its ring-down time, in order to calculate the concentration of the absorbing gas mixture within the cavity. These data were gathered using two such CRDS systems: (1) a three-species CRDS (Picarro model 1301m, SN CFADS09) used in 2012 flights, and (2) a four-species CRDS system (Picarro model G2401, SN CFKBDS2007) used for the flights from 2013 to 2015.
CO2, CH4, and CO were recorded at 2.5-second intervals and H20 at 10-second intervals for the duration of each flight, and interpolated to 2-second temporal resolution for distribution in this data set. Note: Measurements from flights in November 2014 are averaged over 20-second intervals. The CRDS instrument had a measurement delay that reduced its measurement interval to 18 seconds, so this data is reported at a lower frequency. The quality of the measurements was not affected.
The CRDS instruments were calibrated in the laboratory each year before and after each seasonal deployment, with a series of four or five standard reference tanks (World Meteorological Organization; Novelli et al., 1991; Zhao and Tans, 2006; Dlugokencky et al., 2005) at NOAA/ESRL. Drift between laboratory calibrations in March and December of the same year for each of the two gas analyzers was found to be < 3 ppb CO, <= 0.05 ppm CO2, and < 2 ppb CH4 for the ambient range of mole fractions. Similar results have been shown for CO2 in other Picarro CRDS analyzers (Richardson et al., 2012). Flight measurements for all species were initially corrected using this linear calibration prior to analysis of the on-board standards. On-board standards were performed using a set of NOAA-calibrated reference tanks that were routinely sampled during flights (approximately every 30 minutes).
Water vapor correction
A Vaisala HMP-50 relative humidity sensor was included on the remote sensing payload for the CARVE airborne campaigns. Comparison of H2O measurements derived from the CRDS instrument with those from the relative humidity sensor indicated measurements are within 1% of true atmospheric water vapor quantities (Karion et al, 2013).
Each CRDS unit was analyzed in laboratory tests prior to and after deployment to assess the stability of the empirical corrections for water vapor content in deriving dry mole fractions. Tests of correction accuracy were performed by increasing humidity of dry standards gases from tanks. Methodology for performing these water vapor tests is described in detail in referenced literature for CO2 and CH4 (Chen et al., 2010; Winderlich et al., 2010; Rella et al., 2012), and for CO (Chen et al., 2012). No significant drifts in the water vapor correction functions were observed through the laboratory testing. Water vapor corrections did not change by more than 0.1 ppm for CO2 or 1 ppb for CH4 at the highest H2O values used in laboratory tests, approximately 2.5%. Typical flight values for H2O did not exceed 1.5%. The uncertainty of the CO water vapor correction is within 2 ppb up to 4% water vapor (Chen et al., 2012).
Dry mole fractions for CO2, CH4, and CO were derived through an empirical correction to the measured (wet) mole fraction that accounts for dilution effects and optical interference.
By not drying the sampled air prior to measurement within the CRDS, ambient water vapor could be measured in addition to CO2, CH4, and CO. Water vapor gradients are an important constraint on the boundary layer height. Drying post-measurement allows for potential usage in evaluating vertical mixing in transport models (Karion et al., 2013).
CO and CH4 dry mole fractions are reported in parts per billion (ppb) and CO2 dry mole fractions in parts per million (ppm). The H2O mole fraction is reported as a percentage. Records with invalid measurements are assigned a default mole fraction (-999.9).
Data Access
These data are available through the Oak Ridge National Laboratory (ORNL) Distributed Active Archive Center (DAAC).
CARVE: L2 Atmospheric CO2, CO and CH4 Concentrations, NOAA CRDS, Alaska, 2012-2015
Contact for Data Center Access Information:
- E-mail: uso@daac.ornl.gov
- Telephone: +1 (865) 241-3952
References
Chen, H., Winderlich, J., Gerbig, C., Hoefer, A., Rella, C. W., Crosson, E. R., Van Pelt, A. D., Steinbach, J., Kolle, O., Beck, V., Daube, B. C., Gottlieb, E. W., Chow, V. Y., Santoni, G. W., and Wofsy, S. C. (2010). High-accuracy continuous airborne measurements of greenhouse gases (CO2 and CH4) using the cavity ringdown spectroscopy (CRDS) technique, Atmos. Meas. Tech., 3, 375–386, doi:10.5194/amt-3-375-2010
Chen H., A. Karion, C.W. Rella, J. Winderlich, C. Gerbig, A. Filges, T. Newberger, C. Sweeney, and P.P. Tans (2012). Accurate measurements of carbon monoxide in humid air using the cavity ring-down spectroscopy (CRDS) technique, Atmos Meas. Tech. Discuss., 5, 6493-6517, doi:10.5194/atmd-5-6493-2012.
Crosson, E.R. (2008). A cavity ring-down analyzer for measuring atmospheric levels of methane, carbon dioxide, and water vapor, Appl. Phys. B-Lasers O., 92: 403-408. doi: 10.1007/s00340-008-3135y, 2008.
Dlugokencky, E.J., R.C. Myers, P.M. Lang, K.A. Masarie, A.M. Crotwell, K.W. Thoning, B.D. Hall, J.W. Elkins, and L.P. Steele (2005). Conversion of NOAA CMDL atmospheric dry air methane mole fractions to gravimetrically-prepared standard scale, J. Geophys. Res., 110, D18306 doi: 10.1029/2005JD006035.
Karion, A., C. Sweeney, S. Wolter, T. Newberger, H. Chen, A. Andrews, J. Kofler, D. Neff, and P. Tans (2013). Long-term greenhouse gas measurements from aircraft, Atmos. Meas. Tech., 6(3), 511-526. doi:10.5194/amt-6-511-2013
Novelli, P. C., Elkins, J. W., and Steele, L. P. (1991). The development and evaluation of a gravimetric reference scale for measurements of atmospheric carbon monoxide, J. Geophys. Res.-Atmos., 96, 13109–13121, doi:10.1029/91jd01108
Rella, C. W., Chen, H., Andrews, A. E., Filges, A., Gerbig, C., Hatakka, J., Karion, A., Miles, N. L., Richardson, S. J., Steinbacher, M., Sweeney, C., Wastine, B., and Zellweger, C. (2012). High accuracy measurements of dry mole fractions of carbon dioxide and methane in humid air, Atmos. Meas. Tech. Discuss., 5, 5823–5888, doi:10.5194/amtd-5-5823-2012
Richardson, S.J., N.L. Miles, K.J. Davis, E.R. Crosson, C.W. Rella, and A.E. Andrews (2012). Field Testing of Cavity Ring-Down Spectroscopy Analyzers Measuring Carbon dioxide and Water Vapor, J. atmos. Ocean. Tech., 29, 397-406. doi: 10.1175/jtech-d-11-00063.1.
Winderlich, J., Chen, H., Gerbig, C., Seifert, T., Kolle, O., Lavric, J. V., Kaiser, C., Hofer, A., and Heimann, M. (2010). Continuous low maintenance CO2/CH4/H2O measurements at the Zotino Tall Tower Observatory (ZOTTO) in Central Siberia, Atmos. Meas. Tech., 3, 1113–1128, doi:10.5194/amt-3-1113-2010.
Zhao, C., and P.P. Tans (2006). Estimating uncertainty of the WMO Mole Fraction Scale for carbon dioxide in air, J. Geophys. Res. 111, D08S09, doi: 10.1029/2005JD006003.