Documentation Revision Date: 2017-01-11
Data Set Version: V1
Summary
There are 4 data files in *.nc file format included with this data set.
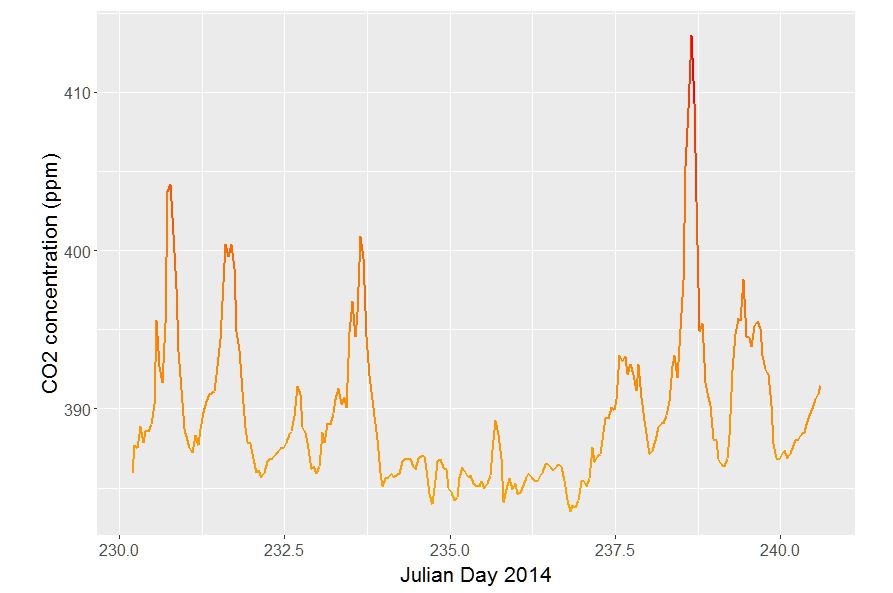
CO2 concentration in parts per million observed at the CARVE tower between August 18-28, 2014.
Citation
Miller, J.B., C. Sweeney, A. Karion, and C.E. Miller. 2017. CARVE: L2 Atmospheric CO2, CO, and CH4 Concentrations, CARVE Tower, Alaska, 2011-2015. ORNL DAAC, Oak Ridge, Tennessee, USA. http://dx.doi.org/10.3334/ORNLDAAC/1419
Table of Contents
- Data Set Overview
- Data Characteristics
- Application and Derivation
- Quality Assessment
- Data Acquisition, Materials, and Methods
- Data Access
- References
Data Set Overview
Project: Carbon in Arctic Reservoirs Vulnerability Experiment (CARVE)
The Carbon in Arctic Reservoirs Vulnerability Experiment (CARVE) is a NASA Earth Ventures (EV-1) investigation designed to quantify correlations between atmospheric and surface state variables for Alaskan terrestrial ecosystems through intensive seasonal aircraft campaigns, ground-based observations, and analysis sustained over a 5-year mission. CARVE collected detailed measurements of greenhouse gases on local to regional scales in the Alaskan Arctic and demonstrated new remote sensing and improved modeling capabilities to quantify Arctic carbon fluxes and carbon cycle-climate processes. CARVE science fills a critical gap in Earth science knowledge and satisfies high priority objectives across NASA’s Carbon Cycle and Ecosystems, Atmospheric Composition, and Climate Variability & Change focus areas as well as the Air Quality and Ecosystems elements of the Applied Sciences program. CARVE data also complements and enhances the science return from current NASA and non-NASA sensors.
Related Data:
A full list of CARVE data products is available at: https://carve.ornl.gov/dataproducts.html
Data Characteristics
Spatial Coverage: CARVE tower near Fox, Alaska
Spatial Resolution: Point measurements
Temporal Coverage: 20111023 - 20141231
Temporal Resolution: Hourly
Study Area (coordinates in decimal degrees)
|
Site |
Westernmost Longitude |
Easternmost Longitude |
Northernmost Latitude |
Southernmost Latitude |
|
CARVE tower |
-147.5982 |
-147.5982 |
64.9863 |
64.9863 |
Data File Information
There are 4 data files in *.nc file format included with this data set, one for each year of observations. Note that data from 2015 are not yet available from the CARVE project team.
The measurement frequency for CO2, CO, CH4, and water vapor was 0.5 Hz. CO2 measurements were made relative to the WMO CO2 X2007 scale (Zhao and Tans, 2006). CO measurements are reported relative to the WMO CO X2004 scale (Novelli et al., 1991). CH4 measurements are reported relative to the WMO CH4 2004 scale (Dlugokencky et al., 2005). Dry air mole fractions for CO2 are given in units of parts per million (ppm) and dry air mole fractions of CH4 and CO are given in units of parts per billion (ppb).
Data values are aggregated at the top of each hour (approximately), and represent data centered at the top of each hour (i.e. an average reported at 13:00 UTC represents data collected some time during the interval from 12:30 to 13:30 UTC).
For 30-second data averaged for Level sampling time: For Levels 1 and 2, this means that the average is only a 5-minute average of 30-second data that occurred some time within that hour. For Level 3, it is a 50-minute average of 30-second data.
Also reported is the standard deviation (stddev) associated with the respective 30-second averaged value, which reflects both analyzer precision and real atmospheric variability during the measurement period.
Table 1. CARVE file naming convention. Example file name: carve_GroundISGA_L2_b23_20111231_20160115004906.nc
|
Name element |
Example value |
Units |
|
Project name |
carve |
|
|
Instrument |
GroundISGA |
|
|
Processing level |
L2 |
|
|
Build ID |
b23 |
|
|
File End Date. Each file contains one year of data. |
20111231 |
yyyymmdd |
|
Processing date and time |
20160115004906 |
yyyymmddhhmmss |
Table 2. Data variables in each netCDF file. Fill value or missing data were set to -999.9 for all variables.
|
Variable name |
Description |
Units |
|
Geolocation measurements |
|
|
|
center_lat |
latitude |
degrees North |
|
center_lat_standard_error |
latitude standard_error |
degrees North |
|
center_lon |
longitude |
degrees east |
|
center_lon_standard_error |
longitude standard error |
degrees east |
|
height |
height of aircraft above ground |
meters |
|
height_standard_error |
height standard error |
meters |
|
geolocation_qc |
geolocation status flag |
0 = Success, 1 = Error |
|
time |
time |
seconds since 1980-1-6 0:0:0 |
|
Science measurements |
|
|
|
co |
Carbon monoxide dry mole fraction measurements at 2-second intervals |
parts per billion (1x10^-9) |
|
co_qc |
QC flag for carbon monoxide measurements |
1 = Valid; 2 = Out of Range; 3 = Error |
|
co_stddev |
Standard deviation of carbon monoxide measurements |
|
|
co2 |
Carbon dioxide dry mole fraction measurements at 2-second intervals |
parts per million (1x10^-6) |
|
co2_qc |
QC flag for carbon dioxide measurements |
1 = Valid; 2 = Out of Range; 3 = Error |
|
co2_stddev |
Standard deviation of carbon dioxide measurements |
|
|
ch4 |
Methane dry mole fraction measurements at 2-second intervals |
parts per billion (1x10^-9) |
|
ch4_qc |
QC flag for methane measurements |
1 = Valid; 2 = Out of Range; 3 = Error |
|
ch4_stddev |
Standard deviation of methane measurements |
|
|
Ancillary measurements |
|
|
|
ambient temperature |
Ambient temperature outside the base of the tower |
degrees Celcius |
|
horizontal velocity |
Horizontal velocity from Vaisala 2D sonic anemometer mounted at the top of the tower |
meters per second |
|
atmospheric pressure |
Atmospheric pressure |
millibars |
|
sonic temperature |
Sonic temperature from Vaisala sonic anemometer |
degrees Celcius |
|
vertical velocity |
Vertical velocity from Vaisala 2D sonic anemometer mounted at the top of the tower |
meters per second |
Application and Derivation
These data files contain high-frequency atmospheric CO2, CO, CH4, and H2O content observations from the CARVE tower between October 2011 and May 2015. The CARVE project was designed to collect detailed measurements of important greenhouse gases on local to regional scales in the Alaskan arctic and demonstrate new remote sensing and improved modeling capabilities to quantify Arctic carbon fluxes and carbon cycle-climate processes. The CARVE data provide insights into Arctic carbon cycling that may be useful in numerous applications.
Quality Assessment
QC flags are provided in this data set. Uncertainties for the trace gas measurements (CO2, CH4, and CO averages) represent reproducibility and comparability to other NOAA network sites, and are determined to be 0.2 ppm, 2 ppb, and 5 ppb, respectively (1-sigma), according to methods described in Karion et al. (2016) and based on comparisons with NOAA flasks. Standard deviation of the hourly means are provided.
Data Acquisition, Materials, and Methods
CARVE research tower
A stationary, tower-based greenhouse gas measurement site, the CARVE tower (NOAA site code CRV), was established in 2011 to give year-round context for the intensive aircraft observations performed throughout the CARVE project. The measurements contained in this data set are from gas analyzers on the CARVE tower in Fox, Alaska (17 km north of Fairbanks; 64.9863 N, 147.5982 W, 611 m.a.s.l.). The tower site was chosen for its high elevation compared to the immediate surrounding mean ground level and its relatively large region of influence to provide temporal and spatial context for CARVE aircraft measurements in interior Alaska.
The surrounding land cover is composed of deciduous and evergreen forest, shrub or scrub, some scattered areas of woody wetlands, mainly south of the Chena River south of Fairbanks, and medium and low intensity developed land in and immediately around Fairbanks (Homer et al., 2015). The tower is located on a ridge, and measurements from the tower represent a wide region of interior Alaska, as indicated by surface influence fields generated from the WRF-STILT modeling framework (Henderson et al., 2015), which show that the tower’s influence region encompasses a substantial part of Alaska (Fig. 1a).
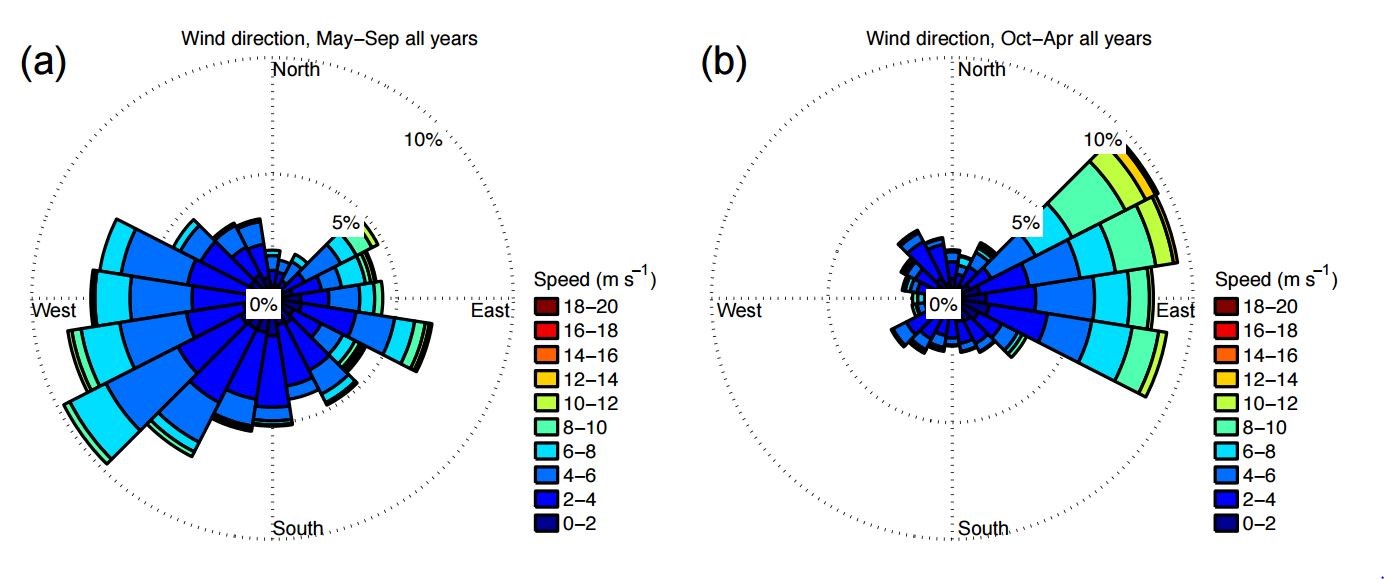
Figure 2. Wind roses averaged over (a) May-September and (b) October-April for all 3 years during mid-afternoon hours at 32 m above ground level on the CARVE tower (from Karion et al., 2016).
In situ gas analyzer
This data set includes continuous, in situ measurements from the gas analyzer, a cavity ring-down spectroscopy (CRDS) instrument (Picarro Inc.) used for rapid measurement of trace gas mole fractions (Crosson, 2008). CRDS is a technique for measuring quantities of gaseous substances based on the rate of light intensity decay following laser illumination of a highly-reflective containment cavity. A CRDS system measures the time constant of decay to 1/e of its initial intensity, its ring-down time, in order to calculate the concentration of the absorbing gas mixture within the cavity.
These data were collected using two four-species CRDS systems (Picarro model 2401m, SN CFKBDS2008; and Picarro model G2401, SN CFKBDS2007).
Air was sampled from three different levels on the tower:
Level 1 = 616.3056 masl, 4.9 magl (5 minutes per hour)
Level 2 = 628.4976 masl, 17.1 magl (5 minutes per hour)
Level 3 = 643.1280 masl, 31.7 magl (50 minutes per hour)
In the hourly averages, the 30-second data has been averaged from the top of one hour to the top of the next and reported at the average time (i.e. approximately on the half hour). For levels 1 & 2, this means that the average is only a 5-minute average that occurred sometime within that hour. For Level 3, it is a 50-minute average.
Water vapor correction
Sample air was not dried prior to measurement; the dry mole fraction for CO2, CO, and CH4 is derived from an empirical correction to the measured (wet) mole fraction that is a function of ambient water vapor that was measured by the CRDS analyzer, and accounts both for dilution effects and optical interference in the measurement cell. Using this correction below 3% H2O, the true dry mole fraction is recovered within 1 ppb of CH4, 0.1 ppm of CO2, and 2 ppb of CO. More information on the water correction is available in Karion et al., 2013. The H2O mole fraction is reported as a percentage. Records with invalid measurements are assigned a default mole fraction (-999.9).
Data Access
These data are available through the Oak Ridge National Laboratory (ORNL) Distributed Active Archive Center (DAAC).
CARVE: L2 Atmospheric CO2, CO, and CH4 Concentrations, CARVE Tower, Alaska, 2011-2015
Contact for Data Center Access Information:
- E-mail: uso@daac.ornl.gov
- Telephone: +1 (865) 241-3952
References
Dlugokencky, E.J., R.C. Myers, P.M. Lang, K.A. Masarie, A.M. Crotwell, K.W. Thoning, B.D. Hall, J.W. Elkins, and L.P. Steele (2005). Conversion of NOAA CMDL atmospheric dry air methane mole fractions to gravimetrically-prepared standard scale, J. Geophys. Res., 110, D18306 doi: 10.1029/2005JD006035.
Karion, A., C. Sweeney, S. Wolter, T. Newberger, H. Chen, A. Andrews, J. Kofler, D. Neff, and P. Tans. "Long-term greenhouse gas measurements from aircraft." Atmospheric Measurement Techniques 6, no. 3 (2013): 511-526.
Karion, A., Sweeney, C., Miller, J. B., Andrews, A. E., Commane, R., Dinardo, S., Henderson, J. M., Lindaas, J., Lin, J. C., Luus, K. A., Newberger, T., Tans, P., Wofsy, S. C., Wolter, S., and Miller, C. E. "Investigating Alaskan methane and carbon dioxide fluxes using measurements from the CARVE tower." Atmospheric Chemistry and Physics 16, 5383-5398, doi:10.5194/acp-16-5383-2016, 2016.
Novelli, P. C., Elkins, J. W., and Steele, L. P. (1991). The development and evaluation of a gravimetric reference scale for measurements of atmospheric carbon monoxide, J. Geophys. Res.-Atmos., 96, 13109–13121, doi:10.1029/91jd01108
Zhao, C., and P.P. Tans (2006). Estimating uncertainty of the WMO Mole Fraction Scale for carbon dioxide in air, J. Geophys. Res. 111, D08S09, doi: 10.1029/2005JD006003.