Documentation Revision Date: 2016-10-10
Data Set Version: V1
Summary
There are 27 files in comma-separated (*.csv) format included with this data set.
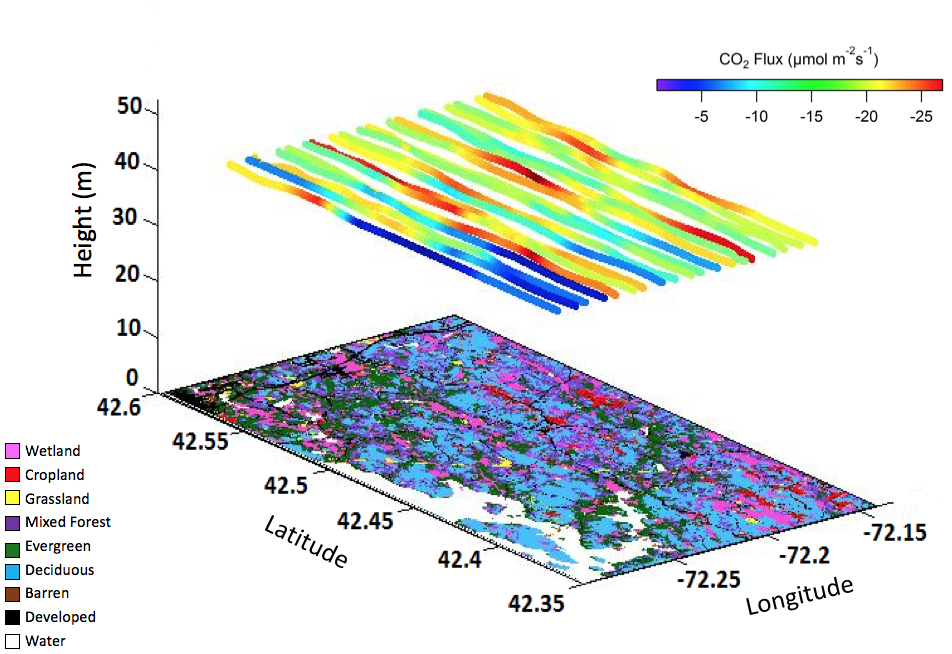
Figure 1: Fluxes of carbon dioxide observed during airborne sampling over the Harvard Forest site on June 1, 2014.
Citation
Caulton, D.R., O.E. Salmon, P.B. Shepson, and K.D. Hajny. 2016. AirMOSS: L2 Airborne Carbon Flux at Selected AirMOSS Sites, 2012-2014. ORNL DAAC, Oak Ridge, Tennessee, USA. http://dx.doi.org/10.3334/ORNLDAAC/1420
Table of Contents
- Data Set Overview
- Data Characteristics
- Application and Derivation
- Quality Assessment
- Data Acquisition, Materials, and Methods
- Data Access
- References
Data Set Overview
Project: Airborne Microwave Observatory of Subcanopy and Subsurface (AirMOSS)
The goal of NASA’s Airborne Microwave Observatory of Subcanopy and Subsurface (AirMOSS) investigation is to provide high-resolution observations of root-zone soil moisture over regions representative of the major North American climatic habitats (biomes), quantify the impact of variations in soil moisture on the estimation of regional carbon fluxes, and extrapolate the reduced-uncertainty estimates of regional carbon fluxes to the continental scale of North America.
- The AirMOSS campaign used an airborne ultra-high frequency synthetic aperture radar flown on a Gulfstream-III aircraft to derive estimates of soil moisture down to approximately 1.2 meters.
- Extensive ground, tower, and aircraft in-situ measurements were collected to validate root-zone soil measurements and carbon flux model estimates.
The AirMOSS soil measurements can be used to better understand carbon fluxes and their associated uncertainties on a continental scale. Additionally, AirMOSS data provide a direct means for validating root-zone soil measurement algorithms from the Soil Moisture Active & Passive (SMAP) mission and assessing the impact of fine-scale heterogeneities in its coarse-resolution products.
Related Data:
A full list of AirMOSS data products is available at: https://airmoss.ornl.gov/dataproducts.html.
Data Characteristics
Spatial Coverage: 3 AirMOSS sites in North America
Spatial Resolution: Each value represents the average of all measurements obtained throughout one AirMOSS flight.
Temporal Coverage: 20120707 - 20140601
Temporal Resolution: Each value represents the average of all measurements obtained throughout one AirMOSS flight.
Study Area (coordinates in decimal degrees)
|
Site |
Westernmost Longitude |
Easternmost Longitude |
Northernmost Latitude |
Southernmost Latitude |
|
North America |
-79.504 |
-68.430 |
45.643 |
35.770 |
Data File Information
This data set includes 26 comma-separated values (*.csv) files. Scientific data is in AirMOSS_aircraft_Cflux_v2.csv. The remaining files provide coordinates for the flight paths.
File naming convention
Files containing flight path coordinates are named as follows:
Flight_YYYYMMDD_S#_L2_flight_path.csv
where:
YYYYMMDD = flight date
S# = distinguishes between site 1 and site 2 when multiple flights were conducted on the same day
L2 = processing level 2
Example file names: Flight_20120707_S2_L2_flight_path.csv
Flight_20130819_L2_flight_path.csv
Table 1. AirMOSS sites where airborne carbon flux was measured.
|
Site name |
North latitude |
South latitude |
East longitude |
West longitude |
Fluxnet Site ID |
Description |
|
DukeFr |
36.368 |
35.437 |
-78.694 |
-79.849 |
US-Dk1,US-Dk2, US-Dk3 |
Duke Forest site, North Carolina, USA. Landcover: Mature oak-hickory dominated hardwood forest. Elevation: 169m. |
|
Harvrd |
43.376 |
42.293 |
-71.839 |
-72.389 |
US-Ha1 & US-Ha2 |
Harvard Forest site, Massachusetts, USA. Landcover: Temperate deciduous forest. Elevation: 353m. |
|
Howlnd |
45.778 |
44.669 |
-68.336 |
-69.086 |
US-Ho1, US-Ho2, US-Ho3 |
Howland Forest site, Maine, USA. Landcover: boreal - northern hardwood transitional forest. Elevation 72m. |
Table 2. Data fields in the data file. (AirMOSS_aircraft_Cflux_v2.csv)
|
Data Field |
Units |
Description |
|
flight_date |
yyyy-mm-dd UTC |
Date of the carbon flux sampling flight |
|
site |
|
Name of the AirMOSS site |
|
flight_mid_time_utc |
hh:mm UTC |
Time in seconds after midnight (UTC) corresponding to the middle of the flight |
|
wind_direction |
degrees |
Average observed wind direction during the flight |
|
wind_speed |
m/s |
Average observed wind speed during flight |
|
H_flux |
W m-2 |
Sensible heat (H) flux |
|
H_std_dev |
W m-2 |
SD of sensible heat (H) flux |
|
LE_flux |
W m-2 |
Latent heat (LE) flux |
|
LE_std_dev |
W m-2 |
SD of latent heat (LE) flux |
|
CO2_flux |
umol m-2 s-1 |
Carbon dioxide (CO2) flux |
|
CO2_std_dev |
umol m-2 s-1 |
SD of carbon dioxide (CO2) flux |
Application and Derivation
The AirMOSS data products and expected science results are tailored to meet the need to reduce uncertainty in estimates of net ecosystem exchange (NEE) through the development of methodologies to integrate remote sensing observations, in-ground soil sensors, and flux tower data into regional/continental flux models. Additionally, AirMOSS data provide a direct means for evaluating RZSM algorithms of the SMAP Decadal Survey mission and assessing the impact of fine-scale heterogeneities in its coarse-resolution products.
Quality Assessment
These data are provided with no QA information other than the standard deviation of observations during each flight.
Data Acquisition, Materials, and Methods
The goal of the Airborne Microwave Observatory of Subcanopy and Subsurface (AirMOSS) investigation is to provide high-resolution observations of root-zone soil moisture over regions representative of the major North American climatic habitats (biomes), quantify the impact of variations in soil moisture on the estimation of regional carbon fluxes, and extrapolate the reduced-uncertainty estimates of regional carbon fluxes to the continental scale of North America.
AirMOSS Flights
For AirMOSS, NASA's Uninhabited Aerial Vehicle Synthetic Aperture Radar (UAVSAR) was flown on a Gulfstream-III aircraft, making frequent flights over ten sites (Figure 2) in 9 different biomes of North America over the course of four years (Chapin et al. 2012).
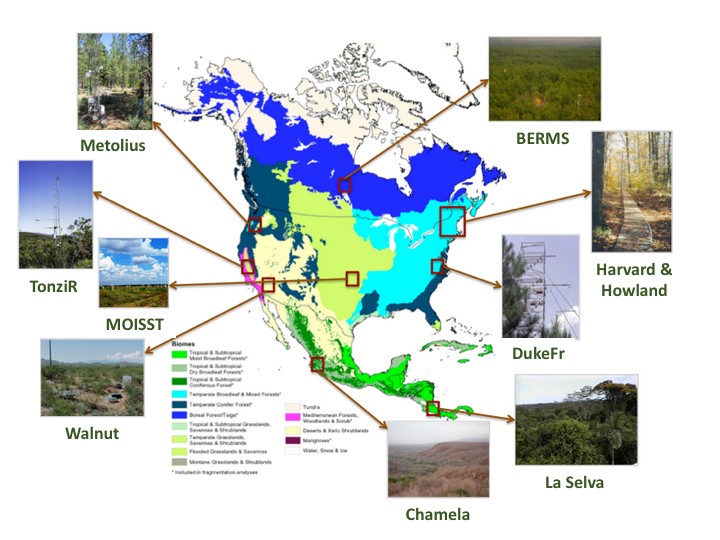
Figure 2. AirMOSS study sites were co-located with flux towers in nine different biomes across North America.
Beginning in September 2012, the AirMOSS instrument flew 215 flight campaigns. A summary of flight campaigns by year and site is found in Table 3. Typically, the aircraft made repeat visits to sites in the same region in a single week and then proceeded to another region. Most sites had at least three campaigns per year. The Harvard and Howland forest sites were flown together in a single day. In 2012, Chamela, La Selva, and Tonzi were not surveyed.
Table 3. Summary of AirMOSS flight campaigns.
|
Site |
||||||||||
|
Year |
BermsP |
Chamel |
DukeFr |
Harvrd |
Howlnd |
LaSelv |
Metoli |
Oklaho |
TonziR |
Walnut |
|
2012 |
3 |
0 |
3 |
3 |
3 |
0 |
4 |
3 |
0 |
3 |
|
2013 |
6 |
3 |
9 |
9 |
9 |
6 |
7 |
8 |
5 |
6 |
|
2014 |
7 |
3 |
10 |
9 |
9 |
3 |
9 |
9 |
6 |
5 |
|
2015 |
9 |
2 |
5 |
5 |
5 |
3 |
9 |
6 |
5 |
6 |
|
Total |
25 |
8 |
27 |
26 |
26 |
12 |
29 |
26 |
16 |
20 |
A complete list of AirMOSS flights can be found at: https://airmoss.ornl.gov/flights.html.
AirMOSS Level 2 Carbon Flux Data Product
Measurements were made with a Picarro Wavelength-Scanned Cavity Ring Down Spectrometer, a greenhouse gas analyzer that measures spatial variations in atmospheric CO2, CH4, and H2O over the duration of flight. Rapid (12 Hz) measurements of CO2 and H2O were used to estimate CO2 and latent heat flux, respectively.
Spatially averaged fluxes of latent heat (FLE), sensible heat (FH), and CO2 were calculated according to Equations 1-3, respectively, to account for fluctuations in the aircraft’s airspeed (Caulton 2014):
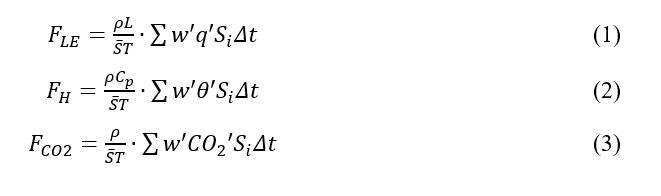
Where ρ is the average dry-air density along the transect, L is the latent heat of vaporization of water, Cp is the specific heat of dry air at constant pressure, S¯ is the average groundspeed of the aircraft over the length of the transect (20 km), and T is the time to complete a transect. The variation in scalar concentration about the transect mean is given by q', the perturbations in specific humidity for Equation 1, and θ', the perturbations in potential temperature for Equation 2. CO2 are perturbations in CO2 concentration. The aircraft’s instantaneous groundspeed is denoted by Si, and the discrete sampling interval by Δt. Fluxes are calculated using 20 km-long averaging lengths to ensure adequate sampling of the spectrum of eddy sizes for the cruising speed of ~55 m s-1. Units have been converted to report latent and sensible heat fluxes in W m-2 and CO2 flux in μmol m-2 s-1. Negative flux values indicate the surface is a sink.
Data Access
These data are available through the Oak Ridge National Laboratory (ORNL) Distributed Active Archive Center (DAAC).
AirMOSS: L2 Airborne Carbon Flux at Selected AirMOSS Sites, 2012-2014
Contact for Data Center Access Information:
- E-mail: uso@daac.ornl.gov
- Telephone: +1 (865) 241-3952
References
Chapin, E., A. Chau, J. Chen, B. Heavey, S. Hensley, Y. Lou, R. Machuzak, and M. Moghaddam. 2012. AirMOSS: An Airborne P-band SAR to measure root-zone soil moisture, 2012 IEEE Radar Conference, Atlanta, GA, 2012, pp. 0693-0698. http://dx.doi.org/10.1109/RADAR.2012.6212227
Caulton, Dana R. 2014. "Aircraft-Based Measurements for the Identification and Quantification of Sources and Sinks in the Carbon Cycle." Order No. 3686870, Purdue University. Dissertation