Get Data
Revision date: September 11, 2012
Summary:
This data set provides the results of (1) the physical and chemical characterization of streams and (2) comparable chemical analyses of extracted soil water in the Aldeia River basin at Fazenda Nova Vida, a large cattle ranch 50 km from the city of Ariquemes, in central Rondonia, Brazil, from 1994-2001. Data are provided on the stream beds including cross-sectional depth and stream bed surface type. Stream discharge is reported. Streamwater was sampled and analyzed periodically over the eight-year duration of the study at numerous steam locations. Soil solution samples were collected at the same frequency with lysimeters placed at 30 cm and 100 cm depths on the floodplain and at upland forest and pasture sites in the Aldeia River watershed. There are five comma-delimited data files in this data set.
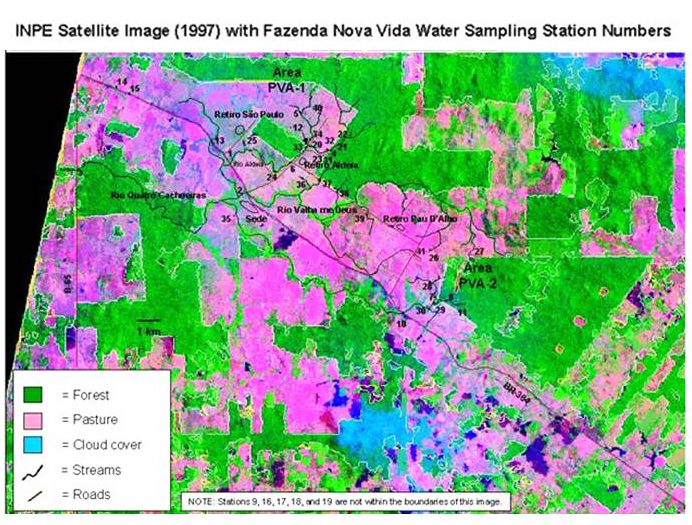
Figure 1. Fazenda Nova Vida study areas PVA-1 and PVA-2 and water sampling stations displayed on an INPE satellite image (1997).
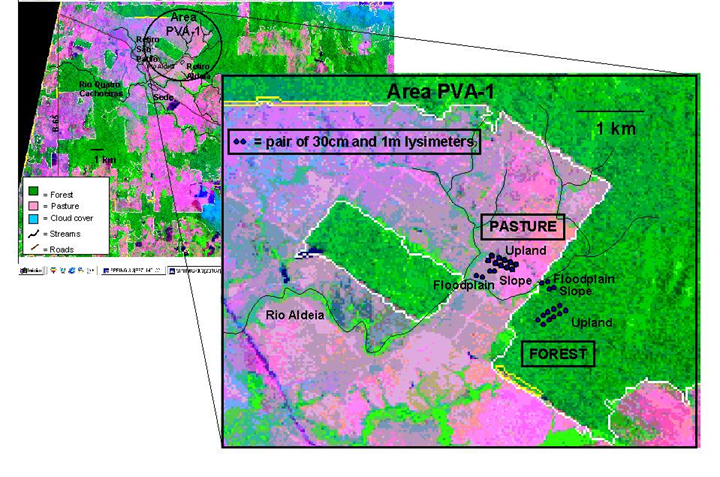
Figure 2. Fazenda Nova Vida study area PVA-1 and lysimeter sampling stations displayed on an INPE satellite image (1997).
Data Citation:
Cite this data set as follows:
Deegan, L.A., C. Neill, S.M. Thomas, A.V. Krusche, M.V.R. Ballester, R.L. Victoria. 2012. LBA-ECO ND-03 Stream and Soil Water Data, Fazenda Nova Vida, Rondonia: 1994-2001. Data set. Available on-line [http://daac.ornl.gov] from Oak Ridge National Laboratory Distributed Active Archive Center, Oak Ridge, Tennessee, U.S.A. http://dx.doi.org/10.3334/ORNLDAAC/1113
Implementation of the LBA Data and Publication Policy by Data Users:
The LBA Data and Publication Policy [http://daac.ornl.gov/LBA/lba_data_policy.html] is in effect for a period of five (5) years from the date of archiving and should be followed by data users who have obtained LBA data sets from the ORNL DAAC. Users who download LBA data in the five years after data have been archived must contact the investigators who collected the data, per provisions 6 and 7 in the Policy.
This data set was archived in September of 2012. Users who download the data between September 2012 and August 2017 must comply with the LBA Data and Publication Policy.
Data users should use the Investigator contact information in this document to communicate with the data provider. Alternatively, the LBA website [http://lba.inpa.gov.br/lba/] in Brazil will have current contact information.
Data users should use the Data Set Citation and other applicable references provided in this document to acknowledge use of the data.
Table of Contents:
- 1 Data Set Overview
- 2 Data Characteristics
- 3 Applications and Derivation
- 4 Quality Assessment
- 5 Acquisition Materials and Methods
- 6 Data Access
- 7 References
1. Data Set Overview:
Project: LBA (Large-Scale Biosphere-Atmosphere Experiment in the Amazon)
Activity: LBA-ECO
LBA Science Component: Nutrient Dynamics
Team ID: ND-03 (Deegan / Victoria)
The investigators were Deegan, Linda A.; Krusche, Alex V.; Neill, Christopher; Thomas, Suzanne M.; Victoria, Reynaldo Luiz and Haupert, Christie Lynn. You may contact Deegan, Linda A. (ldeegan@mbl.edu) and Haupert, Christie Lynn (chaupert@mbl.edu).
LBA Data Set Inventory ID: ND03_Streams_Soilwater
This data set provides the results of (1) the physical and chemical characterization of streams and (2) comparable chemical analyses of extracted soil water in the Aldeia River basin at Fazenda Nova Vida, a large cattle ranch 50 km from the city of Ariquemes, in central Rondonia, Brazil, from 1994-2001. Data are provided on the stream beds including cross-sectional depth and stream bed surface type. Stream discharge is reported. Streamwater was sampled and analyzed periodically over the eight year duration of the study at numerous steam locations. Soil solution samples were collected at the same frequency with lysimeters placed at 30 cm and 100 cm depths on the floodplain and at upland forest and pasture sites in the Aldeia River watershed.
2. Data Characteristics:
Data are presented in five comma-delimited ASCII files:
File #1: ND03_Nova_Vida_Cross_Sectional_Stream_Depth.csv
Stream physical characteristics were measured in a one-time synoptic survey during the dry seasons, June-August, of 1998 and 1999.
| Column | Heading | Units/format | Description |
|---|---|---|---|
| 1 | Stream_ID | Stream identification code. See Figure 1 stream locations | |
| 2 | Width_total | m | Total wetted width at cross-sectional transect location in meters (m) |
| 3 | Distance_M | m | Distance in meters (m) from designated 0 point, see below. Negative values represent upstream from 0 point and positive values downstream |
| 4 | Depth_0cm | cm | Depth to stream bottom at start of transect reported in centimeters (cm) |
| 5 | Depth_10cm | cm | Depth to stream bottom at 10 cm from transect start reported in centimeters (cm) |
| 6-87 | Depth_20cm-Depth_830cm | cm | Columns 6-87 report depth to stream bottom at 10 centimeter increments along the cross-sectional transect to a maximum stream width of 830 cm |
| Missing data values are represented by -9999 | |||
| * GPS locations for the 0-points (see
description for column #3): PVA1-Forest_4, 10° 9'11.89 S, 62°47'29.05W PVA1-Pasture_12, 10° 8'58.95S,62°48'9.48W PVA1-Pasture_25, 10° 9'16.39"S, 62°49'39.19"W | |||
Example data records:
|
Stream_ID,Width_total,Distance_M,Depth_0cm,Depth_10cm,Depth_20cm,Depth_30cm,Depth_40cm,Depth_50cm, Depth_60cm,Depth_70cm,Depth_80cm,Depth_90cm,Depth_100cm,Depth_110cm,Depth_120cm,Depth_130cm, Depth_140cm,Depth_150cm,Depth_160cm,Depth_170cm,Depth_180cm,Depth_190cm,Depth_200cm,Depth_210cm,Depth_220cm, Depth_230cm,Depth_240cm,Depth_250cm,Depth_260cm,Depth_270cm,Depth_280cm,Depth_290cm,Depth_300cm,Depth_310cm, Depth_320cm,Depth_330cm,Depth_340cm,Depth_350cm,Depth_360cm,Depth_370cm,Depth_380cm,Depth_390cm,Depth_400cm, Depth_410cm,Depth_420cm,Depth_430cm,Depth_440cm,Depth_450cm,Depth_460cm,Depth_470cm,Depth_480cm,Depth_490cm, Depth_500cm,Depth_510cm,Depth_520cm,Depth_530cm,Depth_540cm,Depth_550cm,Depth_560cm,Depth_570cm,Depth_580cm, Depth_590cm,Depth_600cm,Depth_610cm,Depth_620cm,Depth_630cm,Depth_640cm,Depth_650cm,Depth_660cm,Depth_670cm, Depth_680cm,Depth_690cm,Depth_700cm,Depth_710cm,Depth_720cm,Depth_730cm,Depth_740cm,Depth_750cm,Depth_760cm, Depth_770cm,Depth_780cm,Depth_790cm,Depth_800cm,Depth_810cm,Depth_820cm,Depth_830cm PVA1-Forest_4,5.2,-270,0,10,13,23,27,26, 20,19,16,12,7,7,7,5,2, 2,2,2,2,3,2,3,3,2, 3,4,5,4,3,6,5,7,7, 7,8,8,10,9,10,12,11,13, 14,18,18,18,17,17,14,9,7, 2,0,-9999,-9999,-9999,-9999,-9999,-9999,-9999, -9999,-9999,-9999,-9999,-9999,-9999,-9999,-9999,-9999, -9999,-9999,-9999,-9999,-9999,-9999 PVA1-Forest_4,3.6,-265,0,3,9,7,6,7, 9,10,10,10,10,10,12,11,12, 13,14,17,19,19,20,23,23,25, 26,24,25,23,20,19,19,16, -9999,-9999,-9999,-9999,-9999,-9999,-9999,-9999,-9999, -9999,-9999,-9999,-9999,-9999,-9999,-9999,-9999,-9999, -9999,-9999,-9999,-9999,-9999,-9999,-9999,-9999,-9999 ,-9999,-9999,-9999,-9999,-9999,-9999,-9999,-9999,-9999, -9999,-9999,-9999,-9999,-9999,-9999,-9999 ... PVA1-Forest_4,2.9,790,0,2,5,4,6,6, 6,7,9,10,12,16,15,17,19, 19,23,29,25,26,24,25,23,22, 19,8,9,2,2,0,-9999,-9999,-9999, -9999,-9999,-9999,-9999,-9999, -9999,-9999,-9999,-9999, -9999,-9999,-9999,-9999,-9999,-9999,-9999,-9999,-9999, -9999,-9999,-9999,-9999,-9999,-9999,-9999,-9999,-9999 -9999,-9999, -9999,-9999,-9999,-9999,-9999,-9999,-9999, -9999,-9999,-9999,-9999,-9999,-9999,-9999,-9999,-9999, -9999,-9999,-9999,-9999,-9999,-9999 PVA1-Forest_4,3.4,795,0,2,7,12,17,17, 19,19,19,17,14,10,12,12,14, 12,9,12,12,14,9,8,8,5, 2,0,-9999,-9999,-9999,-9999, -9999,-9999,-9999, -9999,-9999,-9999,-9999,-9999,-9999,-9999,-9999,-9999, -9999,-9999,-9999,-9999 ,-9999,-9999,-9999,-9999,-9999, -9999,-9999,-9999,-9999,-9999,-9999,-9999,-9999,-9999, -9999,-9999,-9999,-9999,-9999,-9999 ... PVA1-Pasture_25,4.8,760,0,-9999,25,-9999,21,-9999, 21,-9999,23,-9999,24,-9999,25,-9999,27, -9999,27,-9999,27,27,28,27,28,-9999,26, -9999,27,-9999,28,-9999,27,-9999,27,-9999, 27,-9999,27,-9999,24,-9999,15, -9999,7, -9999,0,-9999,-9999,-9999,-9999,-9999,-9999, -9999,-9999,-9999,-9999,-9999,-9999,-9999,-9999,-9999, -9999,-9999,-9999,-9999,-9999, -9999,-9999,-9999,-9999, -9999,-9999,-9999,-9999,9999,-9999,-9999,-9999,-9999,-9999,-9999 PVA1-Pasture_25,4.8,770,0,-9999,33,-9999,32,-9999, 28,-9999,26,-9999,25,-9999,27,-9999,27, -9999,27,-9999,26,,24,,28,,26,,26,-9999, 25,-9999,24,-9999,25,-9999,27,-9999,29, -9999,33,-9999,35,-9999,36,-9999,29,-9999, 17,-9999,0,-9999,-9999,-9999,-9999,-9999,-9999, -9999, -9999,-9999,-9999,-9999,-9999,-9999,-9999, -9999,-9999,-9999,-9999,-9999,-9999,-9999, -9999, -9999,-9999,-9999,-9999,-9999,-9999,9999,-9999,-9999,-9999,-9999,-9999,-9999 |
File #2: ND03_Nova_Vida_Stream_Bed.csv
Stream physical characteristics were measured in a one-time synoptic survey during the dry seasons, June-August, of 1998 and 1999.
| Column | Heading | Units/format | Description |
|---|---|---|---|
| 1 | Stream_ID | Stream identification code. See Figure 1 stream locations, ID 1-41 | |
| 2 | Distance_M | m | Distance in meters (m) from designated 0 point, see below. Negative values represent upstream from 0 point and positive values downstream |
| 3 | Number_C | Number of points on the transect at that distance that were classified as exposed clay | |
| 4 | Number_F | Number of points on the transect at that distance that were classified as fine organic material over sand | |
| 5 | Number_S | Number of points on the transect at that distance that were classified as exposed sand | |
| 6 | Number_L | Number of points on the transect at that distance that were classified as accumulated leaf pack | |
| 7 | Number_W | Number of points on the transect at that distance that were classified as woody debris (stems, trunks of trees) | |
| 8 | Number_R | Number of points on the transect at that distance that were classified as Riparian grass | |
| 9 | Number_G | Number of points on the transect at that distance that were classified as exposed gravel | |
| 10 | Total_obs_transect | Total number of points in the transect | |
| 11 | Fraction_C | fraction | Fraction of total points on the transect at that distance that were classified as exposed clay |
| 12 | Fraction_F | fraction | Fraction of total points on the transect at that distance that were classified as fine 0rganic material over sand |
| 13 | Fraction_S | fraction | Fraction of total points on the transect at that distance that were classified as exposed sand |
| 14 | Fraction_L | fraction | Fraction of total points on the transect at that distance that were classified as accumulated leaf pack |
| 15 | Fraction_W | fraction | Fraction of total points on the transect at that distance that were classified as woody debris (stems, trunks of trees) |
| 16 | Fraction_R | fraction | Fraction of total points on the transect at that distance that were classified as riparian grass |
| 17 | Fraction_G | fraction | Fraction of total points on the transect at that distance that were classified as exposed gravel |
| * GPS locations for the 0-points (see
description for column #2): PVA1-Forest_4, 10° 9'11.89 S, 62°47'29.05W PVA1-Pasture_12, 10° 8'58.95S,62°48'9.48W PVA1-Pasture_25, 10° 9'16.39"S, 62°49'39.19"W | |||
Example data records:
|
Stream_ID,Distance_M,Number_C,Number_F,Number_S,Number_L,Number_W,Number_R,Number_G,Total_obs_transect, Fraction_C,Fraction_F,Fraction_S,Fraction_L,Fraction_W,Fraction_R,Fraction_G PVA1-Pasture_12,505,3,6,5,10,3,0,0,27,0.11,0.22,0.19,0.37,0.11,0,0 PVA1-Pasture_12,500,0,8,16,2,0,0,0,26,0,0.31,0.62,0.08,0,0,0 PVA1-Pasture_12,495,1,20,0,2,3,0,1,27,0.04,0.74,0,0.07,0.11,0,0.04 PVA1-Pasture_12,490,0,6,3,5,4,1,0,19,0,0.32,0.16,0.26,0.21,0.05,0 PVA1-Pasture_12,485,0,0,4,0,0,5,0,9,0,0,0.44,0,0,0.56,0 |
File #3: ND03_Nova_Vida_Daily_Streamwater_Temp.csv
| Column | Heading | Units/format | Description |
|---|---|---|---|
| 1 | Year | yyyy | Year in which sample was collected |
| 2 | Month | mm | Month in which sample was collected (1,2, 3,…12, where 1 = January, 2 = February, etc.) |
| 3 | Date | yyyymmdd | Sampling date |
| 4 | T_PVA1_Forest_4 | degrees C | Average daily stream temperature for stream PVA1-Forest_4 |
| 5 | T_PVA1_Pasture_12 | degrees C | Average daily stream temperature for stream PVA1-Pasture_12 |
| 6 | T_PVA2_Forest_8 | degrees C | Average daily stream temperature for stream PVA2-Forest_8 |
| 7 | T_PVA2_Pasture_7 | degrees C | Average daily stream temperature for stream PVA2-Pasture_7 |
| Missing data are represented as -9999 | |||
Example data records:
|
Year,Month,Date,T_PVA1_Forest_4,T_PVA1_Pasture_12,T_PVA2_Forest_8,T_PVA2_Pasture_7 1998,3,19980311,26.36,27.56,25.21,27.13 1998,3,19980312,26.23,27.23,25.18,26.79 ... 1999,1,19990101,24.96,26.07,24.95,25.64 1999,1,19990102,25.32,26.94,25.36,25.94 ... 2000,1,20000101,25.63,25.86,25.65,25.76 2000,1,20000102,25.33,25.83,25.1,25.72 ... 2001,7,20010727,25.98,25.05,-9999,-9999 2001,7,20010728,24.45,23.63,-9999,-9999 |
File #4: ND03_Nova_Vida_Streamwater_Data.csv
| Column | Heading | Units/format | Description |
|---|---|---|---|
| 1 | Trip_ID | Trip identification code with values A,B,C...N. | |
| 2 | Date | yyyymmdd | Date sample was collected in the field (yyyymmdd) |
| 3 | Year | yyyy | Year sample was collected (1994-2001) |
| 4 | Month | mm | Month when samples were collected in the field with 1 = January, 2 = February, etc. |
| 5 | Day | dd | Day of the month sample collected |
| 6 | Season | Season of the year when sample was taken: Wet or Dry. Rainy season is typically from November to April. | |
| 7 | Landuse | Predominant land use in drainage area surrounding the sample location: Forest, Pasture, or Mixed | |
| 8 | Station_ID | Sampling station identification number. See associated documentation for a map of the sampling area (stations 1-41). | |
| 9 | Stage | cm | Relative stream height in centimeters (cm) as measured by a fixed staff gage (only at stations 4, 7, 8, and 12) |
| 10 | Discharge | L/s | Stream flow reported in liters per second (L/s) measured using cross-sectional area and flow rate information |
| 11 | T_stream | degrees C | Stream temperature at the time of sample collection in degrees Celsius |
| 12 | pH | pH of stream sample as measured streamside or in the laboratory | |
| 13 | Alkalinity | mg/L CaCO3 | Streamwater alkalinity as measured by 2-point titration, as milligrams per liter of calcium carbonate (mg/L CaCO3) |
| 14 | NH4 | umol/L | Streamwater ammonium concentration in micromoles per liter (umol/L) |
| 15 | NO3 | umol/L | Streamwater nitrate concentration in micromoles per liter (umol/L) |
| 16 | PO4 | umol/L | Streamwater phosphate (soluble reactive phosphate) in micromoles per liter (umol/L) |
| 17 | TDN | umol/L | Streamwater total dissolved nitrogen in micromoles per liter (umol/L) |
| 18 | TDP | umol/L | Streamwater total dissolved phosphorus concentration in micromoles per liter (umol/L) |
| 19 | Na | umol/L | Streamwater magnesium concentration in micromoles per liter (umol/L) |
| 20 | K | umol/L | Streamwater sodium concentration in micromoles per liter (umol/L) |
| 21 | Mg | umol/L | Streamwater potassium concentration in micromoles per liter (umol/L) |
| 22 | Ca | umol/L | Streamwater calcium concentration in micromoles per liter of streamwater (umol/L) |
| 23 | Fe | mg/L | Streamwater iron concentration in milligrams per liter (mg/L) |
| 24 | Chl_a | ug/L | Concentration of chlorophyll-a in micrograms per liter of streamwater (ug/L) |
| 25 | TSS | mg/L | Concentration of total suspended solids in milligrams per liter of streamwater (mg/L) |
| 26 | POC | mg/L | Concentration of particulate organic carbon in milligrams per liter of streamwater (mg/L) |
| 27 | PON | mg/L | Concentration of particulate organic nitrogen in milligrams per liter streamwater |
| 28 | C_to_N_particulate | The molar ratio of POC to PON | |
| 29 | Comments | Field notes | |
| Missing data values are represented by -9999 | |||
Example data records:
|
Trip_ID,Sample_date,Year,Month,Day,Season,Landuse,Station_ID,Stage,Discharge,T_stream,pH,Alkalinity, NH4,NO3,PO4,TDN,TDP,Na,K,Mg,Ca,Fe,Chl_a,TSS,POC,PON,C_to_N_particulate,Comments A,4/24/1994,1994,4,24,Wet,Forest,11,-9999,-9999,25,-9999, -9999,-9999,4.46,0.2,-9999,-9999,118.75,40.41,84.74,75.6,-9999,0.181,4.64,0.92,0.07,15.37,-9999 A,4/24/1994,1994,4,24,Wet,Pasture,30,-9999,-9999,27, -9999,-9999,-9999,4.53,0.28,-9999,-9999,91.78,54.99,74.87,91.32,-9999,0.415,14.78,1.45,0.12,13.89,-9999 |
File #5: ND03_Nova_Vida_Lysimeter_Data.csv
| Column | Heading | Units/format | Description |
|---|---|---|---|
| 1 | Location | Location where samples were collected. See Figure 2 | |
| 2 | Date | yyyymmdd | Date sample was collected in the field (yyyymmdd) |
| 3 | Season | Season of the year when sample was taken: Wet or Dry. Rainy season is typically from November to April | |
| 4 | Landuse | Predominant land use in drainage area surrounding the sample location: Forest, Pasture, or Mixed | |
| 5 | Slope | Topographic description of sample location: Forest, Upland, Floodplain, Pasture. See associated map of the sites | |
| 6 | Year_converted | yyyy | If pasture, the year (yyyy) in which forest was converted to pasture. If still in forest, then Year_converted is zero (0) |
| 7 | Pasture_age | years | If pasture, the age of pasture when sample was collected, i.e. number of years since forest was converted to pasture; if still in forest, then Pasture_age is zero (0) |
| 8 | Depth | cm | Depth of lysimeter in centimeters (cm) |
| 9 | Rep | Lysimeter identification within a location: Upland sites consist of 5 lysimeters at each depth (30 and 100cm). In the slope and floodplain sites there are 2 replicates per depth. Where necessary, samples from two lysimeters were combined to form a composite sample and both are identified | |
| 10 | NH4 | umol/L | Concentration of ammonium in micromoles per liter (umol/L) |
| 11 | NO3 | umol/L | Concentration of nitrate in micromoles per liter (umol/L) |
| 12 | PO4 | umol/L | Concentration of phosphate (SRP) in micromoles per liter (umol/L) |
| 13 | DIN_to_DIP | Ratio of dissolved inorganic nitrogen (NH4 + NO3) to dissolved inorganic phosphorus (PO4) | |
| 14 | TDN | umol/L | Concentration of total dissolved nitrogen in micromoles per liter (umol/L) |
| 15 | TDP | umol/L | Concentration of total dissolved phosphorus in micromoles per liter (umol/L) |
| 16 | DON | umol/L | Concentration of dissolved organic nitrogen in micromoles per liter (umol/L), calculated as TDN minus sum of NH4 + NO3 |
| 17 | DOP | umol/L | Concentration of dissolved organic phosphorus in micromoles per liter (umol/L), calculated as TDP minus PO4 |
| 18 | Fe | ppm | Concentration of total dissolved iron in parts per million (ppm) |
| Missing data are represented as -9999 | |||
| Values of 0.00 for concentrations represent below detection limit | |||
Example data records:
|
Location,Date,Season,Landuse,Slope,Year_converted,Pasture_age,Depth,Rep,NH4,NO3,PO4,DIN_to_DIP,TDN,TDP,DON,DOP,Fe Nova Vida,19970224,Wet,Pasture,Upland,1989,8,30,1,13.09,7.96,1.9,11.08,109.94,1.6,88.89,-9999,5.86 Nova Vida,19970224,Wet,Pasture,Upland,1989,8,30,2,-9999,1.88,-9999,-9999,451.85,14.02,-9999,-9999,-9999 ... Nova Vida,19980324,Wet,Forest,Slope,0,0,30,2,-9999,862.98,0.24,-9999,475.13,0.68,-9999,0.44,0.08 Nova Vida,19980324,Wet,Forest,Slope,0,0,100,1,12.92,219.26,0.22,1055.36,240.46,0.54,8.28,0.32,0.35 ... Nova Vida,20010823,Dry,Pasture,Floodplain,1989,11,30,1,1.03,0,-9999,-9999,-9999,-9999,-9999,-9999,-9999 Nova Vida,20010823,Dry,Pasture,Floodplain,1989,11,100,1,1.11,0.64,-9999,-9999,-9999,-9999,-9999,-9999,-9999 |
Site boundaries: (All latitude and longitude given in decimal degrees)
| Site (Region) | Westernmost Longitude | Easternmost Longitude | Northernmost Latitude | Southernmost Latitude | Geodetic Datum |
|---|---|---|---|---|---|
| Rondonia - Fazenda Nova Vida (Rondonia) | -62.811 | -62.811 | -10.156 | -10.156 | World Geodetic System, 1984 (WGS-84) |
Time period
- The data set covers the period 1994/04/24 to 2001/09/12
- Temporal Resolution: Soil water and stream water were both sampled once in the dry season and once in the wet season over the course of the study. Streambed characterization and cross-sectional depth measurements were done once
Platform/Sensor/Parameters measured include:
- FIELD INVESTIGATION / ION CHROMATOGRAPH / SURFACE WATER CHEMISTRY
- LABORATORY / AA (ATOMIC ABSORPTION SPECTROMETER) / GROUNDWATER CHEMISTRY
- LABORATORY / AUTOANALYZER / PHOSPHATE
- FIELD INVESTIGATION / STREAM GAUGE / DISCHARGE/FLOW
- FIELD INVESTIGATION / AUTOANALYZER / NITROGEN
Table 1. Streamwater sampling station descriptions including Study Area. See Figure 1 for locations.
| Station No. | Streamwater sampling station descriptions including Study Area |
|---|---|
| 1 | Aldeia stream where it crosses BR-364 |
| 2 | Rio Valha me Deus where it crosses BR-364 |
| 3 | Rio Quatro Cachoeiras where it crosses B-65 |
| 4 | PVA1 Forest stream. Regular sampling station just inside forest |
| 5 | PVA1 Pasture stream. 1 km upstream of forest reserve. Old PVA1 pasture sampling location. |
| 6 | Aldeia stream at the bridge near Aldeia settlement |
| 7 | PVA2 Pasture stream at regular sampling location |
| 8 | PVA2 Forest stream at regular sampling location |
| 9 | Unnamed river just north of the intersection of BR-364 with B-80 (back road in to Rancho Grande). (Not on map. Contact L. Deegan or C.Neill for further information about the exact location.) |
| 10 | Rio Andira at BR-364 |
| 11 | PVA2 forest stream at the PVA2 road crossing. Farther upstream in forest than regular station |
| 12 | PVA1 Pasture. Regular sampling station. Just upstream of where PVA1 pasture stream joins PVA1 forest stream |
| 13 | Unnamed pasture stream where it crosses BR-364 north of entrance to Retiro São Paulo |
| 14 | Unnamed stream where it crosses BR-364 just south of intersection with B-65. |
| 15 | Unnamed stream where it crosses BR-364 just south station 14 |
| 16 | Stream on Rancho Grande property at marker No. 17 (Not on map. Contact C.Neill or L. Deegan for further information about the exact location.) |
| 17 | Rio dos Indios reached by trail on the Brad and Becky Stern property, off of C-20, near Rancho Grande. (Not on map. Contact C.Neill or L. Deegan for further information about the exact location.) |
| 18 | Rio dos Indios where it crosses C-20. (Not on map. Contact L. Deegan or C.Neill for further information about the exact location.) |
| 19 | Rio Quatro Cachoeiras where it crosses B-80. (Not on map. Contact C.Neill or L. Deegan for further information about the exact location.) |
| 20 | PVA1 Transition. Forest stream 1 km downstream from forest, by Aldeia road. A regular PVA1 sampling station |
| 21 | PVA1 Forest upstream dripper site, in forest |
| 22 | PVA1 Forest upstream hunting trail, in forest |
| 23 | PVA1 Forest 200 m downstream in pasture, dripper site |
| 24 | Aldeia stream, at 1983 pasture gate |
| 25 | Aldeia stream, at Retiro São Paulo bridge |
| 26 | PVA2 stream reached by driving into Retiro Pauldalho, and turning right across from Paudalho settlement |
| 27 | PVA2 pasture site on fazenda down PVA2 road. Through gate |
| 28 | PVA2 upstream pasture site, reached on foot by walking about 2K from regular PVA2 pasture site |
| 29 | PVA2 upstream of road crossing at Rio Andira. As of yet, we haven't found this station |
| 30 | PVA2 upstream of road crossing at Rio Andira through Nova Vida gate under power lines |
| 31 | PVA1 edge. 50m from forest edge. |
| 32 | PVA1 edge. Very near Station 32. |
| 33 | Immediately after the confluence of PVA1 pasture and forest streams (just after bridge and around the bend- in riparian trees) |
| 34 | Upstream of Sta. 12 in PVA1 pasture stream. Where we have done nutrient additions upstream of bridge. |
| 35 | Rio Quatro Cachoeiras behind house. Just off road. Easily accessible. Sampling point just after bridge over Rio QC. |
| 36 | 1st order pasture stream in area where soils manipulations will occur. |
| 37 | 1st order forest stream that crosses Aldeia-Pau D'Alho road and joins the Rio Valha me Deus. |
| 38 | 1st order forest stream that crosses Aldeia-Pau D'Alho road and joins the Rio Valha me Deus. |
| 39 | 1st order pasture stream that joins the Rio Valha me Deus. |
| 40 | 1st order pasture stream that joins the PVA1 pasture stream. |
| 41 | 1st order pasture stream that joins the Rio Valha me Deus (crosses main road into Retiro Pau D'Alho from BR-364). |
3. Data Application and Derivation:
These data allow for direct comparisons of stream and soil water nutrient concentrations and other physiochemical characteristics between pasture and forest land uses and across wet and dry seasons. Sampling was done on streams of various orders allowing investigators to better understand the impacts of land use on stream nutrient dynamics at various scales.
4. Quality Assessment:
All data have been reviewed and checked for quality and no further changes to the data are anticipated.
5. Data Acquisition Materials and Methods:
Study area:
The data were collected from the Aldeia river network at Fazenda Nova Vida, a large cattle ranch 50 km from the city of Ariquemes, in central Rondonia. The climate of central Rondonia is humid tropical. Mean annual relative humidity is 89 percent, mean daily temperature is 25.6 degrees C, and mean daily temperature for the warmest and coolest months varies <5 degrees C (Bastos and Diniz, 1982). Rainfall averages 2.2 m/yr with a distinct dry season during June-October and a rainy season stretching from November-May. Rainfall averages more than 300 mm per month in the wettest four months (December-March) and less than 40 mm per month during the driest three months (June-August) (Bastos and Diniz, 1982).
The river network consists of first to fourth order streams in a mix of forest and pasture. Terrain was gently rolling, with low-gradient, second-order, clear-water streams draining the basins. Streams of second-order and higher had flowing water through all but the severest dry periods.
Forest in the cleared basins was converted directly to pasture by cutting, burning, and planting pasture grasses in the same year. Brush was cut in March, large trees were felled in June or July, slash was burned in late August or September, and the pasture grass Brachiara brizantha [Hochst] Stapf was seeded during December or January. Pastures were not cultivated, nor were they amended with fertilizer or lime. Pastures were actively grazed beginning approximately one year after forest clearing and stocked throughout this study at 1-1.5 animals/ha. Pasture stream channels were bordered by uplands planted to B. brizantha and had only scattered trees in the riparian zone. Pasture stream channels typically contained wetland grasses (Paspallum spp.), which sometimes form floating mats that covered most of the stream channel.
Descriptions of intensively studied streams:
In two watersheds (referred to as PVA1 and PVA2), two smaller (2nd order) drainage basins, one with forest cover and one with pasture cover, were identified and paired: PVA1-Forest4 with PVA1-Pasture12 and PVA2-Forest8 with PVA2-Pasture7. PVA1, a third-order stream (PVA1-Pasture 25) that was the confluence of the second-order forest and pasture streams, was also intensively studied.
- In PVA1, the second-order forest stream had a watershed area of 17.8 km2. It was shaded, had a pool and run structure and a mean wetted width of 4 m, a maximum depth of 42 cm and dry season discharges of 15-40 L s-1.
- The PVA1 second-order pasture stream had a watershed area of 8.4 km2. It was bordered by the C4 grass Paspalum repens (Medina et al., 1976) along its entire length, had slow-moving deep runs with extensive channel infilling by grass, organic material, a mean wetted channel width of 5.2 m, an open water channel width of 1.4 m and a mean depth of 42 cm. It had dry season discharges from 14 to 90 L s-1.
- The PVA1 third-order pasture stream had a watershed area of 27 km2. It had high sandy banks, a pool and run structure and lacked extensive growth of grass in the stream channel. Although this stream had some riparian trees, the canopy was relatively open and most of the stream was exposed to the sun. It had a wetted channel width of 3.6 m, a nearly identical open water channel width of 3.5 m and a mean depth of 34 cm. It had dry season discharges of 45 to 100 L s-1. These basins lie at 200-500 m elevation in a region generally underlain by Precambrian granitic rock (Projeto RADAMBRASIL, 1978).
Stream physical characterization:
In PVA 1, stream physical characteristics were measured in a one-time synoptic survey during the dry seasons, June-August, of 1998 and 1999 in representative reaches of 800 m (forest stream; PVA1-Forest4), 500 m (second-order pasture stream; PVA1-Pasture12) and 760 m (third-order pasture stream; PVA1-Pasture25) that had no obvious tributaries or other obvious surface water inputs. The second- and third-order streams were marked at 20 m intervals and sampling stations were assigned, relative to the location at 0 m, at -260, 40, 60, 100, 140, 200, 320, 560, and 800 m for the second-order forest stream, -90, 30, 50, 80, 126, 232, and 500 m for the second-order pasture stream, and at -90, 40, 60, 100, 195, 460, and 760 m for the third-order pasture stream.
- Stream depth and benthic substrate type were recorded every 5 or 10 cm in cross sections (20 to 80 points per cross section) of the stream channels.
- •Substrate type was classified as: terrestrial leaf pack (Leaf), woody debris (downfall trucks and stems; Wood), thin layer of fine organic matter over sand (Fine), exposed sand (sand), clay (clay) or gravel (gravel), coarse fragments of decomposed organic matter (detritus), and riparian grass (riparian). Very small patches of filamentous algae were observed but their area (< 0.01% of stream bottom) did not warrant a separate quantitative habitat classification. In the forest, cross sections were done every 10 m, at the designated stations and 5 m and 10 m upstream and downstream of the station (N= 75 cross sections).
In the pasture streams, cross sections were at 10 m intervals from the 0 m station to the 100 m station, every 20 m between the 100 m and 200 m stations, and every 40 m downstream of the 200 m station. Additional cross sections were measured at the designated stations and 5 m and 10 m up and downstream of the designated stations (N=45 cross sections in second-order and 39 in third-order pasture streams). Percent cover by substrate type for each cross section was the total number of occurrences of each substrate type divided by the total number of occurrences of all substrate types. Mean percent cover for the stream reach of each substrate type was determined by averaging the percent for each cross section.
Stream Discharge:
Stream discharge is calculated from measurements of stream flow rate (measured with a propeller flow probe) and stream depth (Hauer and Lamberti, 1996).
Streamwater Collection and Analysis Methods:
Between 1994 and 2001 at each station the following samples were collected and analyzed as described.
Derived value notes:
Dissolved inorganic nitrogen to phosphorus ratios (DIN:DIP) was calculated as (nitrate + ammonium)/phosphate.
Dissolved organic nitrogen and phosphorus (DON and DOP) were calculated from the difference between TDN and TDP and inorganic N and P, respectively.
Sample collections:
At each streamwater sampling location, in a 1L Nalgene bottle, collect a streamwater sample by first rinsing the bottle with streamwater three times and then filling, avoiding surface material and other ‘floaters’.
Ammonium (NH4+) Collection and Analysis
Field- From the 1L Nalgene bottle, pour a subsample into a rinsed cup from which approximately 20 mL is extracted with a 60 mL syringe. This volume of water is used to rinse the syringe. Draw streamwater into the syringe and filter the sample through a filter holder loaded with a 25 mm diameter ashed GFF filter. The first 10 mL is passed through the filter to remove any impurities on the holder or filter. Another 10 mL or so is used to rinse the clean, acid-washed 60 mL bottle. Then filter 50 mL into the rinsed bottle. Add 1 mL of 6N HCl. Cap, shake, and store in a cooler until the sample can be refrigerated.
Laboratory- Using the phenol-hypochlorite method (Alpkem Corporation, Method No. A303-S020-02), samples were run using an Alpkem colorimetric autoanalyzer.
Nitrate (NO3-) Collection and Analysis
Field- From the 1L Nalgene bottle, pour a subsample into a rinsed cup from which approximately 20 mL is extracted with a 60 mL syringe. This volume of water is used to rinse the syringe. Draw streamwater into the syringe and filter the sample through a filter holder loaded with a 25 mm diameter ashed GFF filter. The first 10 mL is passed through the filter to remove any impurities on the holder or filter. Another 10 mL or so is used to rinse the clean, 60 mL acid-washed bottle. Then filter 50 mL into the rinsed bottle. Add 1 mL of 6N HCl to the bottle. Cap, shake, and store in a cooler until the sample can be refrigerated.
Laboratory- Using the cadmium reduction method (Alpkem Corporation, Method No. A303-S171-09), samples were run using an Alpkem colorimetric autoanalyzer.
Phosphate (PO4-3) Collection and Analysis
Field- From the 1L Nalgene bottle, pour a subsample into a rinsed cup from which approximately 20 mL is extracted with a 60 mL syringe. This volume of water is used to rinse the syringe. Draw streamwater into the syringe and filter the sample through a filter holder loaded with a 25 mm diameter ashed GFF filter. The first 10 mL is passed through the filter to remove any impurities on the holder or filter. Another 10 mL or so is used to rinse the clean, 60 mL acid-washed bottle. Then filter 50 mL into the rinsed bottle. Add 1 mL of 6N HCl to the bottle. Cap, shake, and store in a cooler until the sample can be refrigerated.
Laboratory- Using the antimony/molybdate and ascorbic acid method (Alpkem Corporation, Method No. A303-S200-00), samples were run using an Alpkem colorimetric autoanalyzer.
Cations (Mg, Na, K, Ca, Fe) Collection and Analysis
From the 1L Nalgene bottle, pour a subsample into a rinsed cup from which approximately 20 mL is extracted with a 60 mL syringe. This volume of water is used to rinse the syringe. Draw streamwater into the syringe and filter the sample through a filter holder loaded with a 25 mm diameter ashed GFF filter. The first 10 mL is passed through the filter to remove any impurities on the holder or filter. Another 10 mL or so is used to rinse the clean, acid-washed 60 mL bottle. Then filter 50 mL into the rinsed bottle. Add 1 mL of 6N HCl to the bottle. Cap, shake, and store in a cooler until the sample can be refrigerated.
Laboratory- Using an air/acetylene flame, read cation absorptions using a flame spectrometer.
Total Dissolved Nitrogen (TDN) Collection and Analysis
Field- From the 1L Nalgene bottle, pour a subsample into a rinsed cup from which approximately 20 mL is extracted with a 60 mL syringe. This volume of water is used to rinse the syringe. Draw streamwater into the syringe and filter the sample through a filter holder loaded with a 25 mm diameter ashed GFF filter. The first 10 mL is passed through the filter to remove any impurities on the holder or filter. Another 10 mL or so is used to rinse the clean, 60 mL acid-washed bottle. Then filter 50 mL into the rinsed bottle. Store in a cooler until the sample can be frozen.
Laboratory- Using an alkaline persulfate matrix, digest sample (method 4500-Norg Dc) and analyze for nitrate.
Total Dissolved Phosphorus (TDP) Collection and Analysis
Field- From the 1L Nalgene bottle, pour a subsample into a rinsed cup from which approximately 20 mL is extracted with a 60 mL syringe. This volume of water is used to rinse the syringe. Draw streamwater into the syringe and filter the sample through a filter holder loaded with a 25 mm diameter ashed GFF filter. The first 10 mL is passed through the filter to remove any impurities on the holder or filter. Another 10 mL or so is used to rinse the clean, 60 mL acid-washed bottle. Then filter 50 mL into the rinsed bottle. Add 1 mL of 6N HCl to the bottle. Cap, shake, and store in a cooler until the sample can be refrigerated.
Laboratory- Using an acidic persulfate matrix, digest sample (Koroleff 1983) and analyze for phosphate.
Chlorophyll (Chl) Collection and Analysis
Field- Into a vacuum filtration setup, filter up to 500 mL of streamwater through a 47 mm diameter ashed GFF filter. Release vacuum and fold filter in quarters and wrap in aluminum foil. Keep as cool as possible until sample can be frozen. (At present, the sample wrapped in foil is placed in a small plastic ziplock bag that is then placed directly into a container filled with ice.)
Laboratory- Extract chlorophyll from filter with 95% buffered acetone overnight (Strickland and Parsonse) and analyze the extract the following day
using a fluorometer. Final extract concentrations should take into account background matrix and phaophytin fluorescence.
NOTE: These following steps are done in the lab with 1L of unfiltered streamwater collected and kept in a cooler for transport to the laboratory.
pH and Alkalinity Collection and Analysis
Field- In a 1L Nalgene bottle, collect a streamwater sample by first rinsing the bottle with streamwater three times and then filling the bottle to the top (without bubbles), avoiding surface material and other ‘floaters’. Place bottle in a dark cooler with ice until return to the laboratory.
Field Laboratory- The cooled sample is allowed to return to room temperature. pH is measured with a calibrated pH probe and then the sample is titrated to pH 4.5 and pH 4.2 using a Hach titrator with 0.16N H2SO4. Alkalinity is calculated using the equation (2A-B) * 0.1= Alkalinity, where A is the number of titration units to pH 4.5 and B is the number of titration units to pH 4.2 (this includes the previous titration units as well).
Total Suspended Solids (TSS) Collection and Analysis
Field- In a 1L Nalgene bottle, collect a streamwater sample by first rinsing the bottle with streamwater three times and then filling the bottle, avoiding surface material and other ‘floaters’. Place bottle in a dark cooler with ice until return to the field laboratory.
Field Laboratory- Using a vacuum filtration setup, filter streamwater through a weighed (to 4 places) and ashed 25 mm diameter GFF filter.
Pass as much water as possible through the filter until it clogs.
Record the volume of filtrate and the weight of the filter. Air dry the filter.
After the sample is returned to the lab, dry at 50ºC for 24 hours and reweigh filter to 4 places.
Particulate Organic Nitrogen and Carbon (PON/POC) Collection and Analysis
Field- In a 1L Nalgene bottle, collect a streamwater sample by first rinsing the bottle with streamwater
three times and then filling the bottle, avoiding surface material and other ‘floaters’.
Place bottle in a dark cooler with ice until return to the field laboratory.
Field Laboratory- Follow the instructions for filtering the Total Suspended Solids sample (presently, a double vacuum setup is being used, with the vacuum being produced by a peristaltic pump), with the exception that this GFF filter does NOT need to be weighed. Dry the filter as above. Back at the lab, the filter can be dried (as above) and packaged for analysis on a carbon/nitrogen analyzer.
Laboratory- Pack the dried filter in an aluminum circle wrap (follow machine-specific directions). Run the samples in a carbon-nitrogen detector to determine carbon and nitrogen concentrations.
Soil Solution Sample Collection with Tension Lysimeters and Analysis Methods:
Soil solution was collected from tension lysimeters (Soil Moisture Equipment, Goleta, California, USA) installed in 30 cm and 100 cm pairs at each site in September 1996 as shown in Figure 2.
Pumping
Lysimeters should be vacuum-pumped 24 to 48 hours before the anticipated collection (vacuum pressure to be used: 45 psi).
Remove any standing water in the lysimeter and check the clamps, tubing, and cap for signs of wear and damage.
Collection
Remove the lysimeter cap and insert the glass rod connected to the suction assembly. If the lysimeter has water, suction a small amount into the collection bottle and rinse. Suction the remaining water from the lysimeter into the collection bottle. Transfer the contents of the collection bottle to the two 50 mL sample bottles. First collect for nutrients, cations, and TDP and if there is sample remaining, collect for TDN and anions.
Rinse the suction assembly with DI to prepare for the next lysimeter.
Back at the truck, preserve the nutrient/cation sample with 6N HCl in the same amount as the regular water samples (e.g., for a 50 mL sample, use 1 mL of 6N HCl). This sample gets refrigerated. The TDN/TDP sample treated the same as regular water sample TDN/TDP’s- frozen.
Ammonium (NH4+) Collection and Analysis
Field- Collect as described above and preserve with HCl (Add 1 mL of 6N HCl for 50 mL). Cap, shake, and store in a cooler until the sample can be refrigerated.
Laboratory- Using the phenol-hypochlorite method (Alpkem Corporation, Method No. A303-S020-02), samples were run using an Alpkem colorimetric autoanalyzer.
Nitrate (NO3-) Collection and Analysis
Field- Collect as described above and preserve with HCl (Add 1 mL of 6N HCl for 50 mL). Cap, shake, and store in a cooler until the sample can be refrigerated.
Laboratory- Using the cadmium reduction method (Alpkem Corporation, Method No. A303-S171-09), samples were run using an Alpkem colorimetric autoanalyzer.
Phosphate (PO4-3) Collection and Analysis
Field- Collect as described above and preserve with HCl (Add 1 mL of 6N HCl for 50 mL). Cap, shake, and store in a cooler until the sample can be refrigerated.
Laboratory- Using the antimony/molybdate and ascorbic acid method (Alpkem Corporation, Method No. A303-S200-00), samples were run using an Alpkem colorimetric autoanalyzer.
Cations (Mg, Na, K, Ca, Fe) Collection and Analysis
Field- Collect as described above and preserve with HCl (Add 1mL of 6N HCl for 50 mL).Cap, shake, and store in a cooler until the sample can be refrigerated.
Laboratory- Using an air/acetylene flame, read cation absorptions using a flame spectrometer.
Total Dissolved Nitrogen (TDN) Collection and Analysis
Field- Collect as described above but do not preserve. Store in a cooler until the sample can be frozen.
Laboratory- Using an alkaline persulfate matrix, digest sample (method 4500-Norg Dc) and analyze for nitrate.
Total Dissolved Phosphorus (TDP) Collection and Analysis
Field- Collect as described above and preserve with HCl (Add 1mL of 6N HCl
for 50 mL). Cap, shake, and store in a cooler until the sample
can be refrigerated.
Laboratory- Using an acidic persulfate matrix, digest sample (Koroleff 1983) and analyze for phosphate.
6. Data Access:
This data is available through the Oak Ridge National Laboratory (ORNL) Distributed Active Archive Center (DAAC).
Data Archive Center:
Contact for Data Center Access Information:
E-mail: uso@daac.ornl.gov
Telephone: +1 (865) 241-3952
7. References:
Alpkem Corporation. RFA Methodology Handbook. 1987. College Station, Texas.
Bastos, T.X. and T.D. Diniz. 1982. Avaliacao de clima do Estados de Rondonia para Desenvolvimento Agricola. Boletim de pesquisa No. 44. EMBRAPA-CPATU: Belem PA.
Eaton, A.D., L.S. Clesceri and A.E. Greenberg. 1995. Standard Methods for the Examination of Water and Wastewater. 19th edn. American Public Health Association, Washington, DC, USA.
Garcia-Montiel, D., C. Neill, J.M. Melillo, S.M. Thomas, P.A.Steudler and C.C. Cerri. 2000. Soil phosphorus transformations after forest clearing for pasture in the Brazilian Amazon. Soil Science Society of America Journal 64: 1792-1804.
Hauer, F.R. and G.A. Lamberti. 1996. Methods in Stream Ecology. Academic Press, New York.
Koroleff. F. 1983. Determination of total phosphorus by acid persulfate oxidation. Pages 134-136in K. Grasshoff, M. Erhardt and K. Kremling, editors. Methods of seawater analysis. Verlag Chemie, Weinheim Germany.
Moraes, J., C.C. Cerri, J.M. Melillo, D. Kicklighter, C. Neill, D.L. Skole and P.A. Steudler. 1995. Soil carbon stocks of the Brazilian Amazon Basin. Soil Science Society of America Journal. 59: 244-247.
Moraes, J.F.L., B. Volkoff, M. Bernoux and C. Cerri. 1996. Soil properties under Amazon forest and changes due to pasture installation in Rondonia (Brazil). Geoderma 70: 63-81.
Neill, C., M.C. Piccolo, P.A. Steudler, J.M. Melillo, .J. Feigl and C.C. Cerri. 1995. Nitrogen dynamics in soils of forests and active pastures in the western Brazilian Amazon Basin. Soil Biology and Biochemistry 27: 1167-1175.
Perkin Elmer Corporation. Atomic Absorption Spectrophotometry. 1982. Norwalk, Connecticut.
Pires, J.M. and G.T. Prance. 1986. The vegetation types of the Brazilian Amazon. In Key Environments: Amazonia. Prance GT and Lovejoy TM (eds). Pergamon Press: Oxford; 109-129.
Strickland, J.D.H. and T.R. Parsons. 1972. A Practical Handbook of Seawater Analysis. Fisheries Research Board of Canada. Ottawa.
Related Publications
- Thomas S.M., Neill C., Deegan L.A., Krusche A.V., Ballester V.M., Victoria R.L. 2004. Influences of land use and stream size on particulate and dissolved materials in a small Amazonian stream network. Biogeochemistry 68: 135-151.
- Neill, C., L.A. Deegan, S.M. Thomas, and C.C. Cerri. 2001. Deforestation for pasture alters nitrogen and phosphorus in small Amazonian Streams. Ecological Applications 11(6):1817-1828.
- Richey, J.E., A.V. Krusche, L.A. Deegan, V.M. Ballester, T.W. Biggs, and R. Victoria. 2001. Land use changes and the biogeochemistry of river corridors in the Amazon. IGBP Global Change Newsletter 45:19-22.
- Neill, C., L.A. Deegan, S.M. Thomas, C.L. Haupert, A.V. Krusche, V.M. Ballester, and R.L. Victoria. 2006. Deforestation alters the hydraulic and biogeochemical characteristics of small lowland Amazonian streams. Hydrological Processes 20(12):2563-2580.
- Neill C, Piccolo MC, Cerri CC, Steudler PA, Melillo JM. (2006) Soil solution nitrogen losses during clearing of lowland Amazon forest for pasture. Plant and Soil, 281, 233-245