Get Data
Summary:
This data set includes measurements of dissolved nutrient and organic carbon concentrations, as well as dissolved oxygen, alkalinity, conductivity, turbidity, pH, and discharge from three streams located in mixed land use (crop fields, pastures, secondary vegetation, and forest) and two streams in entirely forested landscapes near Paragominas in the state of Para, Brazil. Stream water samples were collected during two different periods: 1) weekly from August 1999 to July 2001 at location Igarape 54, Station 5 and 2) monthly from April 2003 through October 2005 at all of the stations. The exact start date and suite of measurements vary by location. In addition, samples from precipitation collectors at the Paragominas Meteorological Station were measured for major ion concentrations every two weeks from 1999 to 2001. There are two comma delimited ASCII data files with this data set.
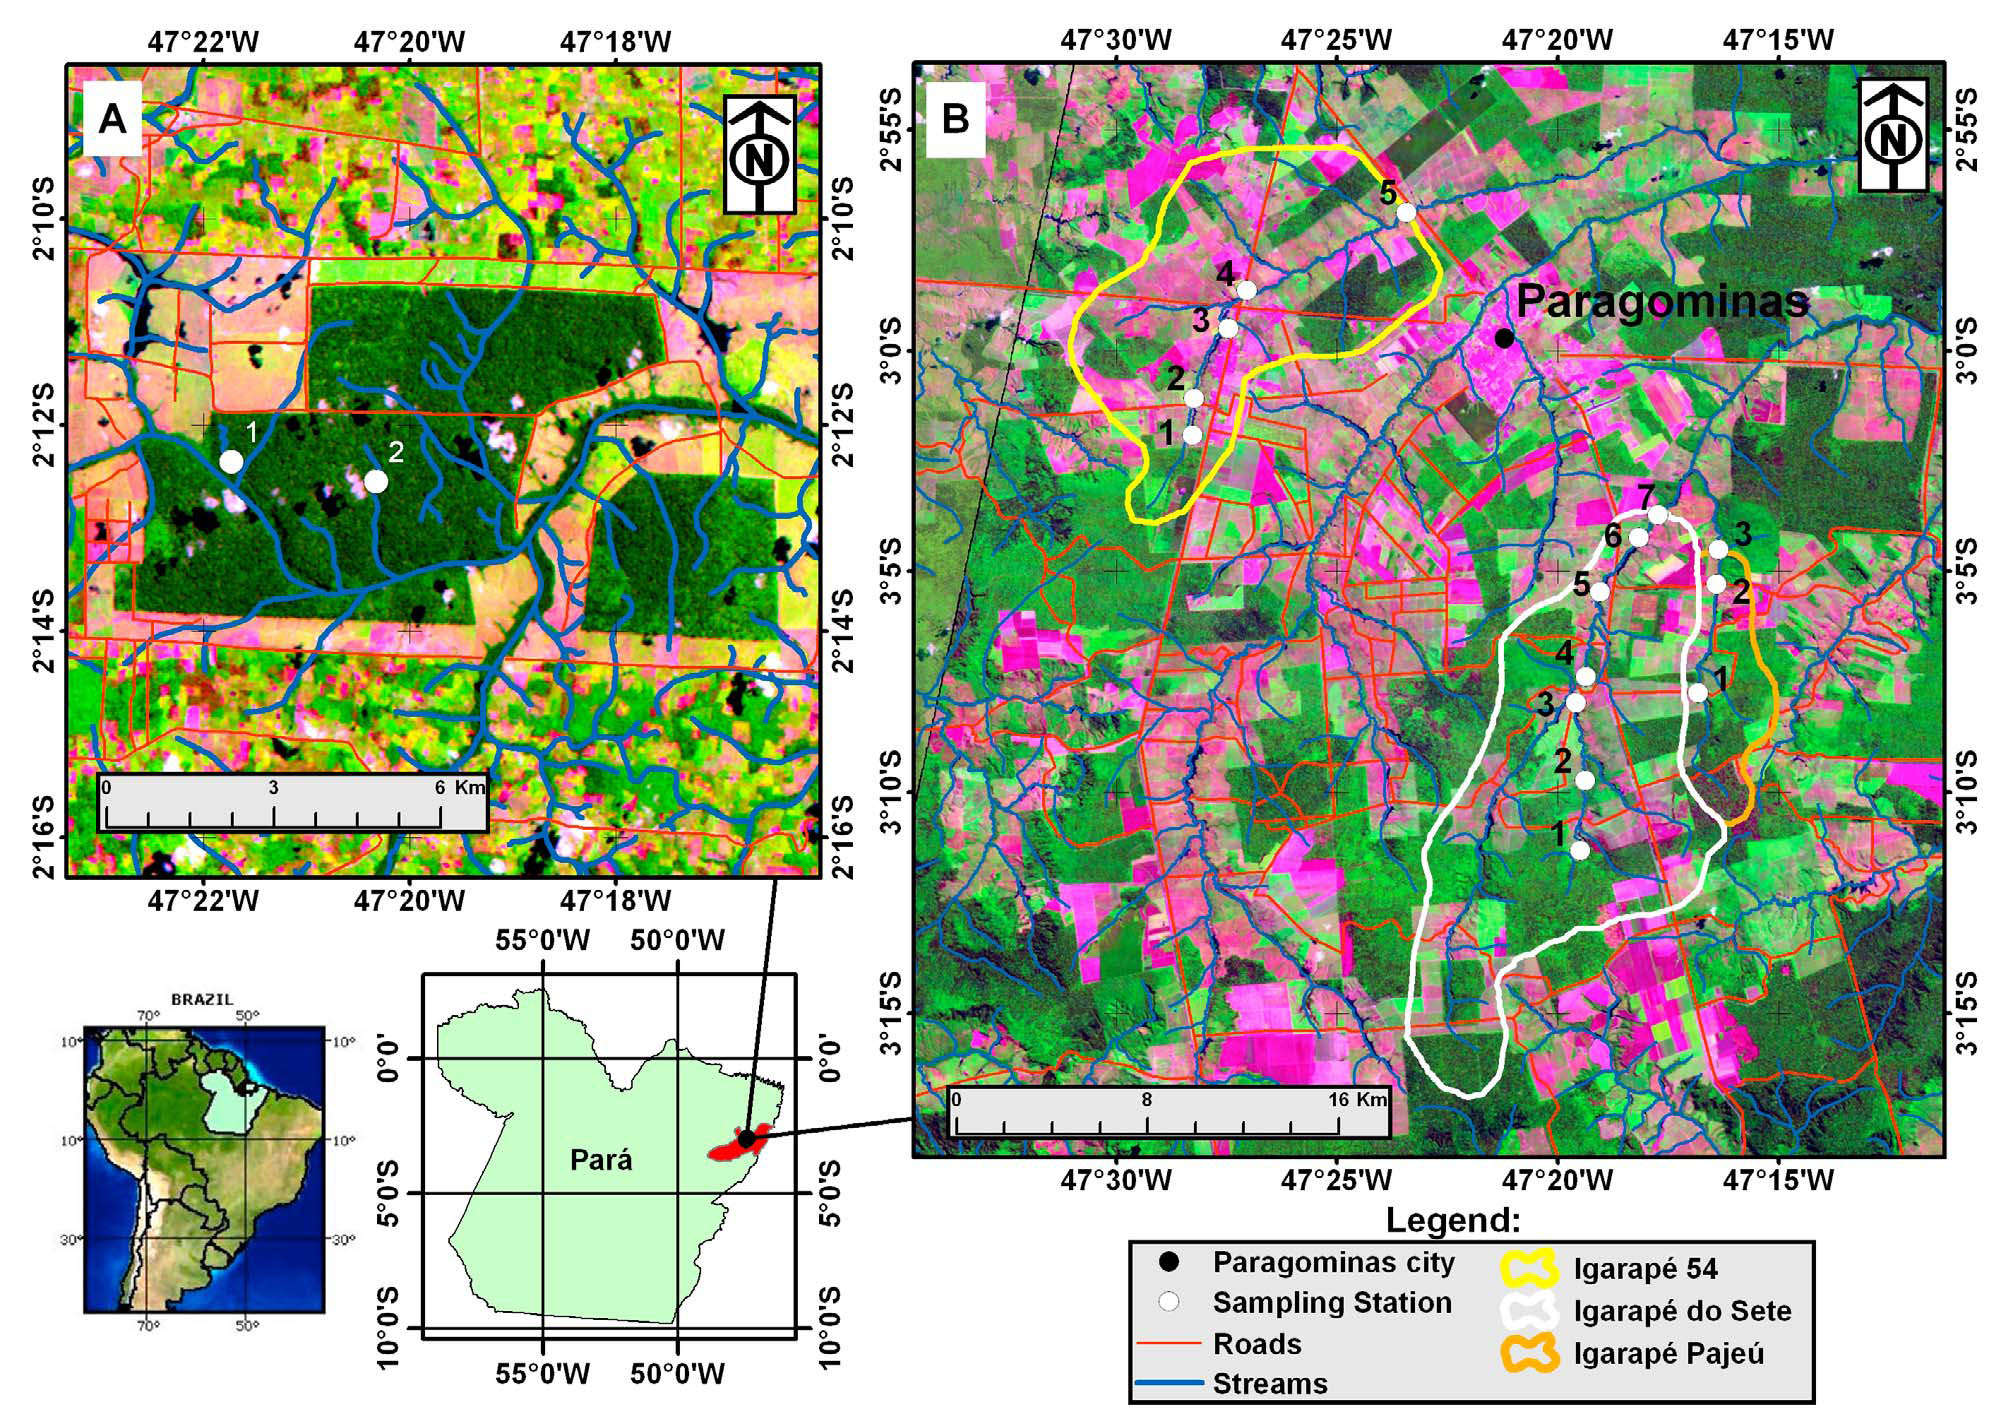
Figure 1. (a) The two pristine headwater streams and sample locations identified in Capitão Poço (indicated by the white dots and the numbers “1” and “2”) that are part of the Arauaí River Basin (2002 LANDSAT imagery); and (b) the three study watersheds in Paragominas, with stream sampling locations identified by white dots (2004 LANDSAT imagery). Study sites are shown in relation to the Brazilian state of Pará and to South America. These TM Landsat images present composite coloring, where band 3 is blue, band 4 is green, and band 5 is red. Areas with green tones are associated with presence of significant biomass, whereas those with red tones indicate significant exposed soil.
Data Citation:
Cite this data set as follows:
Davidson, E.A., D. Markewitz, and R. de Figueiredo. 2012. LBA-ECO ND-02 Stream Water Chemistry, Paragominas, Para, Brazil: 1999-2005. Data set. Available on-line [http://daac.ornl.gov] from Oak Ridge National Laboratory Distributed Active Archive Center, Oak Ridge, Tennessee, U.S.A. http://dx.doi.org/10.3334/ORNLDAAC/1067
Implementation of the LBA Data and Publication Policy by Data Users:
The LBA Data and Publication Policy [http://daac.ornl.gov/LBA/lba_data_policy.html] is in effect for a period of five (5) years from the date of archiving and should be followed by data users who have obtained LBA data sets from the ORNL DAAC. Users who download LBA data in the five years after data have been archived must contact the investigators who collected the data, per provisions 6 and 7 in the Policy.
This data set was archived in February of 2012. Users who download the data between February 2012 and January 2017 must comply with the LBA Data and Publication Policy.
Data users should use the Investigator contact information in this document to communicate with the data provider. Alternatively, the LBA website [http://lba.inpa.gov.br/lba/] in Brazil will have current contact information.
Data users should use the Data Set Citation and other applicable references provided in this document to acknowledge use of the data.
Table of Contents:
- 1 Data Set Overview
- 2 Data Characteristics
- 3 Applications and Derivation
- 4 Quality Assessment
- 5 Acquisition Materials and Methods
- 6 Data Access
- 7 References
1. Data Set Overview:
Project: LBA (Large-Scale Biosphere-Atmosphere Experiment in the Amazon)
Activity: LBA-ECO
LBA Science Component: Nutrient Dynamics
Team ID: ND-02 (Davidson / Stone / Markewitz / Carvalho / Sa / Vieira / Moutinho / Figueiredo)
The investigators were Davidson, Eric A.; Markewitz, Daniel; Figueiredo, Ricardo de Oliveira; Araujo, Thereza Cristina; Bastos, Therezinha Xavier; Costa, Fabiola Fernandes; Cunha, Ewerton da Silva; Pacheco Jr., Alvaro Castro; Leite, Tania de Sousa; Schuler, Marysol A.E.; Pacheco, Nilza Araujo; Portela, Gilvane Azevedo; Silva, Marilia; Silva, Patricio de Souza and Souza, Alex Henrique Moreira de. You may contact Figueiredo, Ricardo de Oliveira (ricardo@cpatu.embrapa.br).
LBA Data Set Inventory ID: ND02_Water_Paragominas
Between August 1999 and October 2005, dissolved nutrient and organic carbon concentrations, as well as dissolved oxygen, alkalinity, conductivity, turbidity and pH were measured in water samples from five streams located in mixed land use (crop fields, pastures, secondary vegetation and forest) and entirely forested landscapes in the state of Para. In addition, water samples from rain collectors were collected and analyzed for some nutrient concentrations.
2. Data Characteristics:
There are two comma-delimited ASCII files with this data set.
File 1. ND02_Stream_Chemistry_Data_1999-2005.csv
| Column | Heading | Units/format | Description |
|---|---|---|---|
| 1 | Site_code | Site Code (see site descriptions and coordinates above): IG54-1, IG54-2, IG54-3, IG54-4, IG54-5, IG7-1, IG7-2, IG7-3, IG7-4, IG7-5, IG7-6, IG7-7, IGP-1, IGP-2, IGP-3, CP1-2, CP2-2 | |
| 2 | Sample_date | yyyymmdd | Sample date (yyyymmdd) |
| 3 | Dischg_m3_s | m3/s | Discharge in cubic meters per second; not measured for IG54-5 prior to 2003 |
| 4 | Turb | FTU | Turbidity in FTU; not measured for IG54-5 prior to 2003 |
| 5 | Temp_C | degrees C | Temperature in degrees Celsius; not reported for IG54-5 prior to 2003 |
| 6 | 0_sat | Percent saturation of oxygen; not calculated for IG54-5 prior to 2003 | |
| 7 | Cond | uS/cm | Conductivity in microsiemens per centimeter |
| 8 | Alk_uE | ueq | Alkalinity in microequivalents |
| 9 | pH | pH | |
| 10 | Na_uE | ueq/L | Sodium in microequivalents per liter |
| 11 | K_uE | ueq/L | Potassium in microequivalents per liter |
| 12 | Ca_uE | ueq/L | Calcium in microequivalents per liter |
| 13 | Mg_uE | ueq/L | Magnesium in microequivalents per liter |
| 14 | NH4N_uE | ueq/L | Ammonium in microequivalents per liter |
| 15 | NO3N_uE | ueq/L | Nitrate in microequivalents per liter |
| 16 | PO4P_uE | ueq/L | Phosphate in microequivalents per liter |
| 17 | SO4_uE | ueq/L | Sulfate in microequivalents per liter |
| 18 | Cl_uE | ueq/L | Chloride in microequivalents per liter |
| 19 | DON_uM | umol/L | Dissolved organic nitrogen in micromoles per liter; not calculated for IG54-5 prior to 2003 |
| 20 | DOC_uM | umol/L | Dissolved organic carbon in micromoles per liter |
| 21 | DiC_uM | umol/L | Dissolved inorganic carbon in micromoles per liter; not calculated for IG54-5 prior to 2003 |
| 22 | CO2_ml | mL/L | Carbon dioxide in milliliter per liter of water; not calculated for IG54-5 prior to 2003 |
| Note: Values missing because they were not measured are represented as -4444; values missing for any other reason are represented as-9999 | |||
Example data records:
|
Site_code,Sample_date,Dischg_m3_s,Turb,Temp_C,O_sat,Cond,Alk_uE,pH,Na_uE,K_uE,Ca_uE,Mg_uE, NH4N_uE,NO3N_uE,PO4P_uE,SO4_uE,Cl_uE,DON_uM,DOC_uM,DIC_uM,CO2_ml CP1-1,20030401,-4444,-4444,-4444,-4444,-4444,-4444,-4444,-4444,-4444,-4444,-4444, -4444,-4444,-4444,-4444,-4444,-4444,-4444,-4444,-4444 CP1-1,20030501,-4444,-4444,-4444,-4444,-4444,-4444,-4444,-4444,-4444,-4444,-4444, -4444,-4444,-4444,-4444,-4444,-4444,-4444,-4444,-4444 ... IG54-5,19991213,-4444,-4444,-4444,-4444,32.9,0,5.19,143.29,24.41,58.82,45.83, 5.8,3.07,0.235,42.45,393.76,-4444,138,-4444,-4444 IG54-5,19991220,-4444,-4444,-4444,-4444,32.1,0,5.09,145.86,23.43,51.35,44.99, 5.3,0.1,0.235,35.29,360.44,-4444,156,-4444,-4444 ... IGP-3,20050901,-9999,0,26.6,65.4,47.8,18,5.12,-9999,-9999,-9999,-9999, -9999,-9999,-9999,-9999,-9999,-9999,-9999,-9999,-9999 IGP-3,20051001,-9999,3.24,29,60.3,36.6,11,4.78,-9999,-9999,-9999,-9999, -9999,-9999,-9999,-9999,-9999,-9999,-9999,-9999,-9999 |
File 2. ND02_Rain_Chemistry_Data_1999-2001.csv
| Site Code | Latitude | Longitude | Site name |
|---|---|---|---|
| PGM | -2.98333 | -47.4667 | Paragominas Meteorological Station |
| Column | Heading | Units/format | Description |
| 1 | Site_code | Site code: PGM = Paragominas Meteorological Station | |
| 2 | Sample_date | yyyymmdd | Sample date (yyyymmdd) |
| 3 | pH | pH | |
| 4 | SO4_uE | ueq/L | Sulfate in microequivalents per liter, volume weighted mean (VWM) |
| 5 | Cl_uE | ueq/L | Chloride in microequivalents per liter, volume weighted mean (VWM) |
| 6 | Na_uE | ueq/L | Sodium in microequivalents per liter, volume weighted mean (VWM) |
| 7 | Ca_uE | ueq/L | Calcium in microequivalents per liter, volume weighted mean (VWM) |
| 8 | K_uE | ueq/L | Potassium in microequivalents per liter, volume weighted mean (VWM) |
| 9 | Mg_uE | ueq/L | Magnesium in microequivalents per liter, volume weighted mean (VWM) |
| Missing values are represented as -9999. | |||
| Note that all ions (Ca, K, Na, Mg, Cl, and SO4) are volume weighted means (VWM) | |||
Example data records:
|
Site_code,Sample_date,pH,SO4_uE,Cl_uE,Na_uE,Ca_uE,K_uE,Mg_uE PGM,19990812,-9999,5.05,59.39,29.23,9.09,39.28,7.07 PGM,19990906,6.16,14.62,215.41,120.55,29.68,61,28.68 PGM,19990914,5.66,5.79,100.34,48.19,8.08,24.13,9.37 ... PGM,20000502,5.09,0.4,6.74,7.68,6.31,3.69,2.28 PGM,20000508,5.34,0.37,10.29,3.66,5.05,4.24,2.77 PGM,20000515,4.78,0.93,44.64,10.34,8.39,6.43,3.47 ... PGM,20010618,4.49,0.42,24.23,10.8,1.88,3.35,1.64 PGM,20010702,4.85,-9999,20.19,18.95,3.9,4.64,4.22 PGM,20010716,5.17,0.16,18.3,16.75,0.75,3.86,1.5 |
Site boundaries: (All latitude and longitude given in decimal degrees)
| Site (Region) | Westernmost Longitude | Easternmost Longitude | Northernmost Latitude | Southernmost Latitude | Geodetic Datum |
|---|---|---|---|---|---|
| Para Eastern (Belem) - Paragominas (Para Eastern (Belem)) | -47.667 | -47.2723 | -2.2015 | -3.1904 | World Geodetic System, 1984 (WGS-84) |
Sampling Sites: (All latitude and longitude given in decimal degrees)
| Site Code | Latitude | Longitude | Site name |
|---|---|---|---|
| IG54-1 | -3.035808 | -47.471747 | Igarape Cinquenta e Quatro, Station 1 |
| IG54-2 | -3.02123 | -47.4714 | Igarape Cinquenta e Quatro, Station 2 |
| IG54-3 | -2.99394 | -47.4587 | Igarape Cinquenta e Quatro, Station 3 |
| IG54-4 | -2.97868 | -47.4506 | Igarape Cinquenta e Quatro, Station 4 |
| IG54-5 | -2.94733 | -47.3905 | Igarape Cinquenta e Quatro, Station 5 |
| IG7-1 | -3.19035 | -47.3251 | Igarape do Sete, Station 1 |
| IG7-2 | -3.16417 | -47.3231 | Igarape do Sete, Station 2 |
| IG7-3 | -3.13511 | -47.3278 | Igarape do Sete, Station 3 |
| IG7-4 | -3.12393 | -47.3238 | Igarape do Sete, Station 4 |
| IG7-5 | -3.093 | -47.3138 | Igarape do Sete, Station 5 |
| IG7-6 | -3.07207 | -47.3038 | Igarape do Sete, Station 6 |
| IG7-7 | -3.06377 | -47.2888 | Igarape do Sete, Station 7 |
| IGP-1 | -3.12903 | -47.2802 | Igarape Pajeu, Station 1 |
| IGP-2 | -3.08832 | -47.273 | Igarape Pajeu, Station 2 |
| IGP-3 | -3.07547 | -47.2723 | Igarape Pajeu, Station 3 |
| CP1-1 | -2.2015 | -47.357 | Igarape Santa Maria headwaters in Capitao Poco, Station 1 (not actually a stream but seeps of the headwaters). Problems during data collection resulted in suspect values; only pH and CO2 are reported for this site. |
| CP1-2 | -2.207 | -47.3581 | Igarape Santa Maria headwaters in Capitao Poco, Station 2 |
| CP2-1 | -2.20361 | -47.3392 | Igarape Arauai headwaters in Capitao Poco, Station 1 (not actually a stream but seeps of the headwaters). Problems during data collection resulted in suspect values; only pH and CO2 are reported for this site. |
| CP2-2 | -2.20917 | -47.3386 | Igarape Arauai headwaters in Capitao Poco, Station 2 |
Time period:
- The data set covers the period 1999/08/12 to 2005/10/01
- Temporal Resolution: Weekly or Monthly
Platform/Sensor/Parameters measured include:
- LABORATORY / ION CHROMATOGRAPH / WATER ION CONCENTRATION
- LABORATORY / CARBON ANALYZER / ORGANIC MATTER
- FIELD INVESTIGATION / TURBIDITY METERS / TURBIDITY
- FIELD INVESTIGATION / TEMPERATURE SENSOR / WATER TEMPERATURE
- FIELD INVESTIGATION / PH METER / PH
- FIELD INVESTIGATION / OXYGEN ANALYZER / OXYGEN
- FIELD INVESTIGATION / STREAM GAUGE / DISCHARGE/FLOW
- LABORATORY / ION CHROMATOGRAPH / NUTRIENTS
3. Data Application and Derivation:
These data in combination with rainfall amount and streamflow data provide essential information for nutrient budgets for differing land-uses. Moreover, stream chemistry data combined with land use class quantification at each catchment sector can be used to evaluate land use change effects on water chemistry.
4. Quality Assessment:
Data have been reviewed and there are no known problems or expected revisions. Standard solutions (Environmental Research Associates, Arvada, CO) were used with all analyses for quality assurance. The main limitation was that discharge measurements could only be done once a month and in only a few stations. No information was provided on precipitation sample collection or analyses.
5. Data Acquisition Materials and Methods:
Site Description:
Stream water sampling was performed along three streams from their headwaters in remnant mature forests, through pastures, secondary forests, and large fertilized fields of soybean, rice and corn in the Paragominas
region of northeast Para state, in the eastern Brazilian Amazonia. The three catchments are:
- Igarapé Cinquenta e Quatro (sampling site IG54 in data file #1) with 13,698 ha
- Igarapé do Sete (sampling site IG7 in data file #1), with 16,143 ha
- Igarapé Pajeú (sampling site IGP in data file #1), with 3,246 ha
To better quantify the hydrochemistry under fully forested conditions, two streams approximately 100 km distance from Paragominas were also sampled. These catchments contribute to the Arauaí River in Capitão Poço municipality (sampling sites CP1 and CP2 in data file #1). The two streams are within a working ranch that has been managed according to Brazilian laws and thus has retained a 3,700 ha segment of unharvested mature forest.
All sample handling and analysis were the same as for the three streams in Paragominas. The watershed area for these forested streams are much smaller (<20 ha) but are characterized by similar geologic and pedogenic history (Figueiredo et al., 2010).
Field Sampling:
Sample points, which were determined by issues of accessibility due to privately held land, were identified at five locations on IG54, seven locations on IG7, and three locations on IGP. Stream water grab samples were collected in previously acid washed 250-ml polypropylene bottles. No preservatives were used in the collection vessels. Bottles were filled to capacity to minimize headspace and were placed in cold storage (~4 degrees C) within a few hours of collection. Samples were filtered
in the field through 0.4 um polycarbonate filters (Millipore) and stored at 4 degrees C until analyses for the other chemical constituents in an EMBRAPA laboratory in the city of Belem, 300 km distance from Paragominas. All sample handling was the same for the two streams located approximately 100 km from
the three Paragominas catchment sites. No information was provided on precipitation sample collection.
Field Measurement:
At the time of sample collection, turbidity, pH, temperature, and dissolved oxygen were measured in situ by, respectively, a turbidity meter (Hanna, model HI93793), and a pH, temperature and oxygen meter (WTW, model Multiline P3). In a field laboratory in Paragominas, and after conductivity measurement (conductivity meter
VWR, model L702674), the samples were analyzed for alkalinity by endpoint titrations with 1 mM HCl to pH 4.5.
Streamflow Measurements:
Stream discharge was estimated monthly at a subset of sampling locations from July 2004 to June 2005 by measuring cross sectional area and flow with a current meter (General Oceanic). This measurement was done at
the most downstream sampling stations in each stream for which a good cross section could be obtained (IG54-5, IG7-6 and IGP-2).
Chemical Analyses:
In the laboratory the samples were analyzed for dissolved organic carbon (DOC), dissolved inorganic carbon (DIC), and total dissolved nitrogen (TDN) by combustion (Shimadzu TOC V CSN), and Cl, SO4, NO3, PO4, Ca, Mg, K, Na, and NH4, by ion chromatography (Dionex DX-120).
Dissolved organic nitrogen (DON) was obtained by the difference between TDN and the sum of NO3 and NH4.
All analyses were the same for the samples from the two streams located approximately 100 km from the three Paragominas catchment sites. No information was provided on precipitation sample analyses.
Gas Analysis:
For C02 the water samples were collected from 20 cm below the stream surface using 60 cc
syringes. Syringes were transported to a field laboratory. 30 mL of water was injected into a serum bottle with 30 mL of CO2-free air and incubated in a water bath for gas and liquid phases to come into equilibrium. Headspace CO2 concentration was determined using LiCor IRGA. The CO2 in the original
streamwater sample was calculated, adjusting for temperature (Henry's law), acidity (bicarbonate chemistry), and correcting for fugacity.
6. Data Access:
This data is available through the Oak Ridge National Laboratory (ORNL) Distributed Active Archive Center (DAAC).
Data Archive Center:
Contact for Data Center Access Information:
E-mail: uso@daac.ornl.gov
Telephone: +1 (865) 241-3952
7. References:
Figueiredo, Ricardo O.; Markewitz, Daniel; Davidson, Eric Atlas; Schuler, Azeneth Eufrasino; Watrin, Orlando dos Santos; Silva, Patricio de Sousa, 2010, Land-use effects on the chemical attributes of low-order streams in the eastern Amazon, J. Geophys. Res., 115, GO4004, doi:10.10292009JG001200.
Related Publications
- Davidson, Eric Atlas ; Figueiredo, Ricardo O. ; Markewitz, Daniel ; Aufdenkampe, AK. Dissolved CO2 in Small Catchment Streams of Eastern Amazonia: A Minor Pathway of Terrestrial Carbon Loss. Journal of Geophysical Research, 2010 (in press).
- Markewitz, D., R.O. Figueiredo, and E. Davidson. 2006. CO2-driven cation leaching after tropical forest clearing. Journal of Geochemical Exploration 88(1-3):214-219. [LBA-ECO Pub ID # 915]
- Markewitz, Daniel ; Resende, Julio Carlos Franca ; Parron, Lucilia ; Bustamante, Mercedes ; Klink, Carlos A ; Figueiredo, Ricardo de Oliveira ; Davidson, Eric Atlas . Dissolved rainfall inputs and streamwater outputs in an undisturbed watershed on highly weathered soils in the Brazilian Cerrado. Hydrological Processes, v. 20, n. 12, p. 2615-2639, 2006.
- Markewitz, Daniel ; Davidson, Eric Atlas ; Figueiredo, Ricardo de Oliveira ; Victoria, Reynaldo L ; Krusche, Alex Vladimir . Control of cation concentrations in stream waters by surface soil processes in an Amazonian watershed. Nature (London), England, v. 410, p. 802-805, 2001.