Get Data
Summary:
This data set provides the results of (1) synoptic streamwater sampling and analyses from numerous sites across Rondonia and (2) corresponding watershed characteristics derived from remote sensing and Brazilian data sources.
Sixty streams, in both forested and non-forested locations, were sampled once during the dry season in August of 1998 and 49 of the same streams were sampled again during the wet season in January-February of 1999. Analyses included sodium (Na), calcium (Ca), magnesium (Mg), potassium (K), silica (Si), chloride (Cl), sulfate, pH, and acid neutralizing capacity.
Watershed characteristics, including soil cation content, pH, watershed lithology, area, percent deforested, and urban watershed population density, were derived from digitized soil maps and soil profile data, digitized topographic maps, land use mosaics from Landsat Thematic Mapper (TM) images, and Brazilian census data.
The objective of the study was to determine the relative influence of watershed soil exchangeable cation content, rock type, deforestation, and urban population density on stream concentrations of base cations, dissolved silicon, chloride and sulfate in both the dry and wet seasons in a humid tropical region undergoing regional land use transformation. There are three comma-delimited data files with this data set.
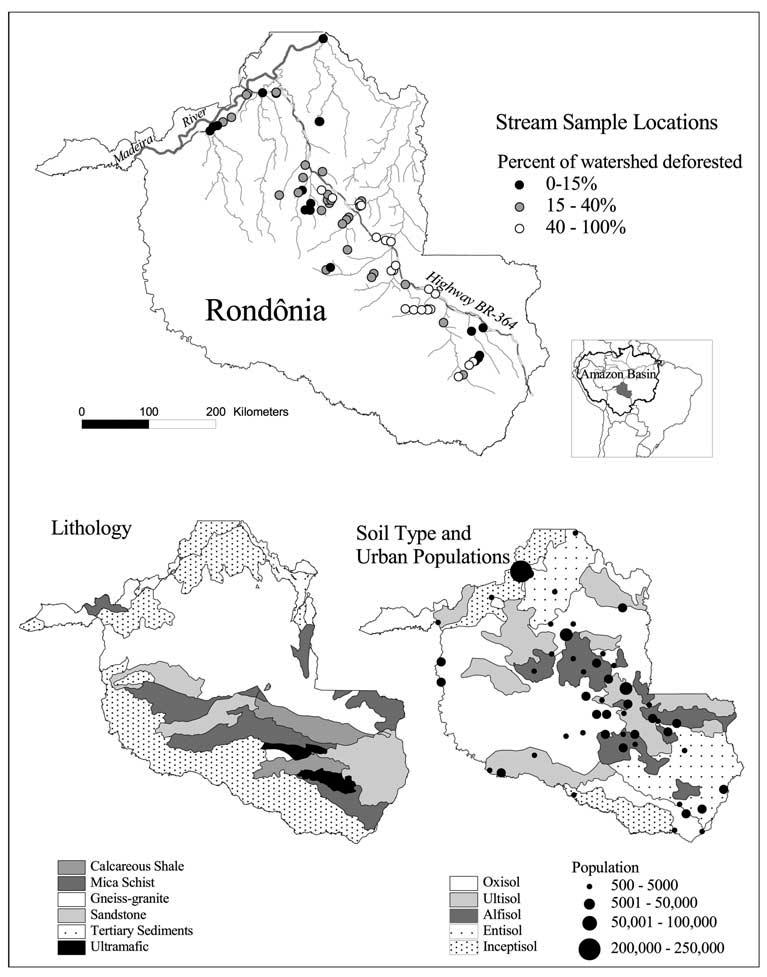
Figure 1. Watershed stream sampling locations (Biggs et al., 2002).
Data Citation:
Cite this data set as follows:
Biggs, T.W., T. Dunne, T.F. Domingues, and L.A. Martinelli. 2012. LBA-ECO ND-01 Streamwater and Watershed Characteristics, Rondonia, Brazil: 1998-1999. Data set. Available on-line (http://daac.ornl.gov)from Oak Ridge National Laboratory Distributed Active Archive Center, Oak Ridge, Tennessee, U.S.A. http://dx.doi.org/10.3334/ORNLDAAC/1119
Implementation of the LBA Data and Publication Policy by Data Users:
The LBA Data and Publication Policy (http://daac.ornl.gov/LBA/lba_data_policy.html) is in effect for a period of five (5) years from the date of archiving and should be followed by data users who have obtained LBA data sets from the ORNL DAAC. Users who download LBA data in the five years after data have been archived must contact the investigators who collected the data, per provisions 6 and 7 in the Policy.
This data set was archived in September of 2012. Users who download the data between September 2012 and August 2017 must comply with the LBA Data and Publication Policy.
Data users should use the Investigator contact information in this document to communicate with the data provider. Alternatively, the LBA website (http://lba.inpa.gov.br/lba/) in Brazil will have current contact information.
Data users should use the Data Set Citation and other applicable references provided in this document to acknowledge use of the data.
Table of Contents:
- 1 Data Set Overview
- 2 Data Characteristics
- 3 Applications and Derivation
- 4 Quality Assessment
- 5 Acquisition Materials and Methods
- 6 Data Access
- 7 References
1. Data Set Overview:
Project: LBA (Large-Scale Biosphere-Atmosphere Experiment in the Amazon)
Activity: EOS Amazon Project (EOSAP)and LBA-ECO
LBA Science Component: Nutrient Dynamics
Team ID: ND-01 (Chadwick / Roberts / Batista)
TThe investigators were Chadwick, Oliver A.; Roberts, Dar A.; Batista, Getulio T.; Biggs, Trent W.; Holmes, Karen W.; Monteiro, Andre L.; Numata, Izaya; Souza Jr., Carlos Moreira de and Tomasella, Javier. You may contact Biggs, Trent W. (tbiggs@mail.sdsu.edu).
LBA Data Set Inventory ID: ND01_Stream_Chemistry
This data set provides the results of (1) synoptic streamwater sampling and analyses from numerous sites across Rondonia and (2) corresponding watershed characteristics derived from remote sensing and Brazilian data sources.
Sixty streams, in both forested and non-forested locations, were sampled once during the dry season in August of 1998 and 49 of the same streams were sampled again during the wet season in January-February of 1999. Analyses included sodium (Na), calcium (Ca), magnesium (Mg), potassium (K), silica (Si), chloride (Cl), sulfate, pH, and acid neutralizing capacity.
Watershed characteristics, including soil cation content, pH, watershed lithology, area, percent deforested, and urban watershed population density, were derived from digitized soil maps and soil profile data, digitized topographic maps, land use mosaics from Landsat Thematic Mapper (TM) images, and Brazilian census data.
The objective of the study was to determine the relative influence of watershed soil exchangeable cation content, rock type, deforestation, and urban population density on stream concentrations of base cations, dissolved silicon, chloride and sulfate in both the dry and wet seasons in a humid tropical region undergoing regional land use transformation.
2. Data Characteristics:
Data are provided in three ASCII comma-separated files:
File #1: ND01_Dry_season_Stream_solutes_Rondonia.csv
File #2: ND01_Wet_season_Stream_solutes_Rondonia.csv
File #3: ND01_Watershed_Characterization_Rondonia.csv
File1: ND01_Dry_season_Stream_solutes_Rondonia.csv
| Column | Heading | Units/format | Description |
|---|---|---|---|
| 1 | Watershed_ID | Watershed identification code. F indicates forested watersheds. There were 60 sampling sites; each stream sampled had only 1 sampling site | |
| 2 | Sample_date | YYYYMMDD | Sampling date |
| 3 | Latitude | decimal degrees | Latitude of sampling location in decimal degrees: negative values indicate S |
| 4 | Longitude | decimal degrees | Longitude of sampling location in decimal degrees: negative values indicate W |
| 5 | NNa | umol/L | Streamwater sodium concentration in micromoles per liter (umol/L) |
| 6 | Ca | umol/L | Streamwater calcium concentration in micromoles per liter (umol/L) |
| 7 | Mg | umol/L | Streamwater magnesium concentration in micromoles per liter (umol/L) |
| 8 | K | umol/L | Streamwater potassium concentration in micromoles per liter (umol/L) |
| 9 | Si | umol/L | Streamwater silica concentration in micromoles per liter (umol/L) |
| 10 | Cl | umol/L | Streamwater chloride concentration in micromoles per liter (umol/L) |
| 11 | SO4 | umol/L | Streamwater sulfate concentration in micromoles per liter (umol/L) |
| 12 | ANC | ueq/L | Streamwater acid neutralizing capacity measured via titration and reported in microequivalents per liter (ueq/L) |
| 13 | pH | Streamwater pH | |
| Missing data are represented by -9999 | |||
Example data records
|
Watershed,Sample_date,Latitude,Longitude,Na,Ca,Mg,K,Si,Cl,SO4,ANC,pH
F1,19980819,-9.242,-64.326,-9999,3,2.1,6.2,12.9,5.1,4.1,36.9,5.8 F2,19980821,-9.188,-62.948,11.1,3.1,2.7,5.6,2.2,5.5,2,26.5,-9999 ... 16,19980803,-10.294,-63.061,119,72.2,49.5,88.1,330.1,12,3.5,437.9,7.3 17,19980819,-9.31,-64.43,-9999,3.8,1.8,5.9,58.9,4,4.1,41,6.2 ... 68,19980806,-11.451,-61.447,352.9,160.5,124.4,133.3,456.8,101.9,9.8,958.2,7.1 69,19980819,-8.81,-63.917,173,46.2,13.3,45.8,61.7,132.4,34.1,200.7,6.4 |
File 2: ND01_Wet_season_Stream_solutes_Rondonia.csv
| Column | Heading | Units/format | Description |
|---|---|---|---|
| 11 | Watershed_ID | Watershed identification code. F indicates forested watersheds. 49/60 sites were sampled in the wet season | |
| 2 | Sample_date | YYYYMMDD | Sampling date |
| 3 | Latitude | decimal degrees | Latitude of sampling location in decimal degrees: negative values indicate S |
| 4 | Longitude | decimal degrees | Longitude of sampling location in decimal degrees: negative values indicate W |
| 5 | Na | umol/L | Streamwater sodium concentration in micromoles per liter (umol/L) |
| 6 | Ca | umol/L | Streamwater calcium concentration in micromoles per liter (umol/L) |
| 7 | Mg | umol/L | Streamwater magnesium concentration in micromoles per liter (umol/L) |
| 8 | K | umol/L | Streamwater potassium concentration in micromoles per liter (umol/L) |
| 9 | Si | umol/L | Streamwater silica concentration in micromoles per liter (umol/L) |
| 10 | Cl | umol/L | Streamwater chloride concentration in micromoles per liter (umol/L) |
| 11 | SSO4 | umol/L | Streamwater sulfate concentration in micromoles per liter (umol/L) |
| 12 | ANC | ueq/L | Streamwater acid neutralizing capacity measured via titration and reported in microequivalents per liter (ueq/L) |
| 13 | pH | Streamwater pH | |
| Missing data are represented by -9999 | |||
Example data records
|
Watershed,Sample_date,Latitude,Longitude,Na,Ca,Mg,K,Si,Cl,SO4,ANC,pH F1,19990208,-9.242,-64.326,9.9,4.4,1.8,2.3,11.7,2.4,2.6,36.3,-9999 F5,19990201,-12.42,-60.803,20.1,24.3,31.7,37.4,190.2,6,1.8,156.1,-9999 ... 17,19990208,-9.31,-64.43,10,4.9,1.8,2.4,19.8,2.3,4.6,17.6,-9999 23,19990206,-9.478,-63.099,19.7,12,7.9,21.8,62.4,3.1,2.2,87.8,-9999 ... 67,19990203,-11.715,-61.765,188.8,105.6,81.7,103,307.7,51.4,5.1,-9999,-9999 69,19990209,-8.81,-63.917,55.1,20.6,7.4,14,49.7,40,3.3,59.2,-9999 |
File 3: ND01_Watershed_Characterization_Rondonia.csv
| Column | Heading | Units/format | Description |
|---|---|---|---|
| 11 | Watershed_ID | Watershed identification code. F indicates forested watersheds | |
| 2 | Latitude | decimal degrees | Sampling point latitude in decimal degrees |
| 3 | Longitude | decimal degrees | Sampling point longitude in decimal degrees |
| 4 | Area | km2 | Watershed area in square kilometers |
| 5 | Defor | % | Percent of watershed area classified as deforested |
| 6 | Urban | persons per km2 | Number of persons living in urban areas in the watershed divided by total watershed area |
| 7 | Na | kmol/ha | Soil cation contents - Sodium in kmol/ha upper 1.3 m |
| 8 | Ca | kmol/ha | Soil cation contents - Calcium in kmol/ha upper 1.3 m |
| 9 | Mg | kmol/ha | Soil cation contents - Magnesium in kmol/ha upper 1.3 m |
| 10 | K | kmol/ha | Soil cation contents -Potassium in kmol/ha upper 1.3 m |
| 11 | TZ | kmol/ha | Soil exchangable cation content calculated as the sum of Na, Ca, Mg and K contents |
| 12 | Soil_pH | pH units | Soil pH |
| 13 | AR | Fraction of watershed area consisting of rock type: arenties (AR) | |
| 14 | TS | Fraction of watershed area consisting of rock type: tertiary sediments (TS) | |
| 15 | GN | Fraction of watershed area consisting of rock type: gneiss (GN) | |
| 16 | GR | Fraction of watershed area consisting of rock type: granite (GR) | |
| 17 | BSC | Fraction of watershed area consisting of rock type: ultramafic rock | |
| 18 | CLC | Fraction of watershed area consisting of rock type: calcareous shale (CLC) | |
| 19 | MS | Fraction of watershed area consisting of rock type: mica schist | |
Example data records
|
Watershed_ID,Latitude,Longitude,Area,Defor,Urban,Na,Ca,Mg,K,ANC,Soil_pH, AR,TS,GN,GR,BSC,CLC,MS F1,-9.242,-64.326,834,2,0,2.3,41,19,9,72,4.5, 0.13,0,0.01,0.87,0,0,0 F2,-9.188,-62.948,279,4,0,2,45,21,12,80,4.5, 0,0,0.58,0.42,0,0,0 ... 16,-10.294,-63.061,37,14,0,2.8,435,112,34,583,5.5,0,0,1,0,0,0,0 17,-9.31,-64.43,19,15,0,1.9,36,14,7,59,4.4,0,0,0,0.86,0,0,0 ... 61.447,87,66,450,1.6,236,69,21,328,4.1,0,0,0.71,0.12,0,0.17,0 69,-8.81,-63.917,24,58,499,2.5,40,21,9,73,4.5,0,0.06,0,0.94,0,0,0 |
Site boundaries: (All latitude and longitude given in decimal degrees)
| Site (Region) | Westernmost Longitude | Easternmost Longitude | Northernmost Latitude | Southernmost Latitude | Geodetic Datum |
|---|---|---|---|---|---|
| Rondonia, Brazil | -64.43 | -60.701 | -8 | -12.63 | World Geodetic System, 1984 (WGS-84) |
Time period
- The data set covers the period 1998/08/02 - 1999/01/28
- Temporal Resolution: semi-annual (two different 2-week periods, wet and dry seasons)
Platform/Sensor/Parameters measured include:
- FIELD INVESTIGATION / ANALYSIS / DISSOLVED SOLIDS
- FIELD INVESTIGATION / ANALYSIS / CALCIUM
- FIELD INVESTIGATION / ANALYSIS / POTASSIUM
- FIELD INVESTIGATION / ANALYSIS / NITRATE
- FIELD INVESTIGATION / ANALYSIS / SULFATE
- FIELD INVESTIGATION / LANDSAT TM (LANDSAT THEMATIC MAPPER) / WATERSHED CHARACTERISTICS
- FIELD INVESTIGATION / ANALYSIS / BIOGEOCHEMISTRY
- FIELD INVESTIGATION / ANALYSIS / SEDIMENT TRANSPORT
- FIELD INVESTIGATION / ANALYSIS / SEDIMENT CHEMISTRY
- FIELD INVESTIGATION / ANALYSIS / WATER ION CONCENTRATION
3. Data Application and Derivation:
These data in combination with rainfall and stream flow data provide essential information to help quantify the effect of soil type, rock type, deforestation extent and urban population density on stream solute dynamics.
4. Quality Assessment:
Eighty-seven percent of dry season samples and 76% of wet season samples had <10% error in cation-anion balance, and samples in both seasons had high correlation between total cations and total anions (r2 = 0.98 dry season, 0.94 wet season).
5. Data Acquisition Materials and Methods:
Site description:
The Brazilian State of Rondonia lies in the southwestern Amazon basin on the Brazilian craton, which has a basement of pre-Cambrian gneiss. Plutons dominated by biotite-amphibole granites, quartz syenites and quartz monzonites intrude into the craton throughout the state's center (27% of the sampled catchments area). Tertiary sediments overlie the craton in the north. In the southeastern part of the state, carbonate shale with interbedded sandstone covers 3.5% of the study area, and white quartz sandstone with no carbonates cover 20% (CPRM 1997). Mica-schist and localized intrusions of gabbro cover 3.7% and 2.8% of the study area, respectively, also in the southeast. The Tertiary sediments form a dissected plain, with elevations between 60 and 160 m. On the craton, topography is gently undulating (average slopes 2 to 5%) with occasional rocky hills and small massifs up to 600m in elevation (RADAMBRASIL, 1978). Hillslopes range between 590 to 1200 m long (Ballantine, 2001), which is typical of humid tropical areas with low relief and dense vegetation cover (Moglen et al., 1998).
Soil types in the state include Oxisols (as described by Natural Resources Conservation Service (NRCS)(1999)), Latossolo distrofico in the Brazilian Soil Classification System, (Camargo et al., 1987)), Entisols (Solos Aluvias Distroficos) and Inceptisols (Cambissolos) in the north on the Tertiary sediments. Oxisols, Ultisols (Podzolico distrofico) and Alfisols (Solos eutroficos) occur on the craton, and Entisols (Areias Quartzosas Distroficas) on white quartz sands in the southeast (EMBRAPA, 1983).
Rainfall in the study area averages 1930 to 2690 mm/yr with a distinct wet season lasting from October to April, and average runoff ranges from 563 to 926 mm/yr. The streams of the state are dilute, with total cations ranging from 126 to 243 meq/L for the Jamari and Jiparana rivers (Mortatti et al., 1992), compared to 200 to 450 meq/L for other streams on siliceous terrain in the Amazon basin and up to 422 meq/L for the Amazon main stem at Obidos (Stallard,1983). Dissolved silicon and bicarbonate comprise between 74 and 80% of total dissolved solids by mass. Calcium and sodium are the dominant cations, ranging between 26 and 35% (Ca) and 22 and 39% (Na) of total cations on an equivalent basis (Mortatti et al., 1992).
The undisturbed vegetation includes dense tropical rain forest (Floresta Densa, 17% of Rondonia state area) similar to that found in the central Amazon basin and open moist tropical forest (Floresta Ombrofila Aberta, 61% of state area), which is often dominated by palms and has a more open canopy than dense tropical rain forest (RADAMBRASIL,1978). Savannas are present but limited, covering up to 5 to 8% of 3 catchments in the southeast.
The first modern wave of colonization in Rondonia began in the early 1970s. By 1998, 53,275 km2, or 22% of the State's area had been deforested, representing 9.6% of the deforested area of the Amazon Basin (INPE, 2000). Land use has been dominated by replacement of forest with grassland for cattle ranching (Pedlowski et al., 1997). Up to 50% of the cleared area is in some stage of regrowth (Pedlowski et al., 1997; Rignot et al., 1997)
Stream Sampling and Analysis
Stream water samples were collected at 60 different sites (forested and non-forested) in the dry season (August 1998) and at 49 different sites in the wet season (late January through early February 1999). Each stream was sampled only once along its course, so each sample is an independent sample.
The pH and conductivity were measured on the unfiltered samples using an Orion 250A pH meter and an Orion 115 conductivity meter. The samples were then filtered in the field with Gelman GFF 0.7 um filters, kept at 4 degrees C and then frozen prior to transport from the state for analysis.
Cations were analyzed by flame atomic absorption spectrometry (Varian model AA6), dissolved silica by the colorimetric acid-molybdate method, acid-neutralizing capacity (ANC) by Gran-titration (Stumm and Morgan,1981), and chloride, nitrate and sulfate by ion chromatography (Dionex model DX500).
Watershed Characterization
Watershed landuse classification
Watershed boundaries were digitized into a geographic information system using 1:100,000 scale topographic maps and the coordinates of collection points recorded in the field with a global positioning system (Biggs et al., 2002). Land use was determined from a mosaic of eight Landsat Thematic Mapper (TM) images from 1996 classified using spectral mixture analysis (SMA) as described by Roberts et al. (1998). Spectral end-members for soil, shade, nonphotosynthetic vegetation, and green vegetation were selected from the image to generate end-member fraction images. Training areas were then selected to develop a decision classification tree that used end-member fraction values to assign pixels to one of five categories: pasture, regenerating forest, mature forest, urban/bare and water.
Natural grasslands were classified manually via image interpretation. Due to the difficulty of spectrally separating pasture from regenerating vegetation, the designation 'deforested' for this study includes both pasture and regenerating vegetation. This definition represents a complex mosaic of clearings of different ages and regenerating forest in various stages of regrowth as recognized by SMA and includes no information about the successional status of vegetation in the watershed.
Watershed Soils and Lithology
Soil exchangeable cation contents were calculated for each watershed from digitized soil maps and soil profile analyses from the Sigteron project (Cochrane, 1998). The methodology used in the Sigteron project delineates soil terrain units that contain 'a distinctive, often repetitive, pattern of landform, lithology, surface form, slope, parent material, and soil.' (FAO, 1993). Each soil-terrain unit is assigned multiple soil types and the percentage cover of each soil type within the unit. The soil exchangeable cation content for a given watershed and cation is calculated as a weighted average of the soil exchangeable cation contents for each soil type
The percent of each watershed covered by each of 24 different lithologies was calculated using a 1:1,000,000 geologic map from CPRM (1997). The 24 different rock types were aggregated into groups of pre-Cambrian gneiss, biotite-amphibole granitic intrusions, carbonate shale, arenitic sandstone with no carbonates, Tertiary sediments, mica-schist, and mafic rocks. These groups were further aggregated into acid lithology (gneiss, granite, sandstone, Tertiary sediments) and basic lithology (mica-schist, mafic rocks, and carbonate shale).
Urban Population Density of Watersheds
Urban population density was calculated as the number of persons living in urban areas in the catchment divided by watershed area to yield urban population/km2. The urban population included all persons living in areas designated as urban by the IBGE in the 1996 census.
6. Data Access:
This data is available through the Oak Ridge National Laboratory (ORNL) Distributed Active Archive Center (DAAC).
Data Archive Center:
Contact for Data Center Access Information:
E-mail: uso@daac.ornl.gov
Telephone: +1 (865) 241-3952
7. References:
Ballantine, J. A. 2001. The response of groundwater flow to topography and
deforestation in humid tropical regions, M.A. thesis, Department of Geography,
Univ. of Calif., Santa Barbara.
Biggs, T.W., T. Dunne, T.F. Domingues, and L.A. Martinelli. 2002. Relative influence of natural watershed properties and human disturbance on
stream solute concentrations in the southwestern Brazilian Amazon basin. Water Resources Research 38(8).
Camargo, M. N., E. Klamt, and J. H. Kauffman,. 1987. Sistema Brasileiro de
Classificacao de Solos, Separata B. Inf. Soc. Bras. Ci. Solo Campinas,
12: 11-33.
Cochrane, T. T., Sigteron: Sistema de Informac¸a˜o geogra´fica paras os terrenos
e solos do estado de Rondoˆnia, Brasil, Porto Velho, Tecnosolo/
DHV Consultants BV, 1998.
CPRM.1997. Mapa Geologico do Estado de Rondonia, Ministerio de Minas e Energia, Porto Velho,Brazil.
EMBRAPA. 1983. Mapa de Levantamento de Reconhecimento de Media Intensidade dos Solos do Estado de Rondonia, Porto Velho, Brazil.
INPE. 2000. Monitoring of the Brazilian Amazonian forest by satellite, 1998-1999, Sao Jose dos Campos, Brazil.
Moglen, G. E., E. A. B. Eltahir, and R. L. Bras, 1998. On the sensitivity of drainage density to climate change, Water Resour. Res., 34: 855-862.
Mortatti, J., J. L. Probst, and J. R. Ferreira. 1992. Hydrological and geochemical characteristics of the Jamari and Jiparana River basins (Rondonia, Brazil), GeoJ., 26: 287-296.
NRCS. 1999. Soil Taxonomy: A Basic System of Soil Classification for Making and Interpreting Soil Surveys, 2nd ed., U.S. Dep. of Agric., Washington, D.C.
Pedlowski, M. A., V. H. Dale, E. A. T. Matricardi, and E. P. da Silva Filho. 1997. Patterns and impacts of deforestation in Rondonia, Brazil, Landscape Urban Plann., 38: 149-157.
RADAMBRASIL. 1978. Levantamento de recursos naturais, Ministerio das Minas e Energia, Dep. Nac. de Producao Miner., Rio de Janeiro, Brazil.
Rignot, E., W. A. Salas, and D. L. Skole.1997. Mapping deforestation and secondary growth in Rondonia, Brazil, using imaging radar and thematic mapper data, Remote Sens. Environ., 59: 167-179.
Roberts, D. A., G. T. Batista, J. L. G. Pereira, E. Waller and B. W. Nelson, Change identification using multitemporal spectral mixture analysis: Applications in eastern Amazonia, in Remote Sensing Change Detection: Environmental Monitoring Methods and Applications, edited by R. S. Lunetta and C. D. Elvidge, pp. 137– 161, Ann Arbor Press, Chelsea, Mich., 1998.
Stallard, R. F. 1983. Geochemistry of the Amazon, 2, The influence of geology and weathering environment on the dissolved load, J. Geophys. Res., 88: 9671-9688
Stumm,W., and J. J. Morgan, Aquatic Chemistry, 541 pp., John Wiley, New York, 1981.