Revision date: April 4, 2012
|
Please read this important note regarding the differences of the recently released “LBA-ECO LC-07 Wetland Extent, Vegetation, and Inundation: Lowland Amazon Basin” data set from previously released and now superseded “LBA-ECO LC-07 JERS-1 SAR Wetlands Masks and Land Cover, Amazon Basin: 1995-1996” data set. The newly released “Wetland Extent” data set has the same input products and temporal extent as the previous “Wetlands Masks and Land Cover” data set, but a much larger spatial range and an improved land cover classification. If users subset the central Amazon basin portion of the new “Lowland Amazon Basin” data set, they will get an improved version of the old data set. Also note that if you have previously downloaded the Amazon Basin Wetlands Mask: LBA_Amaz_Wtld_Mask_3arcsec.tif product from “LBA-ECO LC-07 JERS-1 SAR Wetlands Masks and Land Cover, Amazon Basin: 1995-1996” data set, the product was a beta version and its use should be discontinued. The authors recommend use of “Wetland Extent” products for all analyses. |
Summary
This data set provides three Amazon Basin wetland image products: (1) a Central Amazon Wetlands Mask, (2) a Central Amazon Wetlands Vegetative-hydrologic Land Cover Map, and (3) an Amazon Basin Wetlands Mask. All three were derived from the Global Rain Forest Mapping Project (GRFM) dry and wet season mosaics (August-September 1995 and May-August 1996) of the Japanese Earth Resources Satellite-1 (JERS-1) Synthetic Aperture Radar (SAR) imagery data (Rosenqvist et al., 2000 and Chapman et al., 2001). There are 6 GeoTIFF image files with this data set.
Data Citation:
Cite this data set as follows:
Hess, L.L., J.M. Melack, E.M.L.M. Novo, C.C.F. Barbosa, and M. Gastil. 2012. LBA-ECO LC-07 JERS-1 SAR Wetlands Masks and Land Cover, Amazon Basin: 1995-1996. Data set. Available on-line [http://daac.ornl.gov] from Oak Ridge National Laboratory Distributed Active Archive Center, Oak Ridge, Tennessee, U.S.A. http://dx.doi.org/10.3334/ORNLDAAC/1079
Implementation of the LBA Data and Publication Policy by Data Users:
The LBA Data and Publication Policy [http://daac.ornl.gov/LBA/lba_data_policy.html] is in effect for a period of five (5) years from the date of archiving and should be followed by data users who have obtained LBA data sets from the ORNL DAAC. Users who download LBA data in the five years after data have been archived must contact the investigators who collected the data, per provisions 6 and 7 in the Policy.
This data set was archived in April of 2012. Users who download the data between April 2012 and March 2017 must comply with the LBA Data and Publication Policy.
Data users should use the Investigator contact information in this document to communicate with the data provider. Alternatively, the LBA website [http://lba.inpa.gov.br/lba/] in Brazil will have current contact information.
Data users should use the Data Set Citation and other applicable references provided in this document to acknowledge use of the data.
Table of Contents:
- 1 Data Set Overview
- 2 Data Characteristics
- 3 Applications and Derivation
- 4 Quality Assessment
- 5 Acquisition Materials and Methods
- 6 Data Access
- 7 References
1. Data Set Overview:
Project: LBA (Large-Scale Biosphere-Atmosphere Experiment in the Amazon)
Activity: LBA-ECO
LBA Science Component: Land Use and Land Cover
Team ID: LC-07 (Melack / Novo / Forsberg)
The investigators were Melack, John M.; Novo, Evlyn Marcia Leao de Moraes; Barbosa, Claudio; Hess, Laura and Gastil-Buhl, Mary. You may contact Hess, Laura (lola@icess.ucsb.edu) and Gastil-Buhl, Mary (mary@icess.ucsb.edu).
LBA Data Set Inventory ID: LC07_SAR_Wetland_Mask
The INPE's (Brazil’s Instituto Nacional de Pesquisas Espaciais (National Institute for Space Research)), segmentation algorithms have been applied to produce a polygon-based classification of wetlands using the Japanese Earth Resources Satellite (JERS) data. In addition, a method was developed for classifying and mapping floodplain habitats by linking multi-date Synthetic Aperture Radar (SAR) imagery with river stage records, incorporating information on both vegetation structure and inundation periodicity. The method was applied to sites in the central Amazon, resulting in a mask of wetlands versus uplands.
Related data sets:
- LBA-ECO LC-07 Monthly Mean Flooded Wetlands Habitat, Central Amazon Basin: 1979-1996
- LBA-ECO LC-07 Amazon Floodplain Lake Chlorophyll from MODIS, Para, Brazil: 2002-2003
2. Data Characteristics:
All three products were derived from the Global Rain Forest Mapping Project (GRFM) dry and wet season mosaics (August-September 1995 and May-August 1996) of the Japanese Earth Resources Satellite-1 (JERS-1) Synthetic Aperture Radar (SAR) imagery data (Rosenqvist et al., 2000 and Chapman et al., 2001).
Data characteristics of GRFM Amazon Basin mosaics from Hess et al. (2003):
| JERS-1 SAR frequency and polarization | L-band (1275 MHz), HH-pol |
| JERS-1 SAR incidence angle range | degrees |
| Mosaic pixel dimensions | 3 arcsec (approx. 100 m) |
| Acquisition period, low-water mosaic | August– September 1995 |
| Acquisition period, high-water mosaic | May–August 1996 |
| Noise equivalent | -20 to -15 dB |
| Calibration uncertainty | +/-0.2 dB |
Central Amazon Wetlands Mask: amazon_central_wetland_habitats-mask_3arcsec.tif
This product is a wetlands mask at 100-m resolution for an 18 by 8 degree quadrat of the central Amazon region (Figure 1). This wetlands mask is a binary classification denoting wetland and non-wetland areas (Figure 2).
There is one GeoTiff file for this data product.
- The image is a binary array of 21,609 columns by 9,604 rows.
- Pixel values are 1 byte and either 0 for upland or 1 for wetland. Each pixel represents an area of 3 arc seconds.
- The resolution of the product is 100 meters.
- Dimensions of the image are referenced to geographic coordinates, latitude and longitude, not a map projection.
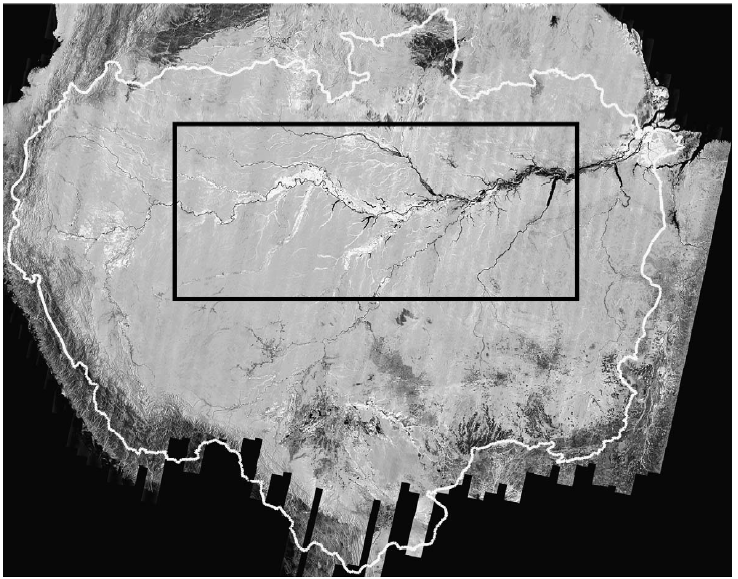
Figure 1. Global Rain Forest Mapping Project radar mosaic showing central Amazon study quadrat (black) and boundary of the Amazon basin (white). The quadrat extends from 72 W, 0 N to 54 W, 8 S.
Figure 2. Wetlands mask for the central Amazon; wetlands (white) occupy 17% of the total area. The floodplains of large seasonally inundated rivers occupy 51% of the area mapped as wetland.
Central Amazon Wetlands Vegetative-hydrologic Land Cover Map:
This product, also for the central basin, is a classification of the wetlands mask areas from the SAR mosaics into wet and dry season combinations of vegetative-hydrologic land cover states on the basis of pixel backscattering coefficients. There were 10 possible cover-state classes consisting of 5 vegetation cover classes, combined with inundation state (flooded or nonflooded) at the time of imaging.
There are four GeoTiff files of flooded and non-flooded land cover state at high and low water stages and at two resolutions, 100 meters and 3-arc second. There is a total of four GeoTiffs.
- The resolutions of the files are 100 meters and 3arc second.
- Pixel values are from 1 to 9 for the wetland habitat classes and 0 for upland.
- The coverage area is 1.77 km2
from 72 to 54 degrees west longitude and from 0 to 8 degrees south latitude.
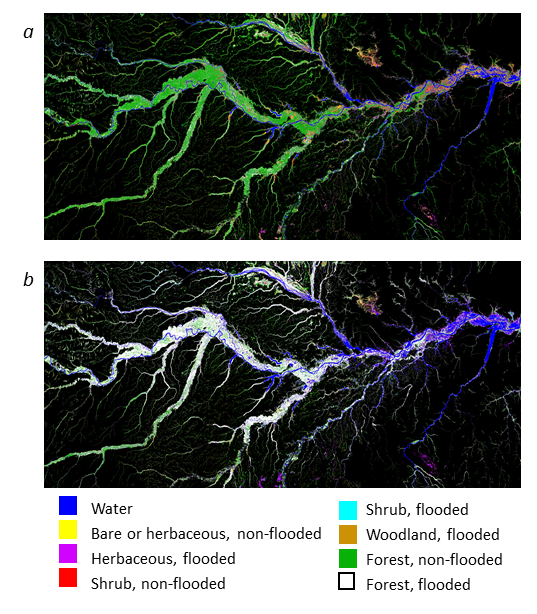
Figure 3. Mapping of wetlands vegetation and inundation cover classes at (a) low-water stage (September –October 1995), and (b) high-water stage (May–June 1996).
Image file names and spatial extents:
| Filenames |
Westernmost Longitude | Easternmost Longitude | Northernmost Latitude | Southernmost Latitude |
|---|---|---|---|---|
| amazon_central_wetland_habitats-hi_100m.tif | -72.087425 | - 53.903575 | - 0.00060 | - 8.008453 |
| amazon_central_wetland_habitats-hi_3arcsec.tif | - 71.9996 | - 53.999672 | - 0.00070 | - 8.000667 |
| amazon_central_wetland_habitats-lo_100m.tif | -72.087425 | - 53.903575 | - 0.00060 | - 8.008453 |
| amazon_central_wetland_habitats-lo_3arcsec.tif | - 71.9996 | - 53.999672 | - 0.00070 | - 8.000667 |
The images include the following values for vegetation and
inundation cover classes.
| Value | Description |
|---|---|
| 0 | Upland (masked as not floodable) |
| 1 | Open Water |
| 2 | Bare or herbaceous, non-flooded |
| 3 | Herbaceous, flooded |
| 4 | Shrub, non-flooded |
| 5 | Shrub, flooded |
| 6 | Woodland, flooded |
| 7 | Forest, non-flooded |
| 8 | Forest, flooded |
| 9 | Mixed |
Amazon Basin Wetlands Mask: LBA_Amaz_Wtld_Mask_3arcsec.tif
The third product is a wetlands mask at 100 m resolution for the entire Amazon basin (Figure 4). The lowland Amazon basin (JERS-1 SAR mosaic subset to the area less than 500 m above sea level) was processed using INPE's segmentation algorithms to produce a polygon-based classification of floodable areas resulting in a mask of wetlands versus uplands. Total floodable area within the lowland basin is about 800,000 km2, or 14% of the entire area. The actual floodable area is larger, since areas in southern Bolivia and high-altitude wetlands were not included in the the mosaic subset. Floodplains in the southwestern Brazilian Amazon were not well delineated owing to the timing of the SAR images.
There is one GeoTiff for this data product.
- The GeoTiff is a binary array of 36,000 columns by 24,000 rows.
- Pixel values are either 0 for upland or 1 for wetland.
- Each pixel represents an area of 3 arc seconds.
- Dimensions of the image are referenced to geographic coordinates, latitude and longitude, not a map projection.
Image Map Information:
- Georeferencing is done relative to the upper left hand (ULH) corner pixel. Pixel (0,0) has the coordinates of 78 W, 4 N.
- Each pixel across is spaced by 3 arc seconds. Each row is spaced by 3 arc seconds.
- The lower right hand (LRH) corner pixel has (nominally) the coordinates of 48 W, 16 S.
- Georeferencing accuracy varies across the image because it is a product created from a mosaic that had variable georeferencing accuracy and was improved in accuracy but ground control points (GCP) were unavailable in some regions.
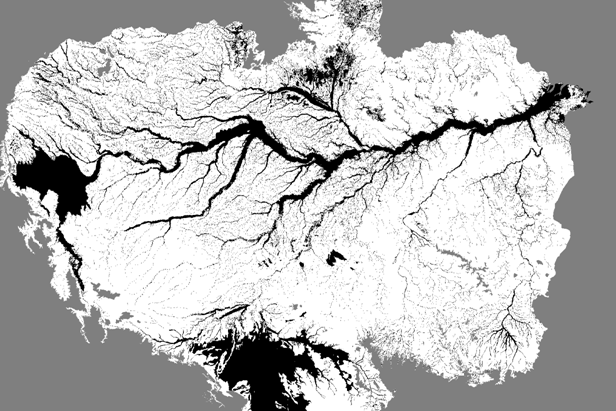
Figure 4. Floodable area (black) for Amazon basin below 500 m contour derived from JERS-1 SAR mosaic. Grey area is outside the Amazon Basin or above 500 m elevation. Floodable areas are not all inundated simultaneously. In addition, floodplains of small but very numerous low-order streams, and small interfluvial wetlands, could not be mapped at the ~100 m resolution of the SAR mosaics.
Site boundaries: (All latitude and longitude given in decimal degrees)
| Site (Region) | Westernmost Longitude | Easternmost Longitude | Northernmost Latitude | Southernmost Latitude | Geodetic Datum |
|---|---|---|---|---|---|
| Amazon Basin (Central Amazon Basin) | -72 | -54 | 0 | -8 | World Geodetic System, 1984 (WGS-84) |
| Amazon Basin (Amazon Basin) | 78 | -48 | 4 | -16 | World Geodetic System, 1984 (WGS-84) |
Time period:
- The data set covers the period 1995/09/01 to 1996/06/30
- Temporal Resolution: Quarterly
Platform/Sensor/Parameters measured include:
- JERS-1 (JAPANESE EARTH RESOURCES SATELLITE-1) / SAR (SYNTHETIC APERTURE RADAR) / LAND COVER
- JERS-1 (JAPANESE EARTH RESOURCES SATELLITE-1) / SAR (SYNTHETIC APERTURE RADAR) / LAND USE CLASSES
- JERS-1 (JAPANESE EARTH RESOURCES SATELLITE-1) / SAR (SYNTHETIC APERTURE RADAR) / INUNDATION
- JERS-1 (JAPANESE EARTH RESOURCES SATELLITE-1) / SAR (SYNTHETIC APERTURE RADAR) / WETLANDS
3. Data Application and Derivation:
Central Amazon Wetlands Mask:
The primary application of this data set is to mask upland area from images to enable analysis on only the floodable areas. Examples of work that used this mask: Melack et al. (2004) used this mask in conjunction with its derived class map to quantify methane emissions; Novo et al. (2006) applied this mask to MODIS images to detect seasonal changes in chlorophyll; Frappart et al. (2005) applied this mask over the Negro River Basin to estimate water storage; Richey et al. (2002) was first to apply this mask to estimate outgassing of CO2.
Central Amazon Wetlands Vegetative-hydrologic Land Cover Map:
SAR-based mapping provides a basis for improved estimates of the contribution of wetlands to biogeochemical and hydrological processes in the Amazon Basin.
Amazon
Basin Wetlands Mask:
The primary application of this data set is to mask upland area from images to enable analysis on only the floodable areas. Derivation:
this data set is derived from the JERS-1 GRFM mosaic of the Amazon Basin (Rosenqvist et al., 2000).
4. Quality Assessment:
Central Amazon Wetlands Mask:
Excerpt from Hess et al., 2003. Aerial videographic surveys were carried out in order to acquire data sets suitable for training of classification algorithms and assessment of classification accuracy. Each validation sample comprised a 100 x 100 m area on a VOAM97 or VOAM99 video mosaic, and the accompanying video clips. Center points of these 1-ha samples were selected by random sampling of flight times along flight tracks within the study quadrat. Nine of the 365 video samples examined could not be unambiguously labeled. Of the remaining 356 samples, 339 (95.2%) were mapped correctly on the wetlands mask. With less than 21 misclassified samples, the map therefore is accepted according to the specified standard of a less than 5% chance that the map is less than 90% accurate. The 17 misclassified samples were evenly divided between errors of commission (wrongly mapped as wetlands) and errors of omission (wrongly mapped as non-wetland). Misclassified samples were examined to determine the source of the error, and categorized as classification errors, registration errors, size-based errors, and errors related to apparent disparities in flooding between video flight and mosaic. Most errors of commission were non-wetland clearings and second growth adjacent to rivers or lakes. Registration errors involved samples within 1.5 pixels of a wetland/ non-wetland boundary, and size-based errors resulted when a land cover unit smaller than the 50-ha minimum mapping was identifiable on the videography.
Central Amazon Wetlands Vegetative-hydrologic Land Cover Map:
Excerpt from Hess et al., 2003. Validation of land-cover classifications in remote, cloudy regions is challenging. Airborne digital videography flown much of the time below cloud cover made it possible to validate the wetlands delineation and habitat mapping using independent, randomly selected samples acquired across the region. Random sampling ensured that heterogeneous and edge areas were included in the validation, giving a more realistic result than with subjectively chosen samples which tend to be biased toward homogeneous patches. The high resolution of the video samples permitted direct visual interpretation, avoiding the biases introduced when maps or classified satellite images, with unknown accuracies, are used for validation. For details on land cover validation see Hess et al., 2003.
Amazon
Basin Wetlands Mask:
The actual floodable area is larger, since areas in southern Bolivia and high-altitude wetlands were
not included in the JERS-based mapping, and floodplains in the southwestern Brazilian Amazon were not well delineated owing to the timing of the mosaics.
In addition, floodplains of small but very numerous low-order streams, and small interfluvial wetlands, could not be mapped at the ~100 m resolution of
the SAR mosaics. See Melack and Hess (2008) for more details.
5. Data Acquisition Materials and Methods:
Wetland extent was mapped for the central Amazon region, using mosaicked L-band synthetic aperture radar (SAR) imagery acquired by the Japanese Earth Resources Satellite-1 (Rosenqvist et al., 2000 and Chapman et al., 2001). For the wetland portion of the 18 x 8 degree study area, dual-season radar mosaics were used to map inundation extent and vegetation under both low-water and high-water conditions at 100 m resolution, producing the first high-resolution wetlands map for the region. Thematic accuracy of the mapping was assessed using high-resolution digital videography acquired during two aerial surveys of the Brazilian Amazon.
A polygon-based segmentation and clustering process was used to delineate wetland extent with an accuracy of 95%. A pixel-based classifier was used to map wetland vegetation and flooding state based on backscattering coefficients of two-season class combinations. The SAR-based mapping provides a basis for improved estimates of the contribution of wetlands to biogeochemical and hydrological processes in the Amazon basin, a key question in the Large-Scale Biosphere-Atmosphere Experiment in Amazonia.
Central Amazon Wetlands Mask:
The wetlands mask
at 100-m resolution for the 18 by 8 degree quadrat of
the central Amazon region was created from the JERS-1
mosaics of the Amazon Basin. This wetlands mask is a
binary
classification denoting wetland and non-wetland areas. The
INPE's (Brazil’s
Instituto Nacional de Pesquisas Espaciais (National Institute for Space Research)) segmentation algorithms were
applied to produce this polygon-based classification of wetlands (Hess
et al., 2003).
Additional acquisition materials included TM
images, topographic maps at 1:100,000 from the Instituto Brasileiro de
Geografia e Estatstica (IBGE), and digital videography. The digital
videography and how it was used in creation of the wetlands mask is
described in Hess, 2002.
Creation of this wetlands mask accomplished two goals: calculation of total wetland area and spatial distribution, and elimination of non-wetland areas from the subsequent landcover
classification of wetland areas. The wetlands mask is a precursor to the following land cover map.
Central Amazon Wetlands Vegetative-hydrologic Land Cover Map:
The second product, also for the central basin, is a classification of the wetlands mask areas in the SAR mosaics into wet and dry season combinations of vegetative-hydrologic land cover states on the basis of pixel backscattering coefficients. There were 10 possible cover-state classes consisting of 5 vegetation cover classes, combined with inundation state (flooded or nonflooded) at the time of imaging. The maps were validated using high-resolution, geocoded digital videography collected during aerial surveys at high and low-water periods (Hess et al., 2003; Hess et al., 2002). Images were derived of flooded and non-flooded land cover state at high and low water stages and at two resolutions, 100 meters and 3 arc second. The masks were validated using high-resolution, geocoded digital videography collected during aerial surveys at high and low-water periods (Hess et al., 2003; Hess et al., 2002). There are GeoTiff files of flooded and non-flooded land cover state at high and low water stages and at two resolutions, 100 meters and 3 arc second.
Amazon Basin Wetlands Mask:
To create the basin-wide wetlands mask, the same approach to delimit
floodable area as used by Hess et al. (2003) for the central Amazon
region was applied to the whole lowland Amazon basin (the region less
than 500 m above sea level) and resulted in a map of floodable
area at 100 m resolution. The lowland Amazon
basin was processed
using INPE's segmentation algorithms to
produce a
polygon-based classification resulting in a
mask of wetlands versus
uplands.
Total floodable area within the lowland
basin is
about 800,000 km2, or 14% of the entire area. The actual floodable area
is larger, since areas in southern Bolivia and high-altitude wetlands
were not included in the the mosaic subset. Floodplains in the
southwestern Brazilian Amazon were not well delineated due to the
timing of the SAR images. In addition, floodplains of small
but very numerous
low-order streams,
and small interfluvial wetlands, could not be mapped at the ~100 m
resolution of the SAR mosaics.
.
6. Data Access:
This data is available through the Oak Ridge National Laboratory (ORNL) Distributed Active Archive Center (DAAC).
Data Archive Center:
Contact for Data Center Access Information:
E-mail: uso@daac.ornl.gov
Telephone: +1 (865) 241-3952
7. References:
Chapman, B., A. Rosenqvist, and A. Wong. 2001. JERS-1 SAR Global Rain Forest Mapping Project. [JERS-1 Synthetic Aperture Radar Global Rain Forest Mapping Project]. Vol. AM-1, South America, 1995-1996. CD-ROM. National Space Development Agency of Japan, Earth Observation Research Center; National Aeronautics and Space Administration, Jet Propulsion Laboratory; European Commission Joint Research Centre; Earth Remote Sensing Data Analysis Center of Japan; Remote Sensing Technology Center of Japan; and Alaska SAR Facility. Available from Oak Ridge National Laboratory Distributed Active Archive Center, Oak Ridge, Tennessee, U.S.A. [http://daac.ornl.gov]. doi:10.3334/ORNLDAAC/582
Hess, L. L., Melack, J. M., Novo, E. M. L. M., Barbosa, C. C. F., & Gastil, M. (2003). Dual-season mapping of wetland inundation and vegetation for the Central Amazon region. Remote Sens. Environ., 87, 404-428. DOI:10.1016/j.rse.2003.04.001
Melack, J.M., L.L. Hess, M. Gastil, B.R. Forsberg, S.K. Hamilton, I.B.T. Lima, and E.M.L.M. Novo. 2004. Regionalization of methane emissions in the Amazon Basin with microwave remote sensing. Global Change Biology 10(5):530-544.
Melack, J.M. and L.L. Hess. 2008. Remote sensing of the distribution and extent of wetlands in the Amazon basin. In W.J. Junk and M. Piedade (eds.) Amazonian floodplain forests : Ecochysiology, ecology, biodiversity and sustainable management. Ecological Studies, Springer.
Richey, J.E., J.M. Melack, A.K. Aufdenkampe, V.M. Ballester, and L.L. Hess. 2002. Outgassing from Amazonian rivers and wetlands as a large tropical source of atmospheric CO2. Nature 416(6881):617-620.
Novo, E.M.L.M., C.C.D. Barbosa, R.M. de Freitas, Y.E. Shimabukuro, J.M. Melack, and W. Pereira. 2006. Seasonal changes in chlorophyll distributions in Amazon floodplain lakes derived from MODIS images. Limnology 7(3):153-161.
Hess, L.L., E.M.L.M. Novo, D.M. Slaymaker, J. Holt, C. Steffen, D.M. Valeriano, L.A.K. Mertes, T. Krug, J.M. Melack, M. Gastil, C. Holmes, and C. Hayward. 2002. Geocoded digital videography for validation of land cover mapping in the Amazon basin. International Journal of Remote Sensing 23(7):1527-1555.
Rosenqvist, A., Shimada, M., Chapman, B., & Freeman, A. 2000. The Global Rain Forest Mapping project -- a review. International Journal of Remote Sensing, 21, 1375-1387.
Frederic Frappart, Frederique Seyler, Jean-Michel Martinez, Juan G. Leon and Anny Cazenave. 2005. Floodplain water storage in the Negro River basin estimated from microwave remote sensing of inundation area and water levels, Remote Sensing of Environment, 99, 387-399.