Get Data
Summary:
This data set provides flux measurements of methane (CH4) and carbon dioxide (CO2) from surface waters to the atmosphere. It also provides CH4, CO2, and oxygen (O2) concentrations of surface water, and concentrations measured at several depths of the Balbina Reservoir in the central Amazon Basin, Amazonas, Brazil. The Balbina Reservoir was formed by impounding the Uatuma River in 1987.
Reservoir surface water samples, bottom water samples, and gas samples from static flux enclosures were collected at 10 to 14 sites at monthly intervals between April and November of 2005, and 6 times in February, 2006. Water samples to determine the vertical profiles of temperature, dissolved O2, CH4, and CO2 were collected during the rainy and dry seasons immediately above dam between September 2004 and February 2006. Water samples were collected downstream from the dam from July 2004 to November 2005 for analysis of CH4 and CO2 concentrations.
There are three comma-delimited data files with this data set.
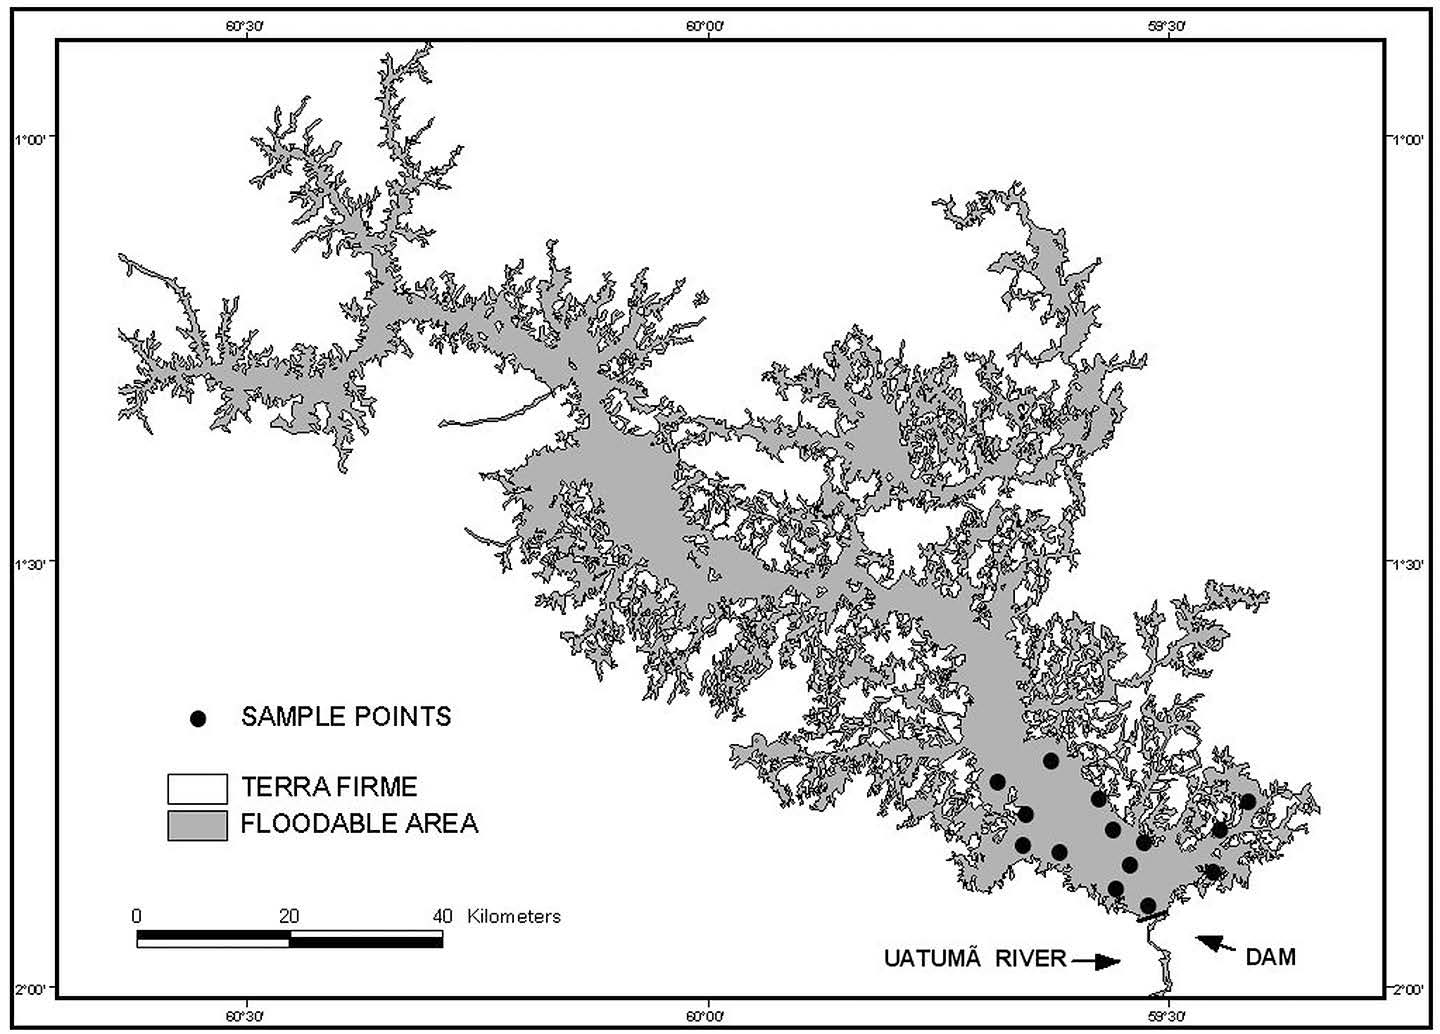
Figure 1. Balbina Reservoir showing location of the dam and reservoir sampling points (solid circles). From Kemenes et al., 2011.
Data Citation:
Cite this data set as follows:
Kemenes, A., B.R. Forsberg, and J.M. Melack. 2013. LBA-ECO LC-07 Methane and Carbon Dioxide Emissions from Balbina Reservoir, Brazil. Data set. Available on-line [http://daac.ornl.gov] from Oak Ridge National Laboratory Distributed Active Archive Center, Oak Ridge, Tennessee, USA. http://dx.doi.org/10.3334/ORNLDAAC/1143
Implementation of the LBA Data and Publication Policy by Data Users:
The LBA Data and Publication Policy [http://daac.ornl.gov/LBA/lba_data_policy.html] is in effect for a period of five (5) years from the date of archiving and should be followed by data users who have obtained LBA data sets from the ORNL DAAC. Users who download LBA data in the five years after data have been archived must contact the investigators who collected the data, per provisions 6 and 7 in the Policy.
This data set was archived in February of 2013. Users who download the data between February 2013 and January 2018 must comply with the LBA Data and Publication Policy.
Data users should use the Investigator contact information in this document to communicate with the data provider.
Data users should use the Data Set Citation and other applicable references provided in this document to acknowledge use of the data.
Table of Contents:
- 1 Data Set Overview
- 2 Data Characteristics
- 3 Applications and Derivation
- 4 Quality Assessment
- 5 Acquisition Materials and Methods
- 6 Data Access
- 7 References
1. Data Set Overview:
Project: LBA (Large-Scale Biosphere-Atmosphere Experiment in the Amazon)
Activity: LBA-ECO
LBA Science Component: Land Use and Land Cover
Team ID: LC-07 (Melack / Novo / Forsberg)
The investigators were Forsberg, Bruce R; Melack, John M.; Novo, Evlyn ; Affonso, Adriana Gomes; Albuquerque, Paulo C Gurgel; Alcantara, Enner Herenio; Alsdorf, Douglas; Arruda, Warey de Costa ; Barbosa, Claudio ; Belger, Lauren ; Carvalho, Joao Carlos; Castellari, Sueli Pissarra; Correa, Denival Silva ; Correia, Antonio; Costa, Maycira ; da Costa Freitas, Corina ; Dutra, Luciano Vieira; Elmiro, Marcos Timbo; Filho, Waterloo Pereira; Franca, Andreia Maria Silva; Freitas, Ramon Morais; Frickmann, Fernando Cruz ; Gama, Fabio Furlan; Gastil-Buhl, Mary ; Goncalves, Fabio Guimaraes; Hess, Laura Lorraine; Jardim-Lima, Dayson Jose; Kemenes, Alexandre ; Kilham, Nina ; Kramer, Marc Gerald; Lima, Ivan Bergier Tavares de; Londe, Luciana de Resende; Marshall, Bruce Gavin; Mertes, Leal ; Mura, Jose Claudio; Rudorff, Conrado de Moraes; Sant'Anna, Sidnei J.S.; Santos, Claudia Cristina dos; Santos, Joao Roberto dos; Shimabukuro, Yosio Edemir; Silva, Claudio Roberto; Silva, Thiago Sanna Freire; Titoneli, Fernanda and Vasconcelos, Cintia Honorio . You may contact Kemenes, Alexandre (alekemenes@yahoo.com.br).
LBA Data Set Inventory ID: LC07_Reservoir_GHG
This data set provides flux measurements of methane (CH4) and carbon dioxide (CO2) from surface waters to the atmosphere. It also provides CH4, CO2, and oxygen (O2) concentrations of surface water, and and concentrations measured at several depths of the Balbina Reservoir in the central Amazon Basin, Amazonas, Brazil.
Reservoir surface water samples, bottom water samples, and gas samples from static flux enclosures were collected at 10 to 14 sites at monthly intervals between April and November of 2005, and 6 times in February, 2006. Water samples to determine the vertical profiles of temperature, dissolved O2, CH4, and CO2 were collected during the rainy and dry seasons immediately above dam between September of 2004 and February of 2006. Water samples were collected downstream from the dam from July 2004 to November 2005 for analysis of CH4 and CO2 concentrations.
2. Data Characteristics:
Data are available in 3 comma separated ASCII files:
File #1: LC07_Reservoir_gas_measurements.csv
- Results of analyses of reservoir surface water samples, bottom water samples, and gas samples from static flux enclosures collected at 10 to 14 sites at monthly intervals between April and November 2005, and six times in February, 2006.
File #2: LC07_Depth_profiles_gas_measurements.csv
- Results of analyses of water samples from vertical profiles for temperature, dissolved O2, CH4, and CO2 collected during the rainy and dry seasons immediately above dam between September 2004 and February 2006.
File #3: LC07_Downstream_gas_measurements.csv
- Results of analyses of water samples collected downstream from the dam from July 2004 to November 2005 for analysis of CH4 and CO2 concentrations and flux calculations.
Data are organized as follows:
File #1: LC07_Reservoir_gas_measurements.csv
| Column | Heading | Units/format | Description | |
|---|---|---|---|---|
| 1 | Date | YYYYMMDD | Sampling date | |
| 2 | Latitude | decimal degrees S | Location of sample collection in degrees latitude south of the equator | |
| 3 | Longitude | decimal degrees W | Location of sample collection in degrees longitude west of the prime meridian | |
| 4 | Habitat | Habitat type: AA = open water; FPI = slightly inundated dead forest; FI = moderately inundated dead forest; FMI = very inundated dead forest; FQS = nearly submerged dead forest | ||
| 5 | Conc_CO2_surface | mgC/m3 | Concentration of carbon dioxide in the surface waters reported in milligrams of carbon per cubic meter of water | |
| 6 | Conc_CH4_surface | mgC/m3 | Concentration of methane in the surface waters reported in milligrams of carbon per cubic meter of water | |
| 7 | Conc_CO2_bottom | mgC/m3 | Concentration of carbon dioxide in the bottom waters reported in milligrams of carbon per cubic meter of water | |
| 8 | Conc_CH4_bottom | mgC/m3 | Concentration of methane in the bottom waters reported in milligrams of carbon per cubic meter of water | |
| 9 | Flux_CH4_funnel | mgC/m2/day | Flux of methane measured using a funnel and reported in milligrams of carbon per meter squared of surface area per day | |
| 10 | Flux_CO2_funnel | mgC/m2/day | Flux of carbon dioxide measured using a funnel and reported in milligrams of carbon per meter squared of surface area per day | |
| 11 | Flux_CH4_total | mgC/m2/day | Total flux of methane calculated from static chamber measurements | |
| 12 | Flux_CO2_total | mgC/m2/day | Total flux of carbon dioxide calculated from static chamber measurements | |
| 13 | flux_CH4_diffusive | mgC/m2/day | Diffusive flux of methane calculated by subtracting measured funnel fluxes (Column 9) from the calculated total flux value (Column 11) | |
| 14 | Flux_CO2_diffusive | mgC/m2/day | Diffusive flux of carbon dioxide calculated by subtracting measured funnel fluxes (Column 10) from the calculated total flux value (Column 12) | |
| 15 | Conc_O2_surface | mg/L | Concentration of oxygen in surface waters reported in milligrams of oxygen per liter of water | |
| 16 | Conc_O2_bottom | mg/L | Concentration of oxygen in bottom waters reported in milligrams of oxygen per liter of water | |
| 17 | T_water_surface | degrees C | Water temperature at the surface reported in degrees Celsius | |
| 18 | T_water_bottom | degrees C | Water temperature at the bottom reported in degrees Celsius | |
| 19 | Depth_water | m | Depth to the bottom of the reservoir reported in meters | |
| 20 | Transparency | m | Secchi depth transparency reported in meters |
Example data for file #1:
|
Date,Latitude,Longitude,Habitat,Conc_CO2_surface,Conc_CH4_surface,Conc_CO2_bottom,Conc_CH4_bottom, Flux_CH4_funnel,Flux_CO2_funnel,Flux_CH4_total,Flux_CO2_total,Flux_CH4_diffusive ,Flux_CO2_diffusive, Conc_O2_surface,Conc_O2_bottom,T_water_surface,T_water_bottom,Depth_water,Transparency 20050417,-1.91094,-59.50275,AA,674.2,1,823.3,3.2, 0.02,0.01,44,1365.7,44,1365.7, 6.7,4.2,30.5,29,13,3.2 20050417,-1.88869-,59.53294,FMI,534,3.2,966.2,9.9 ,0.04,0.01,124.6,2122.3,124.6,2122.3, 7.3,6.3,30.7,30,5,2.6 ... 20050705,-1.7695,-59.53499,FI,1914.6,5,2150.3,8.9, 0.35,0.01,71.4,8529.9,71.1,8529.9, 4.9,3.1,30.2,29.8,12,2.4 20050705,-1.78027,-59.5681,AA,1419.9,1.7,3116.6, 78.8,0,0,8.8,5067.8,8.8,5067.8, 6.1,0.5,30.4,29.8,15,2.4 ... 20060215,-1.90987,-59.49859,FQS,1093,4.6,2090.5,4.4,0.03, 0,87.6,343.3,87.6,343.3, 5.8,3.7,30,29,14,2.2 20060215,-1.91397,-59.50176,FI,1399.3,3.9,1743.1,4.8, 0,0,13.2,3584,13.2,3584, 6.5,2,30,29,11,2.8 |
File #2: LC07_Depth_profiles_gas_measurements.csv
| Column | Heading | Units/format | Description |
|---|---|---|---|
| 1 | Date | YYYYMMDD | Sampling date |
| 2 | Depth | m | Depth in the water column at which sample was collected reported in meters (m): AR indicates a gas sample for which depth is not applicable |
| 3 | Conc_CH4 | mgC/m3 | Concentration of methane in water sample reported in milligrams of carbon per cubic meter |
| 4 | Conc_CO2 | mgC/m3 | Concentration of carbon dioxide in water sample reported in milligrams of carbon per cubic meter |
| 5 | Conc_O2 | mg/L | Concentration of oxygen in water sample reported in milligrams of oxygen per liter |
| 6 | T_water | degrees C | Water temperature reported in degrees Celsius |
| Missing data are represented by -9999 | |||
Example data for file #2:
|
Date,Depth,Conc_CH4,Conc_CO2 ,Conc_O2 ,T_water 0040705,0,2.7,1103.7,6.8,33 20040705,2,2.9,1157.3,6.7,33 ... 20050123,6,294.2,1894.9,4.1,30 20050123,8,180.9,1742.2,4.3,30 ... 20051116,32,2854.4,6515.3,2.4,30 20051116,AR,3.4,973.4,-9999,-9999 |
File #3: File name: LC07_Downstream_gas_measurements.csv
| Column | Heading | Units/format | Description |
|---|---|---|---|
| 1 | Date | YYYYMMDD | Sampling date |
| 2 | Distance_downstream | m | Sampling location in meters downstream from the dam |
| 3 | Conc_CO2_surface | mgC/m3 | Concentration of carbon dioxide in the surface water reported in milligrams of carbon per cubic meter |
| 4 | Conc_CH4_surface | mgC/m3 | Concentration of methane in the surface water reported in milligrams of carbon per cubic meter |
| 5 | Flux_CH4 | mgC/m2/hour | Flux of methane from the surface water to the atmosphere reported in milligrams of carbon per meter squared per hour |
| 6 | Flux_CO2 | mgC/m2/hour | Flux of carbon dioxide from the surface water to the atmosphere reported in milligrams of carbon per meter squared per hour |
| 7 | Conc_O2_surface | mg/L | Concentration of oxygen in the surface water reported in milligrams of oxygen per liter |
| Missing data are represented as -9999 | |||
Example data for file #3:
|
Day,Distance_downstream ,Conc_CO2_surface,Conc_CH4_surface,Flux_CH4 ,Flux_CO2,Conc_O2_surface
20040719,50,3508.6,1405.8,-9999,-9999,4.5 20040924,50,3263,1479.6,-9999,-9999,4.4 ... 20041223,2000,2483.4,936.3,129.1,362,4.8 20041223,15000,2499.5,437.9,35.6,234.7,4.9 ... 20051113,2000,1786,517.8,193.9,415.2,-9999 20051113,30000,1597.6,315.2,26.9,241,-9999 |
Site boundaries: (All latitude and longitude given in degrees and fractions)
| Site (Region) | Westernmost Longitude | Easternmost Longitude | Northernmost Latitude | Southernmost Latitude | Geodetic Datum |
|---|---|---|---|---|---|
| Amazonas (Manaus) - Balbina (Amazonas (Manaus)) | -60.74131 | -59.16711 | -0.85903 | -1.98403 | World Geodetic System, 1984 (WGS-84) |
Time period:
- The data set covers the period 2004/07/05 to 2006/02/15.
- Temporal Resolution: monthly
Platform/Sensor/Parameters measured include:
- FIELD INVESTIGATION / GC (GAS CHROMATOGRAPH) / METHANE
- FIELD INVESTIGATION /GC (GAS CHROMATOGRAPH) / CARBON DIOXIDE
- FIELD INVESTIGATION /OXYGEN METERS / OXYGEN
- FIELD INVESTIGATION /TEMPERATURE PROBE / WATER TEMPERATURE
3. Data Application and Derivation:
Measured fluxes can be combined with estimates of surface area of the flooded zone as well as modeled depth of the waterways to calculate methane and carbon dioxide emissions on a monthly to yearly basis.
4. Quality Assessment:
For CO2, standards of 335 mg per L (SD = 105) and 995 mg per L (SD = 104) were used to calibrate the analyses. The detection limit was 100 mg per L.
Chamber emissions for each deployment were estimated from the regression of CO2 concentration against time. All regressions had r2 > 0.90, indicating that emissions were predominantly diffusive.
5. Data Acquisition Materials and Methods:
Site Description
Balbina reservoir, the largest hydroelectric reservoir in the Amazon, was formed by impounding the Uatuma River in 1987. It has an average flooded area of 1,770 km2 and an installed generating capacity of 250 MW (Fearnside, 1989; Kemenes, 2006). The waters are dilute (conductance varying from 6 to 10 uS per cm) and slightly acid (pH varying from 6.0 to 7.4) with a dissolved organic carbon concentration ranging from 2.7 to 7.1 mg per L. The reservoir is stratified near the dam resulting in the development of near anoxia and high concentrations of CH4 in bottom waters through most of the year (Kemenes et al., 2007).
Sampling at the Reservoir
Reservoir surface water samples, bottom water samples, and gas emission samples were collected at 10 to 14 sites at monthly intervals between April and November 2005, and six times in February, 2006.
- Static chambers were utilized for flux measurements, and were subsampled with 60 ml polyethylene syringes at 5-minute intervals during a period of 20 minutes, after which the gas samples were transferred to 20 ml glass serum bottles with high density butyl rubber stoppers and stored until analysis. Chamber emissions in the reservoir were assumed to include both diffusive and ebullitive fluxes.
- Surface and near bottom temperatures and dissolved O2 concentrations were measured with a YSI Model 85 m at all sites. Secchi depth transparency was determined with a 20 cm diameter white disk
- Reservoir water samples to determine the vertical profiles of CH4, and CO2 were collected during the rainy and dry seasons immediately above the dam between September 2004 and February 2006. Measurements of temperature and dissolved O2 were taken with a YSI Model 85 m.
- Water samples were collected with a Ruttner sampler at the depth of the turbine inflow (approximately 30 m) and transferred to syringes. Water samples in syringes were equilibrated with atmospheric air (30 ml water: 30 ml air), and the air faction was then transferred to a serum vial and stored until analysis.
Sampling Downstream from the Reservoir
Surface water samples below the dam were collected directly with 60 ml syringes between July 2004 and November 2005. Water samples in syringes were equilibrated with atmospheric air (30 ml water: 30 ml air), and the air faction was then transferred to a serum vial and stored until analysis.
Methane and Carbon Dioxide Analysis
Dissolved CH4 concentrations were estimated with the head space method (Johnson et al., 1990).
CH4 and CO2 concentrations in all water samples were determined using a dual column gas chromatograph (Shimadzu GC-14A) following the methodology of Hamilton et al. (1995).
Methane and Carbon Dioxide Emissions
Average areal emission rates (mg C per m2 per day) were determined monthly and interpolated spatially and temporally using a digital inundation model derived from a detailed bathymetric map of the reservoir and daily stage readings.
Daily emissions for the entire reservoir were obtained by multiplying the total flooded area, estimated from the inundation model for a given day, by the average monthly areal emission rate.
Emissions of CH4 downstream of Balbina reservoir in the central Amazon basin (Brazil) were calculated from regular measurements of degassing in the outflow of the turbines and downstream diffusive losses. Gas releases immediately below the dam were calculated as the difference between gas flux at the entrance and the outflow of the hydroelectric turbines. An inundation model derived from a bathymetric map and daily stage readings was used for spatial and temporal interpolation of reservoir emissions.
6. Data Access:
This data is available through the Oak Ridge National Laboratory (ORNL) Distributed Active Archive Center (DAAC).
Data Archive Center:
Contact for Data Center Access Information:
E-mail: uso@daac.ornl.gov
Telephone: +1 (865) 241-3952
References
Fearnside, P. M. (1989), Brazil's Balbina Dam: Environmental versus the legacy of the Pharaohs in Amazonia, Environ. Manage. N. Y., 13, 401-423.
Hamilton, S. K., S. J. Sippel, and J. M. Melack (1995), Oxygen depletion, carbon dioxide and methane production in waters of Pantanal wetland of Brazil, Biogeochemistry, 30, 115-141.
Johnson, K. M., J. E. Hughes, P. L. Donaghay, and J. M. Sieburth (1990), Bottle-calibration static head space method for determination of methane dissolved in seawater, Anal. Chem., 62, 2408-2412.
Kemenes, A., B. R. Forsberg, and J. M. Melack (2007), Methane release below a tropical hydroelectric dam, Geophys. Res. Lett., 34, L12809, doi:10.1029/2007GL029479.
Kemenes, A. (2006), Emissao de metano e gas carbonico pela Hidreletrica de Balbina, Ph.D. thesis, 98 pp., Inst. Nac. de Pesqui. da Amazonia, Manaus, Brazil.
Related Publications
- Kemenes, A., B. R. Forsberg, and J. M. Melack (2011), CO2 emissions from a tropical hydroelectric reservoir (Balbina, Brazil), J. Geophys. Res., 116, G03004, doi:10.1029/2010JG001465.