Documentation Revision Date: 2016-10-13
Data Set Version: V1
Summary
Historical data are from the cooperative network, US Historical Climate Network (HCN), snowpack telemetry (SNOTEL), and other station data. Solar radiation and humidity were derived from the MTCLIM version 3 model (Thornton and Running, 1999; Kimball et al., 1997).
Future estimates were derived from the Hadley UK Centre for Climate Prediction and Research model (HadCM2) and the Canadian Centre for Climate Modelling and Analysis (CCCma) model (CGCM1) with transient greenhouse gas and sulfate aerosol forcing.
There are three data files, one historical and two modeled future scenarios, in NetCDF (.nc4) format with this data set.
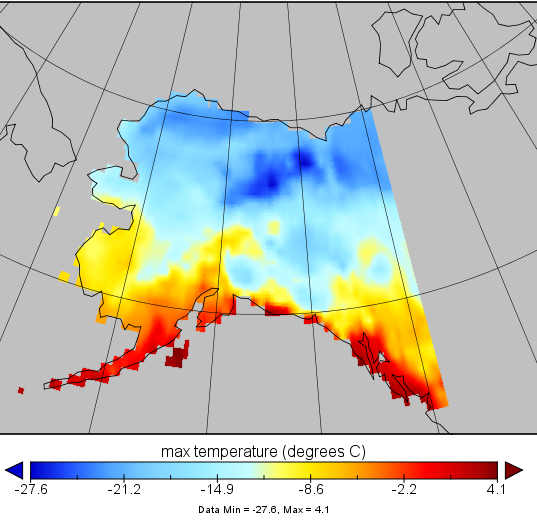
Figure 1. Maximum temperature for Alaska, January 1922.
Citation
Kittel, T.G.F., N.A. Rosenbloom, C. Kaufman, J.A. Royle, C. Daly, H.H. Fisher, W.P. Gibson, S. Aulenbach, D.N. Yates, R. McKeown, D.S. Schimel, and VEMAP2 PARTICIPANTS. 2016. VEMAP 2: Monthly Historical and Future Climate Data, Alaska, USA. ORNL DAAC, Oak Ridge, Tennessee, USA. http://dx.doi.org/10.3334/ORNLDAAC/1344
Table of Contents
- Data Set Overview
- Data Characteristics
- Application and Derivation
- Quality Assessment
- Data Acquisition, Materials, and Methods
- Data Access
- References
Data Set Overview
Project: VEMAP
This data set provides the results of the development of The Vegetation/Ecosystem Modeling and Analysis Project (VEMAP) Phase 2 transient climate change scenarios for the state of Alaska, USA. The data include gridded monthly historical and future estimates of maximum and minimum temperature, solar radiation, vapor pressure, irradiance, relative humidity and potential evapotranspiration at 0.5-degree spatial resolution. Historical data are for the period 1922-1996; future estimates cover the period 1997-2100.
Related data set:
Kittel, T. G. F., N. A. Rosenbloom, C. Kaufman, J. A. Royle, C. Daly, H. H. Fisher, W. P. Gibson, S. Aulenbach, D. N. Yates, R. McKeown, D. S. Schimel, and VEMAP 2 Participants. 2001. VEMAP 2: U.S. Monthly Climate Change Scenarios, Version 2. ORNL DAAC, Oak Ridge, Tennessee, USA. http://dx.doi.org/10.3334/ORNLDAAC/567
Acknowledgment(s): This data set was originally published by EOS-WEBSTER, a digital library of Earth Science Data and an Earth Science Information Partner, for the EOS-Earth Data website at the University of New Hampshire, Durham, NH. The source data were provided to EOS-WEBSTER by the Global Atmospheric Chemistry Group, Institute for the Study of Earth, Oceans, and Space, University of New Hampshire (UNH). Several EOS-WEBSTER data products have been transferred to the ORNL DAAC for permanent archival.
Data Characteristics
Spatial Coverage: Alaska, USA
Spatial resolution: 0.5 degree
Temporal Coverage: Historical data cover the period 1922-1996. Estimates from the CGCM1 model cover the period 1997-2100. Estimates from the HadCM2 model cover the period 1997-2099.
Temporal resolution: Monthly
Study Area (All latitudes and longitudes are given in decimal degrees)
| Study Area | Westernmost Longitude | Easternmost Longitude | Northernmost Latitude | Southernmost Latitude |
|---|---|---|---|---|
| Alaska, USA | -170.5 | -128.5 | 71.5 | 53.5 |
Data File Information
There are three data files in NetCDF format (.nc4) with this data set:
Table 1. Data files and descriptions.
| File Name | Description |
|---|---|
| future_climate_CCCmaCGCM1_model_alaska_1997-2100.nc4 | Mean monthly data produced from the CGCM1 model for the period 1997-2100 |
| future_climate_HadCM2_model_alaska_1997-2099.nc4 | Mean monthly data produced from the HadCM2 model for the period 1997-2099 |
| historical_climate_alaska_1922-1996.nc4 | Historical mean monthly climate data based on the MTCLIM model, HCN, Snotel, and other station data for the period 1922-1996 |
Table 2. Variables in the data files.
| Variable | Description | Units |
|---|---|---|
| irrx | mean monthly irradiance | W m-2 |
| petx | mean monthly potential evapotranspiration | kg m-2 d-1 |
| pptx | mean monthly precipitation | mm/month |
| tmin | mean monthly minimum temperature | degrees C |
| tmax | mean monthly maximum temperature | degrees C |
| rhum | mean monthly relative humidity | percent |
| srad | mean monthly solar radiation | kJ m-2 d-1 |
| vpxx | mean monthly vapor pressure | Pa |
Table 3. Spatial properties of the data files.
| Spatial Representation Type | Raster |
| Pixel Depth | 32 bit |
| Pixel Type | float |
| No data value | -9999 |
| Number of Bands | CCCma-CGCM1 file=1248; HadCM2 file=1236; historical file=900 |
| Band Information | time |
Application and Derivation
These data could be used in climate models.
Quality Assessment
The Historical Climate Network (HCN) (Easterling et al., 1996) precipitation and temperature data consisted of stations selected to have long-term, relatively complete records. The high level of quality checking and attention to station histories in the monthly HCN data, along with extensive coverage across the domain in the earlier part of the record, provided a strong basis for reliance on this set for spatial interpolation of monthly regional temperature and precipitation anomalies (Kittel et al., 2004).
Data Acquisition, Materials, and Methods
VEMAP Grid
The 0.5 degree Alaska grid was aggregated from a 2.5-min Alaska DEM, derived from ETOPO30, the USGS 30-sec worldwide digital terrain grid.
Historical Data
Monthly mean minimum and maximum temperature (Tmo) and monthly precipitation (PPTmo)
Mean Tmo and PPTmo historical time series were derived and combined from HCN (Easterling et al., 1996) and cooperative network monthly station data from 1922 - 1996 (~250 stations). The HCN precipitation and temperature data set consisted of stations selected to have long-term, relatively complete records which were adjusted for time of observation differences, instrument changes and moves, station relocations, and urbanization effects.
HCN processing also included infilling of missing data based on neighboring stations. The high level of quality checking and attention to station histories in monthly HCN data, along with extensive coverage across the domain in the earlier part of the record, provided a strong basis for reliance on this set for spatial interpolation of monthly regional temperature and precipitation anomalies (Kittel et al., 2004).
Creation of monthly anomaly time-series
A 75-year time series of monthly precipitation and temperature anomalies was created by comparing the historical records against a 2.5 minute gridded 1961-1990 baseline climatology for Alaska (SCAS, 2000), interpolated to the station locations.
Spatial interpolation
The monthly anomalies were kriged to the 0.5 degree VEMAP grid and were then applied (deltas for temperature, ratios for precipitation) (added or multiplied) to a 0.5 degree aggregation of the gridded 4-km baseline climatology to create the 75-year historical record.
Solar Radiation and Humidity
These data were estimated with the MTCLIM3 model (Thornton and Running, 1999; Kimball et al., 1997) to create monthly vapor pressure (vpxx), daytime relative humidity (rhum), total incident solar radiation (srad), and irradiance (irrx) from daily T and PPT (Kittel et al., 2004).
Future Estimates
Gridded monthly future estimates were derived from the HadCM2 and the CGCM1 models. The model scenarios included the following:
Greenhouses gases (GHG+A 1); 1% per year compounded increase in equivalent CO2 plus IS92A sulfate aerosols; Ensemble 1.
The CCCma-CGCM1 data are for the years 1997 – 2100, release r5.
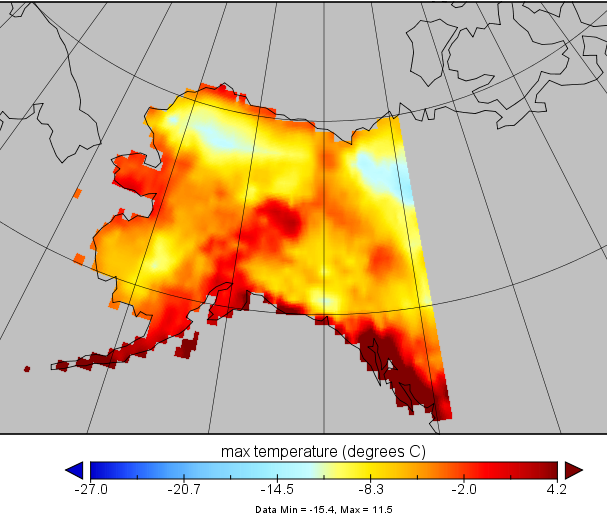
Figure 2. Estimated maximum temperature for Alaska, December 2099, derived from the CGCM1 model.
The HadCM2 data are for the years 1997 – 2099, release r5.
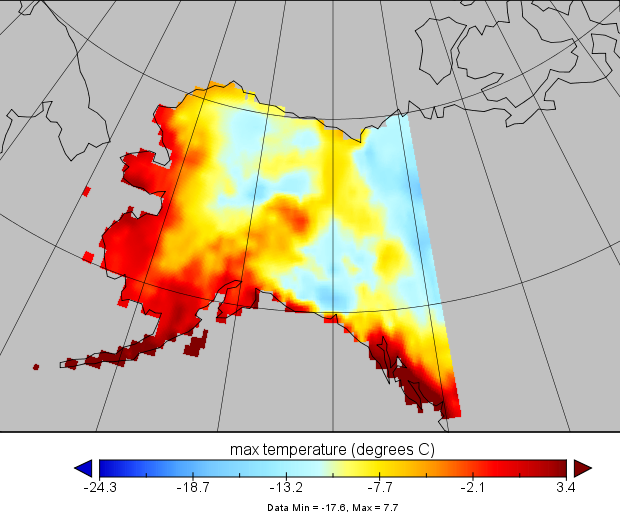
Figure 3. Estimated maximum temperature for Alaska, December 2099, derived from the HadCM2 model.
For additional information on the CGCM1 model, refer to the Canadian Centre for Climate Modeling and Analysis http://www.cccma.ec.gc.ca/.
For additional information on the HadCM2 model, refer to the Met Office Hadley Centre Climate Programme http://www.metoffice.gov.uk/publicsector/climate-programme.
The providers of the VEMAP Alaska data were The VEMAP Data Group, National Center for Atmospheric Reasearch NCAR, Boulder, CO.
Data Access
These data are available through the Oak Ridge National Laboratory (ORNL) Distributed Active Archive Center (DAAC).
VEMAP 2: Monthly Historical and Future Climate Data, Alaska, USA
Contact for Data Center Access Information:
- E-mail: uso@daac.ornl.gov
- Telephone: +1 (865) 241-3952
References
Easterling, D.R., T.R. Karl, E.H. Mason, P.Y. Hughes, D.P. Bowman, R.C. Daniels, and T.A. Boden, (1996). United States Historical Climatology Network (US HCN) monthly temperature and precipitation data. ORNL/CDIAC-87, NDP-019/R3. Carbon Dioxide Information Analysis Center, Oak Ridge National Laboratory, Oak Ridge, TN; available at National Center for Atmospheric Research (dataset ds565): http://rda.ucar.edu/datasets/ds565.0/
Kittel, T.G.F., N.A. Rosenbloom, J.A. Royle, C. Daly, W.P. Gibson, H.H. Fisher, P. Thornton, D.N. Yates, S. Aulenbach, C. Kaufman, R. McKeown, D. Bachelet, D.S. Schimel, and VEMAP2 Participants. 2004. VEMAP Phase 2 bioclimatic database. I. Gridded historical (20th century) climate for modeling ecosystem dynamics across the conterminous USA. Clim Res, Vol. 27: 151–170, 2004.
Kimball, J.S., S.W. Running, and R. Nemani, 1997. An improved algorithm for estimating surface humidity from daily minimum temperature. Agricultural and Forest Meteorology, 85:87-98.
Spatial Climate Analysis Service (SCAS), Oregon State University. 2000. http://prism.oregonstate.edu/
Thornton, P.E., and S.W. Running, 1999. An improved algorithm for estimating incident daily solar radiation from measurements of temperature, humidity, and precipitation. Agricultural and Forest Meteorology, 93:211-228.