Get Data
Revision Date: June 6, 2014
|
Please note that this version was superseded by Version
4 on 2015/09/30. Follow this link to the latest version: Randerson, J.T., G.R. van der Werf, L. Giglio, G.J. Collatz, and P.S. Kasibhatla. 2015. Global Fire Emissions Database, Version 4 (GFEDv4). ORNL DAAC, Oak Ridge, Tennessee, USA. http://dx.doi.org/10.3334/ORNLDAAC/1293 Contact ORNL DAAC User Services (uso@daac.ornl.gov) if you need additional assistance. |
This data set provides monthly burned area and monthly and annual fire emissions data from July 1996 to February 2012. Emissions data are available for carbon (C), dry matter (DM), carbon dioxide (CO2), carbon monoxide (CO), methane (CH4), hydrogen (H2), nitrous oxide (N2O), nitrogen oxides (NOx), non-methane hydrocarbons (NMHC), organic carbon (OC), black carbon (BC), particulate matter 2.5 micron (PM2p5), total particulate matter (TPM), and sulfur dioxide (SO2) among others. The C4 fraction of carbon emissions is also provided.
Note that while most emissions estimates included data for 32 variables (trace gases, aerosols, and carbon), not all data are available for all years, and not all variables (emission species) are included in each data product.
Example applications of global fire emissions data products are shown in Figures 1 and 2.
Additional information may be obtained from the Global Fire Data website: http://www.globalfiredata.org/index.html.
Data products include:
- 0.5 degree x 0.5 degree gridded monthly burned area data (ha) for 1996 to 2012 provided as text files and as GeoTIFF files.
- 3-hourly emssions (fraction) for 2003 to 2010 in NetCDF (.nc) format.
- Daily emssions (fraction) for 2003 to 2010, in NetCDF (.nc) format.
- Monthly emissions for 32 variables from 1997 to 2011, in text and GeoTIFF format.
- Monthly emissions for 31 variables from specific sources (grassland and savanna, woodland, deforestation and degradation, forest, agricultural waste burning, and peat fires), both as absolute and relative emissions. The time period is for 2007 to 2011, and the files are provided in text and GeoTIFF format.
- Global emission totals of C and other species from all sources, and from each individual source (forest fires, peat fires, agricultural waste burning, etc).
- Annual emissions of carbon and other trace gases for all countries, for the period 1997 to 2010, provided as text files. These files are for indicative use only; they are not suitable for official reporting due to large uncertainties and potential for missing key regional aspects in the global approach used.
- Ancillary data for monthly biosphere fluxes. The CASA-GFED biosphere flux sources include Net Primary Production (NPP), heterotrophic respiration (Rh), and fires (biomass burning). These files are for the time period 1997 to 2009 and are provided as text files and in GeoTIFF format.
There are 12 compressed (*.zip) files with this data set. The data are in text, NetCDF (.nc), and GeoTIFF (.tiff) formats as described above.
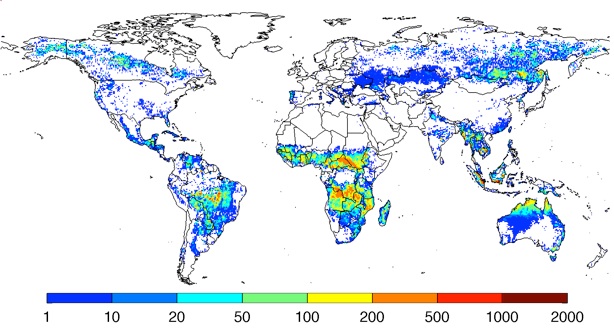
Figure 1. Annual carbon emissions (as g C/m2/year) averaged over 1997-2009. The annual C emissions estimates were derived by combining burned area data with a biogeochemical model, CASA-Global Fire Emissions Database (CASA-GFED), that estimates fuel loads and combustion completeness for each monthly time step. The fuel loads were based on satellite derived information on vegetation characteristics and productivity to estimate carbon input and carbon outputs through heterotrophic respiration, herbivory, and fires (http://www.globalfiredata.org/index.html).
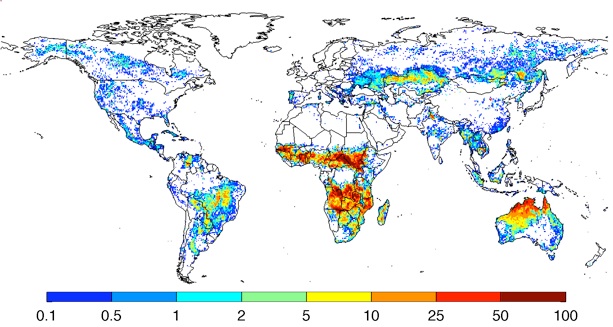
Figure 2. Annual burned area (as percentage of the area of the grid cell), averaged over 1997-2009. As of November 2000, 90% of the data are based on mapped MODIS burned area using the direct broadcast algorithm, aggregated from the native 500-meter resolution to 0.5 degree. The remaining 10%, and burned area for 1997 - October 2000, are based on relations between active fires (ATSR, TRMM-VIRS, and MODIS) and mapped burned area for periods in which they overlap (http://www.globalfiredata.org/index.html).
Version 3.1 Note:This data set is intended for use for large-scale modeling studies. It supersedes and replaces the Global Fire Emissions Database, Version 2 (GFEDv2.1) which was archived by the Oak Ridge National Laboratory Distributed Active Archive Center in 2007.
Release and Update History of the Global Fire Emissions Database
Updates to this data set will be made periodically. Please contact ORNL DAAC User Services so that we can add you to our e-mail distribution list for update notices.
| Date | Release and Update History | ORNL DAAC Notes |
|---|---|---|
| December 21, 2005 | GFED Release 1 | |
| December 21, 2005 | ORNL DAAC Global Fire Emissions Database, Version 1 (GFEDv1) | Initial release archived |
| GFED Release 2 | ||
| May 31, 2006 | Global Fire Emissions Database, Version 2 (GFEDv2) | Superseded and replaced v1 |
| June 23, 2006 | GFED updated the burned fraction (BF), combustion completeness (CC), and fuel load (FL) files | |
| November 27, 2006 | GFED added files for the year 2005 and added emission files with an 8 day time step for the 2001 – 2005 period | |
| March 30, 2007 | Global Fire Emissions Database, Version 2 (GFEDv2.1) | Incorporates 2006 changes and additions and supersedes and replaces v2 |
| September 30, 2013 | Global Fire Emissions Database, Version 3 (GFEDv3.1) | Incorporates changes to spatial resolutions and data additions, and supersedes and replaces v2.1 |
Data Citation:
Cite this data set as follows:
Randerson, J.T., G.R. van der Werf, L. Giglio, G.J. Collatz, and P.S. Kasibhatla. 2013. Global Fire Emissions Database, Version 3 (GFEDv3.1). Data set. Available on-line [http://daac.ornl.gov/] from Oak Ridge National Laboratory Distributed Active Archive Center, Oak Ridge, Tennessee, USA. doi:10.3334/ORNLDAAC/1191
Additional citation for this data set:
Van der Werf, G. R., J. T. Randerson, L.Giglio, G. J. Collatz, and P. S. Kasibhatla. 2006. Interannual variability in global biomass burning emission from 1997 to 2004, Atmospheric Chemistry and Physics, 6, 3423-3441. SRef-ID: 1680-7324/acp/2006-6-3423.
Data Characteristics:
There are 12 compressed (*.zip) files with this data set. The data are in text, NetCDF (.nc), and GeoTIFF (.tiff) formats.
Each data file contains 720 columns and 360 rows (and has a 0.5 degree latitude by 0.5 degree longitude spatial resolution). The upper left corner of each file is centered at 179.75W, 89.75N and the lower right corner at 179.75E, 89.75S.
File contents and descriptions:
Monthly Burned Area
Monthly burned area data (ha) gridded to 0.5 degree x 0.5 degree resolution for 1996 to 2012.
(Files 1-2) GFED3-1_burned_area_geotiff.tar.gz and GFED3-1_burned_area_txt.tar.gz:
When expanded, these files each contain 376 GeoTIFF (.tiff ) and (.txt) files of gridded, 0.5 degree x 0.5 degree, monthly burned area data (ha) for 1996 to 2012. There are 188 files for burned area (BA) and 188 files for burned area uncertainty (UncertBA). The data covers the period 199607 through 201202.
The files are named GFED3.1_YYYYMM_SUBJECT.xxx, where YYYY=1996 through 2012, MM=2 digit month (01=January, 02=February, etc), SUBJECT= BA or UncertBA, and xxx=.tif or .txt. Note: BA= monthly area burned (ha) UncertBA=one-sigma uncertainty in monthly burned area (ha).
3-Hourly and Daily Emission Fractions
(File 3) GFED3-1_3-hourly_fraction_emissions.tar.gz:
Fraction of emissions for 3-hourly emissions calculated from GOES fire counts.
When expanded, this file contains 96 NetCDF (.nc) files at a spatial resolution of 0.5 degree × 0.5 degree. The data are unitless, ranging from 0 to 1. The data can be used in combination with monthly emissions files to estimate emissions on a higher temporal resolution.
There are five variables included in each data file: time, lat, lon, Fraction_of_Emissions and DataSources.
- "time" denotes the beginning of each 3-hour interval.
- "lat" and "lon" are for the center latitude and longitude for each grid cell
- "Fraction_of_Emissions" is the 3-hourly fire fractions used to generate 3-hourly fire emissions
- "DataSources" shows the dominant land types: 1 for forest, 2 for shrub/savannas, 3 for crops/grasses, 4 for grid cells for which burned area information was not available for which we used global mean diurnal cycle, and 0 for the grid cells outside of GFED regions (most are ocean cells).
The files are named fraction_emissions_YYYYMM.nc, where YYYY=200301 through 201012, and MM=2 digit month (01=January, 02=February, etc).
(File 4) GFED3-1_daily_fraction_emissions.tar.gz:
Fraction of emissions calculated from MODIS AQUA and TERRA active fire data (MCD14ML).
When expanded, this file contains 2,922 files for emssions of 31 trace gases, aersols, and carbon. The files are at a spatial resolution of 0.5 degree × 0.5 degree. The data are unitless, ranging from 0 to 1. The data cover the years 2003 to 2010, in NetCDF (.nc) format. There are 365 files, one file for each day of the year, for the years 2003, and 1997 to 2011. There are 366 files for years 2004 and 2008.
There are four variables included in each data file: lat, lon, Fraction_of_Emissions and DataSources.
- "lat" and "lon" are for the center latitude and longitude for each grid cell
- "Fraction_of_Emissions" is the daily fire fractions used to generate daily fire emissions
- "DataSources" " provides information about the satellite data used to construct the daily product: 1 from Aqua only, 2 from Terra only, 3 from both Aqua and Terra, 4 for the grid cells without active fires but with fire emissions – which were uniformly distributed during the given month, and 0 for the grid cells outside of GFED regions (most are on the oceans).
The files are named fraction_emissions_YYYYMMDD.nc, where YYYY=year, 200301 through 201012, MM=2 digit month (01=January, 02=February, etc), and DD=2 digit day.
Monthly Emission Fractions for Individual Species and Sources
Data files are monthly emissions for individual species and for individual species partitioned by specific sources (grassland and savanna, woodland, deforestation & degradation, forest, agricultural waste burning, and peat fires).
(Files 5-6) GFED3-1_monthly_emissions_geotiff.tif.gz and GFED3-1_monthly_emissions_txt.tar.gz:
When expanded, these files each contain 5,760 GeoTIFF (.tiff ) and 5,760 text (.txt) files. Units are in g species/m2/month. The values range between 0 and 1. To estimate total emissions for a specific species, these fields have to be multiplied with the total emissions. There are 32 variables (species) and 180 files for each variable. There is one file for each month for the years 1997 through 2011.
The files are named as GFED3.1.YYYYMM_VARIABLE.txt and GFED3.1.YYYYMM_VARIABLE.tif
where YYYY=the years 1997 through 2009, MM=2 digit mponth (01=January, 02=February, etc.), and VARIABLE=one of the following:
Carbon emissions (g C/m2/month)
C2H4 emissions (g C2H4/m2/month)
C2H4O emissions (g C2H4O/m2/month)
C2H5OH emissions (g C2H5OH/m2/month)
C2H6 emissions (g C2H6/m2/month)
C2H6S emissions (g C2H6S/m2/month)
C3H6S emissions (g C3H6S/m2/month)
C3H6O emissions (g C3H6O/m2/month)
C3H8 emissions (g C3H8/m2/month)
C5H8 emissions (g C5H8/m2/month)
CH2O emissions (g CH2O/m2/month)
CH3OH emissions (g CH3OH/m2/month)
CH4 – Methane emissions (g CH4/m2/month)
CO emissions (g CO/m2/month)
CO2 emissions (g CO2/m2/month)
DM – Dry matter (g DM/m2/month)
H2 emissions (g H2/m2/month)
Higher alkanes emissions (g Higher alkanes/m2/month)
Higher alkenes emissions (g Higher alkenes/m2/month)
N2O emissions (g N2O/m2/month)
NH3 emissions (g NH3/m2/month)
NMHC emissions (g NMHC/m2/month)
NOX emissions (g NOX/m2/month)
OC – Organic carbon emissions (g OC/m2/month)
PM2P5 –Particle matter 2.5 micron emissions (g PM2.5/m2/month)
SO2 emissions (g SO2/m2/month)
TC – Total carbon emissions (g TC/m2/month)
Terpenes emissions (g Terpenes/m2/month)
Toluene lump emissions (g Toluenes/m2/month)
TPM – Total particulate matter emissions (g TPM/m2/month)
(Files 7-8) GFED3-1_partitioning_geotiff.tar.gz and GFED3-1_partitioning_txt.tar.gz:
When expanded, these files each contain 32,320 GeoTIFF(.tif) and text (.txt ) files.
Units are in g species/m2/month. The values range between 0 and 1. To estimate total emissions from a specific species and source category these fields have to be multiplied with the total emissions. There are data for 31 variables (species), but there are no data for C4. For each variable, there are six sub-variables, or emission sources (agriculture, deforestation, forest, peat, savanna, and woodland). The data covers the period 200701 through 201112.
Carbon emissions (g C/m2/month)
C2H4 emissions (g C2H4/m2/month)
C2H4O emissions (g C2H4O/m2/month)
C2H5OH-emissions (g
C2H5OH/m2/month)
C2H6 emissions (g C2H6/m2/month)
C2H6S emissions (g C2H6S/m2/month)
C3H6S emissions (g C3H6S/m2/month)
C3H6O emissions (g C3H6O/m2/month)
C3H6 emissions (g C3H6/m2/month)
C3H8 emissions (g C3H8/m2/month)
C5H8 emissions (g C5H8/m2/month)
CH2O emissions (g CH2O/m2/month)
CH3OH emissions (g CH3OH/m2/month)
CH4 Methane emissions (g CH4/m2/month)
CO emissions (g CO/m2/month)
CO2 emissions (g CO2/m2/month)
DM Dry matter (g DM/m2/month)
H2 emissions (g H2/m2/month)
Higher alkanes emissions (g Higher alkanes/m2/month)
Higher alkenes emissions (g Higher alkenes/m2/month)
N2O emissions (g N2O/m2/month)
NH3 emissions (g NH3/m2/month)
NMHC emissions (g NMHC/m2/month)
NOX emissions (g NOX/m2/month)
OC- Organic carbon emissions (g OC/m2/month)
PM2P5-Particle matter 2.5 micron emissions (g PM2.5/m2/month)
SO2 emissions (g SO2/m2/month)
TC-Total carbon emissions (g TC/m2/month)
Terpenes emissions (g Terpenes/m2/month)
Toluene Lump emissions (g Toluenes/m2/month)
TPM -Total particulate matter emissions (g TPM/m2/month)
Global Total Emissions for Individual Species
Global annual emission totals of C and other species from all sources.
(File 9) GFED3-1_global_totals_txt.tar.gz:
When expanded, this file contains 62 files text files (*.txt) of global total emissions in g species/year for C and other trace gasses per region. There are two files for each variable (species), but it does not include C4. For the file pairs, one is for 'absolute' emissions; the other is for 'relative' emissions. The data cover the years 1997 through 2010.
Files are named Emis_Variable_absolute.txt or Emis_Variable_relative.txt where the where the variable is one of the following:
BC - Black Carbon emissions (g BC/year)
Carbon emissions (g C/year)
C2H4 emissions (g C2H4/year)
C2H4O emissions (g C2H4O/year)
C2H5OH-emissions (g C2H5OH/year)
C2H6 emissions (g C2H6/year)
C2H6S emissions (g C2H6S/year)
C3H6S emissions (g C3H6S/year)
C3H6O emissions (g C3H6O/year)
C3H6 emissions (g C3H6/year)
C3H8 emissions (g C3H8/year)
C5H8 emissions (g C5H8/year)
CH2O emissions (g CH2Oyear)
CH3OH emissions (g CH3OH/year)
CH4 Methane emissions (g CH4/year)
CO emissions (g CO/year)
CO2 emissions (g CO2/year)
DM Dry matter (g DM/year)
H2 emissions (g H2/year)
Higher alkanes emissions (g Higher alkanes/year)
Higher alkenes emissions (g Higher alkenes/year)
N2O emissions (g N2O/year)
NH3 emissions (g NH3/year)
NMHC emissions (g NMHC/year)
NOX emissions (g NOX/year)
OC- Organic carbon emissions (g OC/year)
PM2P5-Particle matter 2.5 micron emissions (g PM2.5/year)
SO2 emissions (g SO2/year)
TC-Total carbon emissions (g TC/year)
Terpenes emissions (g Terpenes/year)
Toluene Lump emissions (g Toluenes/year)
TPM -Total particulate matter emissions (g TPM/year)
Annual Emission by Country for Individual Species
Annual emissions of carbon and other trace gases for all countries, for the period 1997 to 2010, provided as text files. These files are for indicative use only; they are not suitable for official reporting due to large uncertainties and potential for missing key regional aspects in the global approach used.
(File 10) GFED3-1_annual_countries_txt.tar.gz:
When expanded, this file contains 30 text files (*.txt), one for each variable (species) (does not include C2H5OH and C2H5S). The data cover the years 1997 through 2010.
Files are named Variable_absolute.txt. where the variable is one of the following:
C2H4O emissions (g C2H4O/year)
C2H6 emissions (g C2H6/year)
C2H6S emissions (g C2H6S/year)
C3H6S emissions (g C3H6S/year)
C3H6O emissions (g C3H6O/year)
C3H8 emissions (g C3H8/year)
C5H8 emissions (g C5H8/year)
CH2O emissions (g CH2O/year)
CH3OH emissions (g CH3OH/year)
CH4 – Methane emissions (g CH4/year)
CO emissions (g CO/year)
CO2 emissions (g CO2/year)
DM – Dry matter (g DM/year)
H2 emissions (g H2/year)
Higher alkanes emissions (g Higher alkanes/year)
Higher alkenes emissions (g Higher alkenes/year)
N2O emissions (g N2O/year)
NH3 emissions (g NH3/year)
NMHC emissions (g NMHC/year)
NOX emissions (g NOX/year)
OC – Organic carbon emissions (g OC/year)
PM2P5 –Particle matter 2.5 micron emissions (g PM2.5/year)
SO2 emissions (g SO2/year)
TC – Total carbon emissions (g TC/year)
Terpenes emissions (g Terpenes/year)
Toluene lump emissions (g Toluenes/year)
TPM – Total particulate matter emissions (g TPM/year)
Monthly Biosphere Fluxes
Ancillary data for monthly biosphere fluxes. The CASA-GFED biosphere flux sources include Net Primary Production (NPP), Heterotrophic respiration (Rh), and fires (biomass burning). These files are for the time period 1997 to 2009 and are provided as text files and in GeoTIFF format.
(Files 11-12) GFED3-1_ancillary_data_biosphere_geotiff.tar.gz and GFED3-1_ancillary_data_biosphere_txt.tar.gz:
When expanded, these files each contain 468 GeoTIFF (.tiff ) and 468 text (.txt) files of biosphere fluxes from NPP, Rh, and fires (BB). Units are in g C/m2/month.
The files are named GFED3.1_YYYYMM_VAR.tif where YYYY=year 199701 through 200912, MM=2 digit month (01=January, 02=February, etc), and VAR=BB, NPP, or Rh.
Methodology
Burned Area
Burned area estimates were derived from a combination of active fires depicted by Moderate Resolution Imaging Spectroradiometer (MODIS) (2001 onwards), fire observations from the Tropical Rainfall Measuring Mission (TRMM) Visible and Infrared Scanner (VIRS), and the Along-Track Scanning Radiometer (ATSR) (for the pre-2001 period), and burned area (MODIS) for selected regions. For these regions, relations between burned area and active fires were derived using ancillary data such as vegetation continuous fields and cluster size of fire pixels. These regionally-derived relations were then used to extrapolate to the global and inter-annual domain. For additional information, refer to Giglio et al., 2010.
Emission Estimates
Emission estimates were derived by combining burned area data with a revised version of the biogeochemical model, Carnegie-Ames-Stanford Approach (CASA-GFED), that estimates fuel loads and combustion completeness for each monthly time step. For November 2000 onwards, estimates were based on burned area, active fire detections, and plant productivity. Refer to van der Werf et a., 2010 for more detailed information.
The daily and 3-hourly time series were derived by the disaggregation of the monthly MODIS data, and in parallel, mean diurnal cycles were constructed from Geostationary Operational Environmental Satellite (GOES) Wildfire Automated Biomass Burning Algorithm (WF_ABBA) active fire observations. Refer to Mu et al., 2010, for more detailed information.
Annual Emissions by Country
A list of the countries and country-level estimates for C can be found at the Global Fire Data website: http://[redacted]/~gwerf/GFED/GFED3/tables/countries/C_absolute.txt [Link no longer works].
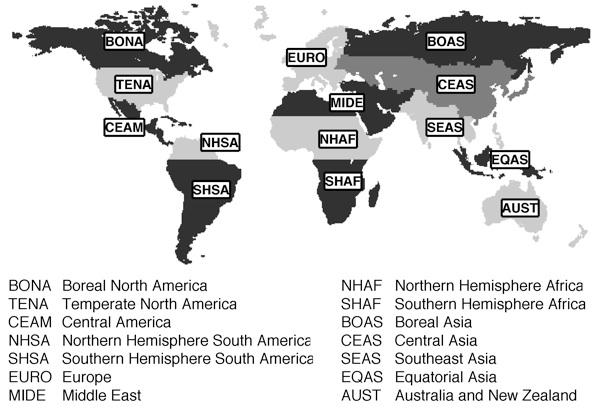
Figure 3. Basin regions.
Additional information may be obtained from the Global Fire Data website: http://www.globalfiredata.org/index.html.
Data Access:
These data are available through the Oak Ridge National Laboratory (ORNL) Distributed Active Archive Center (DAAC).
Data Archive Center:
Contact for Data Center Access Information:
E-mail:
uso@daac.ornl.gov
Telephone: +1 (865) 241-3952
References:
Andreae, M. O. and P. Merlet. 2001. Emission of trace gases and aerosols from biomass burning. Global Biogeochemical Cycles, 15: 955-966, 2000GB001382.
Arino, O., J.-M. Rosaz, and P. Goloub. 1999. The ATSR World Fire Atlas. A synergy with 'Polder' aerosol products. Earth Observation Quarterly, 1-6.
Giglio, L., Randerson, J. T., van der Werf, G. R., Kasibhatla, P. S., Collatz, G. J., Morton, D. C., and DeFries, R. S.: Assessing variability and long-term trends in burned area by merging multiple satellite fire products, Biogeosciences, 7, 1171-1186, doi:10.5194/bg-7-1171-2010, 2010.
Giglio, L., J. D. Kendall, and R. Mack. 2003. A multi-year active fire dataset for the tropics derived from the TRMM VIRS. International Journal of Remote Sensing, 24: 4505-4525.
Giglio, L., G. R. van der Werf, J. T. Randerson, G. J. Collatz, and P. Kasibhatla. 2006. Global estimation of burned area using MODIS active fire observations. Atmos. Chem. Phys., 6: 957-974.
Matthews, E. and I. Fung. 1987. Methane emission from natural wetlands: Global area, distribution and environmental characteristics of sources. Global Biogeochemical Cycles, 1; 61-86.
Mu, M., J.T. Randerson, G.R. van der Werf, L. Giglio, P. Kasibhatla, D. Morton, G.J. Collatz, R.S. DeFries, E.J. Hyer, E.M. Prins, D.W.T. Griffith, D. Wunch, G.C. Toon, V. Sherlock, and P.O. Wennberg. Daily and 3-hourly variability in global fire emissions and consequences for atmospheric model predictions of carbon monoxide. Journal of Geophysical Research-Atmospheres.116: D24303. doi:10.1029/2011JD016245. 2010.
Randerson, J. T., G. R. van der Werf, L. Giglio, G. J. Collatz, and P. S. Kasibhatla. 2007. Global Fire Emissions Database, Version 2 (GFEDv2.1). Data set. Available on-line [http://daac.ornl.gov/] from Oak Ridge National Laboratory Distributed Active Archive Center, Oak Ridge, Tennessee, U.S.A. doi:10.3334/ORNLDAAC/849.
Randerson, J. T., G. R. van der Werf, G .J. Collatz, L. Giglio, C. J. Still, P. Kasibhatla, J. B. Miller, J. W. C. White, R. S. DeFries, and E. S. Kasischke. 2005. Fire emissions from C3 and C4 vegetation and their influence on interannual variability of atmospheric CO2 and d13CO2. Global Biogeochemical Cycles. 19: GB2019, doi:10.1029/2004GB002366.
van der Werf, G. R., Randerson, J. T., Giglio, L., Collatz, G. J., Mu, M., Kasibhatla, P. S., Morton, D. C., DeFries, R. S., Jin, Y., and van Leeuwen, T. T.: Global fire emissions and the contribution of deforestation, savanna, forest, agricultural, and peat fires (1997–2009), Atmos. Chem. Phys., 10, 11707-11735, doi:10.5194/acp-10-11707-2010, 2010
van der Werf, G. R., J. T. Randerson, G. J. Collatz, L. Giglio, P. S. Kasibhatla, A. Avelino, S. C. Olsen, and E.S. Kasischke. 2004. Continental-scale partitioning of fire emissions during the 1997-2001 El Nino / La Nina period. Science, 303: 73-76.
van der Werf, G. R., J. T. Randerson, L.Giglio, G. J. Collatz, and P. S. Kasibhatla. 2006. Interannual variability in global biomass burning emission from 1997 to 2004, Atmospheric Chemistry and Physics, 6, 3423-3441. SRef-ID: 1680-7324/acp/2006-6-3423.