Get Data
Summary:
This data set includes the soil and vegetation characteristics, herbivore estimates, and precipitation measurement data for the 854 sites described and analyzed in Sankaran et al., 2005.
Savannas are globally important ecosystems of great significance to human economies. In these biomes, which are characterized by the co-dominance of trees and grasses, woody cover is a chief determinant of ecosystem properties. The availability of resources (water, nutrients) and disturbance regimes (fire, herbivory) are thought to be important in regulating woody cover but perceptions differ on which of these are the primary drivers of savanna structure.
Analyses of data from 854 sites across Africa (Figure 1) showed that maximum woody cover in savannas receiving a mean annual precipitation (MAP) of less than approximately 650 mm is constrained by, and increases linearly with, MAP. These arid and semi-arid savannas may be considered stable systems in which water constrains woody cover and permits grasses to coexist, while fire, herbivory and soil properties interact to reduce woody cover below the MAP-controlled upper bound. Above a MAP of approximately 650 mm, savannas are unstable systems in which MAP is sufficient for woody canopy closure, and disturbances (fire, herbivory) are required for the coexistence of trees and grass. These results provide insights into the nature of African savannas and suggest that future changes in precipitation may considerably affect their distribution and dynamics (Sankaran et al., 2005).
This data set includes the site characteristics and measurement data for the 854 sites described and analyzed in Sankaran et al., 2005. The data are provided in two formats, *.xls and *.csv. See the data format section below for more information.
A companion document composed of the supplemental documentation and figures provided with Sankaran et al., 2005 is also included (http://daac.ornl.gov/daacdata/global_vegetation/african_woody_savanna/comp/Woody_Cover.pdf).
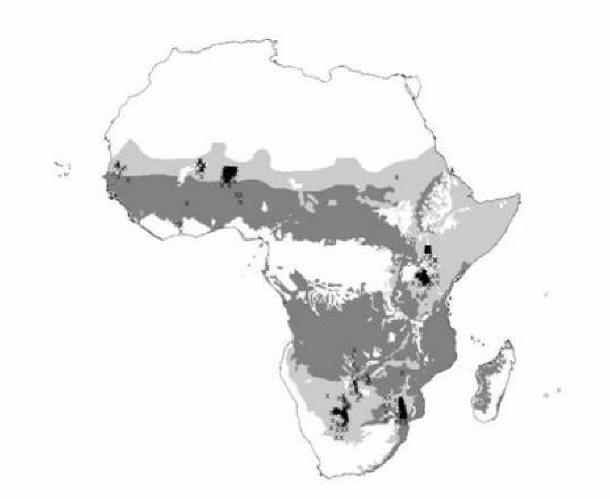
Figure 1. Map of Africa showing the location of 854 sample sites (indicated by crosses) used for the analysis. Light gray areas represent fine-leaved, nutrient-rich savannas; darker areas are broad-leaved, nutrient-poor savannas. The underlying map was derived from White’s vegetation map of Africa (White, 1983) by reclassifying woodland and wooded grassland map units into one or the other of the two savanna classes according to the dominant tree species. For display purposes, sites geographically close to one another have been jittered to facilitate discrimination of points. From Sankaran et al., 2005.
Data Citation:
Cite this data set as follows:
Sankaran, M., N. P. Hanan, and R. J. Scholes. 2007. Characteristics of African Savanna Biomes for Determining Woody Cover. Data set. Available on-line [http://www.daac.ornl.gov] from Oak Ridge National Laboratory Distributed Active Archive Center, Oak Ridge, Tennessee, U.S.A. doi:10.3334/ORNLDAAC/850.
References:
Sankaran, M., N. P. Hanan, R. J. Scholes, et al. 2005. Determinants of woody cover in African savannas. NATURE 438 (7069): 846-849.
White, F. The Vegetation of Africa: A Descriptive Memoir to Accompany the UNESCO/AETFAT/UNSO Vegetation Map of Africa (UNESCO, Paris, 1983).
Data Format:
This data set includes the site characteristics and measurement data for the 854 sites described and analyzed in Sankaran et al., 2005. The data are provided in two formats, *.xls and *.csv.
-
The nature04070-s4.xls file is the file provided as supplemental data for Sankaran et al., 2005.
-
The woody_cover_20070206.csv file has the same data value rows and columns as the *.xls file, but two new rows of column names and units were derived and edited slightly to improve usability and completeness. Also, the data provider notes regarding certain data sources and processing have been added as flag columns within the data file.
Data File Description for woody_cover_20070206.csv:
Column Names Units or Field Format Description Number of sites for which data are available. Region text Region of Africa 854 Country text Country name 854 Location text Local designation 843 Site text Study site identifier 854 Source text Source of site and measurement data 854 Lat decimal degrees Latitude (South latitude is "negative".) 854 Long decimal degrees Longitude (West longitude is "negative".) 854 MAP mm Mean annual precipitation, estimated from field measurements, regional maps, and climatic gridded products 854 MAP_data_flag text Mean annual precipitation data comment -- See Data User Note below Woody_cover percent The percentage of ground surface covered when crowns are projected vertically 854 Clay percent Soil texture determined on pooled samples 279 Sand percent Soil texture determined on pooled samples 175 Soil_N percent Soil percent nitrogen, including measured, other published and unpublished data 152 Total_P mg/kg Soil total phosphorus, including measured, other published and unpublished data 155 N_min_potential ug N/g soil/week Potential soil nitrogen mineralization rate 146 Fire_return yrs
Fire-return periods 854 Fire_return_data_source_flag text Fire return data source comment Herbivore_biomass kg/km2 Herbivore biomass density 183 Herbivore_biomass_data_flag text Herbivore biomass data comment Grazer_Biomass kg/km2 Grazer biomass density 131 Browser_and_mixed_feeder_biomass kg/km2 Browser and mixed feeder biomass density 131 Site_Description text General land use 851 Cover_method text Various methods, see companion document 854 Woody_cover_data_flag text Woody cover data processing comment Total_plot_size_or_Transect_length text, ha or m Text field with values such as "~0.5 ha" and "1250m transect". Sampling plot size or length of transect along which samples were collected 854 Depth_of_soil_measurements text, cm Text field with values such as "0 - 10 cm" and "0 - 100 cm". Range of depth of soil measurements 287 Dominant_woody_species text The map in Figure 1 was derived from White’s (1983) vegetation map of Africa by reclassifying woodland and wooded grassland map units into one or other of the two savanna classes according to the dominant tree species. Light gray areas represent fine-leaved, nutrient-rich savannas; darker areas are broad-leaved, nutrient-poor savannas. 463
Example Records from woody_cover_20070206.csv Data File: (Line breaks have been added to example to improve readability.)
Region,Country,Location,Site,Source,Lat,Long,MAP,MAP_data_flag,Woody_cover,Clay,Sand,Soil_N,Total_P,N_min_potential,
Fire_return,Fire_return_data_source_flag,Herbivore_biomass,Herbivore_biomass_data_flag,Grazer_biomass,
Browser_and_mixed_feeder_biomass,Site_Description,Cover_method,Woody_cover_data_flag,Total_plot_size_or_Transect_length,
Depth_of_soil_measurements,Dominant_woody_species
text,text,text,text,text,decimal degrees,decimal degrees,mm,text,percent,percent,percent,percent,mg/kg,ug N/g soil/week,
yrs,text,kg/km2,text,kg/km2,
kg/km2,text,text,text,"text, ha or m",
"text, cm",text
East Africa,Kenya,Baringo District,Njemps flats,"Ekaya, W - unpublished",1,36.125,650,,50,41.0,6.7,0.060,877.5,3.0,>20,,5000,,,,Pastoral area,visual estimates,,~0.5 ha,0 - 10 cm,Acacia tortillis
East Africa,Kenya,Kajiado,1,"Worden, J. - unpublished",-2.311,37.237,454,,42,36.3,58.6,0.054,479.5,4.6,15,,5205,,,,Pastoral area - grazed by domestic + native herbivores,visual estimates,,~0.5 ha,0 - 10 cm,Commiphora africana
East Africa,Kenya,Kajiado,2,"Worden, J. - unpublished",-2.303,37.238,454,,42,36.7,58.2,0.054,405.6,4.1,15,,5205,,,,Pastoral area - grazed by domestic + native herbivores,visual estimates,,~0.5 ha,0 - 10 cm,Commiphora africana
East Africa,Kenya,Kajiado,3,"Worden, J. - unpublished",-2.242,37.213,454,,37,33.1,63.2,0.045,383.3,8.6,15,,5205,,,,Pastoral area - grazed by domestic + native herbivores,visual estimates,,~0.5 ha,0 - 10 cm,Commiphora africana
East Africa,Kenya,Kajiado,4,"Worden, J. - unpublished",-2.226,37.176,454,,21,38.2,59.4,0.057,416.5,12.3,15,,5205,,,,Pastoral area - grazed by domestic + native herbivores,visual estimates,,~0.5 ha,0 - 10 cm,Commiphora africana
East Africa,Kenya,Mpala Research Centre,Kopi bush,"Augustine, D. J. - unpublished",0.296,36.880,469,,41.3,14.0,75.0,0.090,202.3,10.0,>20,,0,,0,0,Commercial rangeland; bushland site ungrazed since 1999,summed canopy area,"For sites where woody cover was estimated by summing canopy areas of individual plants, estimates were corrected for canopy overaps where significant to convert total canopy cover measurements to projected canopy cover (%ground surface covered when crowns are projected vertically).",0.5 ha,0 - 10 cm,Acacia mellifera
...
West Africa,Senegal,,C3L5,"Diouf, A. - unpublished / Diallo et al. (1991)",15.246,-14.581,490,Rainfall values in bold represent amounts estimated from fitted climate grids of the continent (ANU CRES data set),20.0,9.7,61.4,0.034,104.2,71.5,>10,,200,,,,Pastoral area,Line intercept,,1000m transect,0 - 10 cm,Pterocarpus erinaceus
West Africa,Senegal,,C4L8,"Diouf, A. - unpublished / Diallo et al. (1991)",13.521,-13.691,946,Rainfall values in bold represent amounts estimated from fitted climate grids of the continent (ANU CRES data set),33.0,,,,,,1,,300,,,,Pastoral area,Line intercept,,1000m transect,,Combretum glutinosum
Data User Note for Mali, West Africa, Sites:
The MAP data for the group of sites from Mali, West Africa, with the "Gourma 1" through "Gourma 31" site names were derived from measurements collected at the selected sites over the 1984-1993 time period. It should be noted that this period included several dry years, such that the MAP appears to be low relative to longer-term averages for the region. That is, some sites may have received more rainfall both before and after the 1984-1993 field measurement (rain gauge) data record.
Document Information:
(To be completed manually by Document Curator)Document Review Date:
2006/10/18
Document Curator:
webmaster@www.daac.ornl.gov