Documentation Revision Date: 2016-11-17
Data Set Version: R2
Summary
There are 16 files (16 years) of Collection 5 MODIS NDVI data products with this data set in netCDF 4 (.nc4) format.
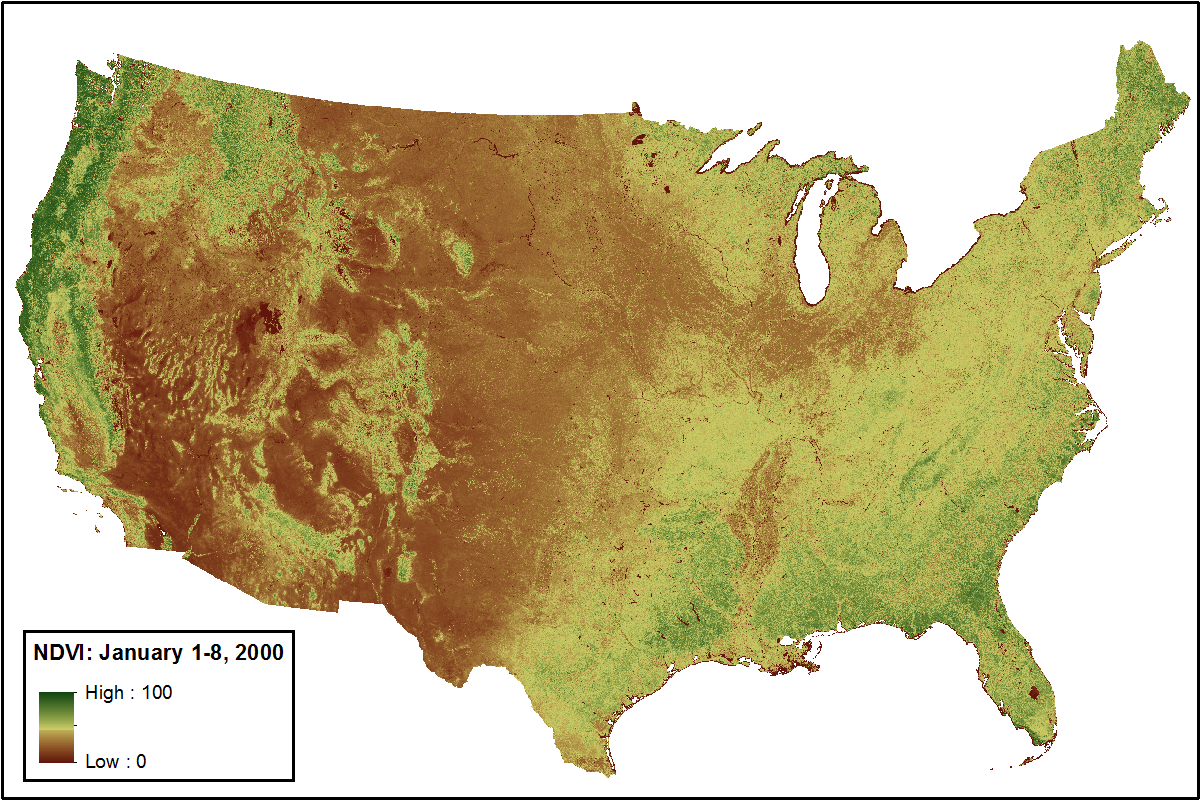
Figure 1. Smoothed and gap-filled NDVI for the conterminous US for the period January 1-8, 2000. NDVI is expressed as percent in this figure.
Citation
Spruce, J.P., G.E. Gasser, and W.W. Hargrove. 2016. MODIS NDVI Data, Smoothed and Gap-filled, for the Conterminous US: 2000-2015. ORNL DAAC, Oak Ridge, Tennessee, USA. http://dx.doi.org/10.3334/ORNLDAAC/1299
Table of Contents
- Data Set Overview
- Data Characteristics
- Application and Derivation
- Quality Assessment
- Data Acquisition, Materials, and Methods
- Data Access
- References
- Data Set Revisions
Data Set Overview
This data set provides Collection 5 MODIS NDVI data, smoothed and gap-filled, for the conterminous US for the period 2000-01-01 through 2015-12-31. The data were generated using the NASA Stennis Time Series Product Tool (TSPT) to generate NDVI data streams from the Terra and Aqua MODIS instruments. TSPT produces NDVI data that are less affected by clouds and bad pixels.
The TSPT is a MATLAB-based software application that computes and displays high-quality vegetation and environmental monitoring indices from high temporal revisit rate MODIS and other satellite sensors (McKellip et al., 2014; Prados et al., 2006). After TSPT was used, additional temporal processing was performed using another NASA Stennis MATLAB application known as the Phenological Parameters Estimation Tool (PPET) (McKellip et al., 2010).
The MOD13Q1 and MYD13Q1 products were obtained from the NASA EOSDIS Land Processes Distributed Active Archive Center ( LPDAAC) USGS/Earth Resources Observation and Science (EROS) Center, Sioux Falls, South Dakota, [https://lpdaac.usgs.gov/tools/data_access ].
Data Characteristics
Spatial Coverage
Conterminous United States
Spatial Resolution
Gridded, 250 m
Temporal Coverage
2000-01-01 through 2015-12-31.
Temporal Resolution
Every eight calendar days
Study Area (All latitudes and longitudes are given in decimal degrees)
| Study Area | Westernmost Longitude | Easternmost Longitude | Northernmost Latitude | Southernmost Latitude |
|---|---|---|---|---|
| Conterminous US | -119.712 | -62.5592 | 48.33889 | 22.18639 |
Data File Information
There are 16 data files in netCDF format (.nc4), one for each year, for the years 2000-2015. These are 8-day time series MODIS NDVI data, with the first date beginning January 1 of each year, and the last beginning December 27 (the last interval extends into the following year). There are 46 time intervals in each year.
For example, for the year 2011, the first interval is Jan 1 - Jan 8, 2011 and the last interval is Dec 27, 2011 - Jan 4, 2012.
The files are named MCD13.AYYYY.unaccum.nc4
Where:
MCD13=MODIS NDVI combined data from Aqua and Terra satellites
A=denotes that these are the best data from both the Terra and Aqua satellites
YYYY= year
unaccum= denotes that a process was applied to remove the contributory effect of the previous periods’ NDVI value from the current period’s NDVI values in the effort to isolate only the NDVI contribution for the current period.
Example: MCD13.A2013.unaccum.nc4
Spatial Data Properties
netCDF format (.nc4)
File type: raster
Number of bands: 1
Fill value: -1
Unit=unitless (index range 0 - 1)
Number Columns: 20,249
Number Rows: 14,276
Spatial Reference Properties
Type: Projected
Geographic Coordinate Reference: GCS_Sphere_Clarke_1866_Authalic
Projection: Lambert_Azimuthal_Equal_Area
Open Geospatial Consortium (OGC) Well Known Text (WKT):
PROJCS["US_National_Atlas_Equal_Area",
GEOGCS["GCS_Sphere_Clarke_1866_Authalic",
DATUM["Not_specified_based_on_Clarke_1866_Authalic_Sphere",
SPHEROID["Sphere_Clarke_1866_Authalic",6370997.0,0.0]],
PRIMEM["Greenwich",0.0],
UNIT["Degree",0.0174532925199433]],
PROJECTION["Lambert_Azimuthal_Equal_Area"],
PARAMETER["False_Easting",0.0],
PARAMETER["False_Northing",0.0],
PARAMETER["longitude_of_center",-100.0],
PARAMETER["latitude_of_center",45.0],
Application and Derivation
This highly polished phenology data set, complete for the 2000-2014 period, is used to generate phenoregions nationally, and is also used to support the ongoing products from the national ForWarn forest disturbance monitoring and tracking system. More info on ForWarn can be found at http://forwarn.forestthreats.org, and the ForWarn Forest Change Assessment Viewer (FCAV2) is available at http://forwarn.forestthreats.org/fcav2.
Quality Assessment
TSPT eliminates outlier data having greater than a user-defined deviation from prior values, and then fills data gaps by interpolating temporally between bookend observations. The smoothed, gap-filled data set that results is nearly complete, with few missing values, and is ideal for many phenological analyses and applications.
These data are ostensibly less affected by clouds and bad values than the standard MODIS products, although it is difficult to assess this other than by improved utility in applications.
Data Acquisition, Materials, and Methods
The Collection 5 MODIS NDVI data (MYD13Q1 and MOD13Q1 products) from the Aqua and Terra satellites were processed through the TSPT to remove clouds and otherwise clean and filter the time series temporally. The TSPT software enables the merging of MODIS Aqua and Terra data collected on a given day, which maximizes quality data retention. The TSPT version 2.0 is a MATLAB-based software application that computes and displays high-quality vegetation and environmental monitoring indices from high temporal revisit rate MODIS and other satellite sensors. The original purpose of the TSPT was to fuse MODIS Terra and Aqua products to improve the temporal interpolation and filtering of time series affected by clouds. TSPT provides single-timeframe and multi-temporal change images as time-series plots at a selected location, or as temporally processed image videos (McKellip et al., 2014; Prados et al., 2006).
The MOD13Q1 and MYD13Q1 products were obtained from the NASA EOSDIS Land Processes Distributed Active Archive Center (LP DAAC), USGS/Earth Resources Observation and Science (EROS) Center, Sioux Falls, South Dakota, [https://lpdaac.usgs.gov/tools/data_access].
Data Access
These data are available through the Oak Ridge National Laboratory (ORNL) Distributed Active Archive Center (DAAC).
MODIS NDVI Data, Smoothed and Gap-filled, for the Conterminous US: 2000-2015
Contact for Data Center Access Information:
- E-mail: uso@daac.ornl.gov
- Telephone: +1 (865) 241-3952
References
Land Processes Distributed Active Archive Center (LP DAAC). 2015. MODIS NDVI / EVI (MOD13Q1 and MYD13Q1) Products. NASA EOSDIS Land Processes Distributed Active Archive Center (LP DAAC), USGS/Earth Resources Observation and Science (EROS) Center, Sioux Falls, South Dakota, [https://lpdaac.usgs.gov/tools/data_access].
McKellip, R.D., J.P. Spruce, J.C. Smoot, G.E. Gasser, R.E. Ryan, K. Holekamp, and K.W. Ross. 2014. Time Series Product Tool (TSPT) Version 2.0, NASA Tech Briefs, 38 (11): 68, http://www.techbriefs.com/component/content/article/ntb/tech-briefs/information-sciences/20965 (accessed 12/17/2015).
McKellip, R.D., K.W. Ross, J.P. Spruce, J.C. Smoot, R.E. Ryan, G.E. Gasser, D.L. Prados, and R.D. Vaughan, 2010. Phenological Parameters Estimation Tool, NASA Tech Briefs, 34(9): 36-37, http://www.techbriefs.com/component/content/article/ntb/tech-briefs/software/8481 (accessed 12/17/2015).
Prados, D.L., R.E. Ryan, and K.W. Ross, 2006. Remote Sensing Time Series Product Tool, American Geophysical Union, Fall Meeting 2006, abstract #IN33B-1341, http://adsabs.harvard.edu/abs/2006AGUFMIN33B1341P (accessed 12/17/2015).
Data Set Revisions
This data set was initially published on December 12, 2015. A data file (MCD13.A2014.unaccum.nc) containing Collection 5 MODIS NDVI data for calendar year 2014 was added to this data set on March 24, 2016, extending the data set by one year to total 15 years of data. However, we noticed that there were zero values for 8-day periods at the end of the year for many MODIS cells in the data for the year 2014. To correct this error, on Nov 17, 2016, MCD13.A2014.unaccum.nc was replaced with an updated data file, which is complete in all locations where TSPT interpolation was possible. In addition, data file for calendar year 2015 (MCD13.A2015.unaccum.nc) was added to this data set, thus extending data set by another year to total 16 years of data. These two files, MCD13.A2014.unaccum.nc and MCD13.A2015.unaccum.nc, are identical in format to the other files within this data set.