Documentation Revision Date: 2016-06-02
Data Set Version: V1
Summary
Larch aboveground biomass was mapped using a combination of WorldView-1 imagery (WV-1), Landsat 5 imagery, 25 AGB field measurements, and outputs of a random forest model. A combination of Landsat reflectance values and band metrics (e.g., NDVI) were used as predictor data for the model.
The 116 fire scar perimeters were mapped using 59 Landsat scenes (WRS-2, path 104, rows 11–14) and additional data sets including topography, burned area, and vegetation productivity data. False-color images were used along with the normalized burn ratio (NBR) and normalized difference vegetation index (NDVI) to identify fire scars in the Landsat images. For fires that occurred between 2000-2007 the MODIS burned area product (MCD45A1) was used to identify the year of burn when possible.
There are two data files with this data set which includes the larch AGB map provided in GeoTIFF (.tif) format and the burn perimeter map provided in shapefile format (.shp).
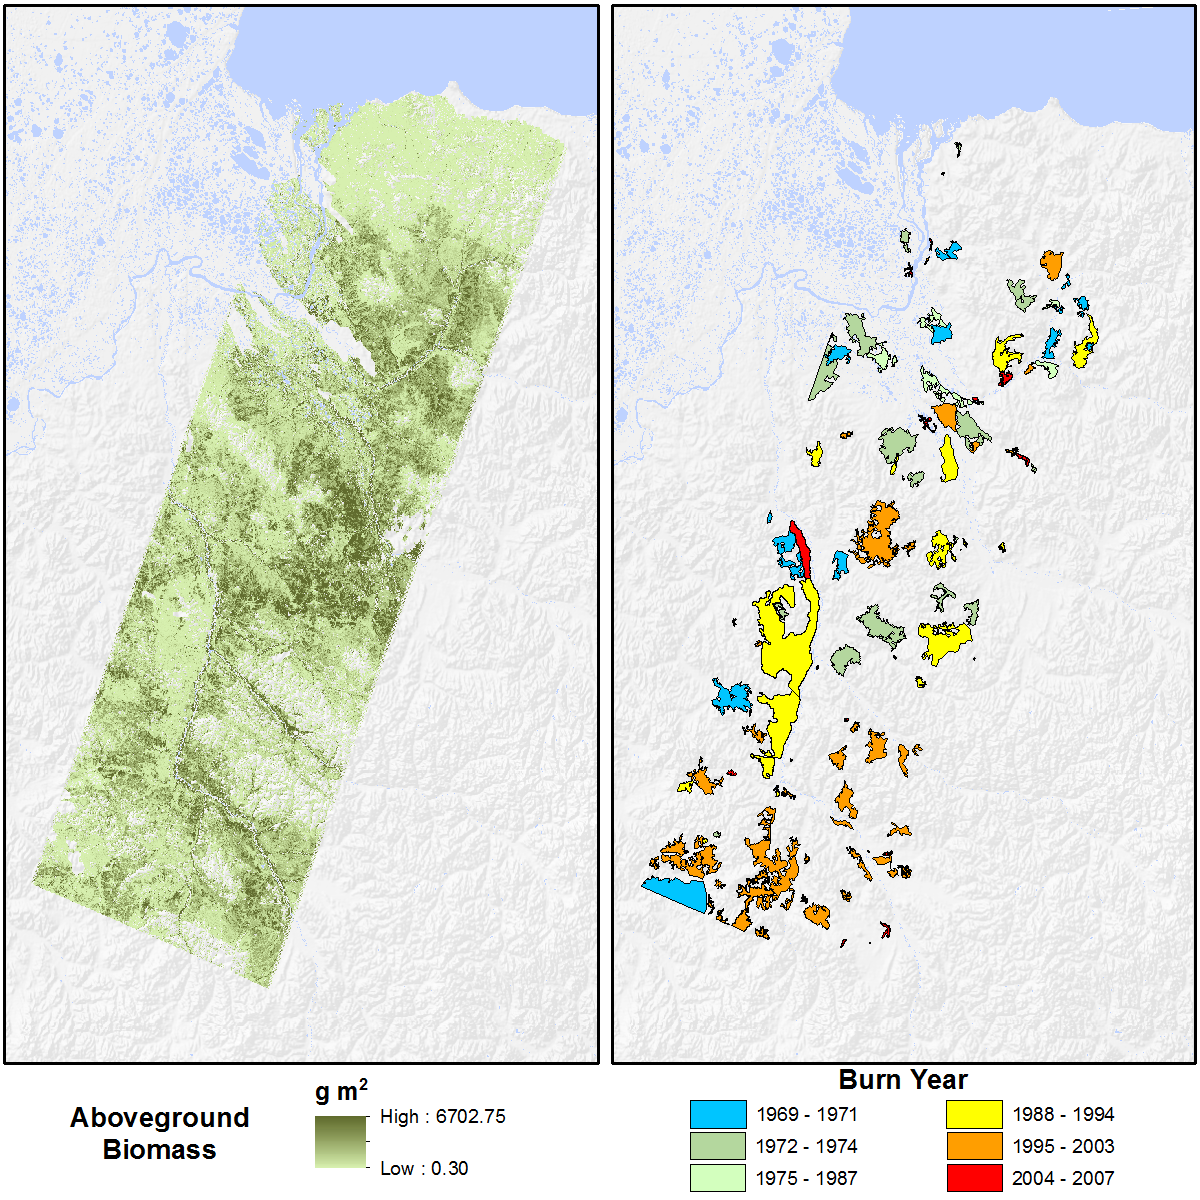
Figure 1. Kolyma River Basin study area maps: (L) Cajander larch aboveground biomass; (R) burn scar perimeters from fires circa 1966-2007 (Berner et al., 2012)
Citation
Berner, L.T., P.S.A. Beck, M.M. Loranty, H.D. Alexander, M.C. Mack, and S.J. Goetz. 2016. Siberian Boreal Forest Aboveground Biomass and Fire Scar Maps, Russia, 1969-2007. ORNL DAAC, Oak Ridge, Tennessee, USA. http://dx.doi.org/10.3334/ORNLDAAC/1321
Table of Contents
- Data Set Overview
- Data Characteristics
- Application and Derivation
- Quality Assessment
- Data Acquisition, Materials, and Methods
- Data Access
- References
Data Set Overview
This data set provides estimates of Cajander larch (Larix cajanderi) aboveground biomass circa 2007, as well as burn perimeters for 116 fires that occurred circa 1966-2007. The study area covered ~100,000 km2 of the Kolyma River Basin in northeastern Siberia in far northeastern Russia. Cajander larch is the only tree species in the study area and dominates the permafrost zone from the Lena River in Central Yakutia to the Sea of Okhotsk in the Far East (Krestov, 2003; Abaimov, 2010). Larch are a shade-intolerant deciduous needleleaf conifer capable of growing on permafrost and withstanding very short, cool growing seasons (Abaimov et al., 2000).
The 116 fire scar perimeters were mapped using 59 Landsat scenes (WRS-2, path 104, rows 11–14). Larch aboveground biomass was mapped using tree shadows mapped synergistically in WV-1 images, a Landsat mosaic, random forest modeled data, and 25 AGB measurements from studies collected during July 2010 and 2011 (Alexander et al., 2012; see Berner et al., 2012).
Acknowledgements. This work was supported by grants from the NASA Carbon Cycle and Ecosystems program (NNX08AG13G), NOAA Global Carbon Programme (NA08OAR4310526), NSF International Polar Year (0732954) and NSF OPP (76347).
Data Characteristics
Spatial Coverage
The study area covered ~100,000 km2 of the Kolyma River Basin in northeastern Siberia
Spatial Resolution: 30 m
Temporal Coverage: 1969-07-01 to 2007-07-26
Temporal Resolution: Annual
Study Area (All latitudes and longitudes are given in decimal degrees)
|
Site |
Westernmost Longitude |
Easternmost Longitude |
Northernmost Latitude |
Southernmost Latitude |
|
Kolyma River Basin, Sakha Republic, Russia |
156.611717 |
166.474444 |
69.89806 |
64.767754 |
Data File Descriptions
There is one GeoTIFF (.tif) and one shapefile (.shp) with this data set. The data sources used to derive these maps are provided in Table 1.
GeoTIFF file:
kolyma_landsat5_larch_AGB_gm2_2007.tif. The data depict Cajander larch (Larix cajanderi) aboveground biomass circa 2007. Pixel values are in grams per square meter.
Spatial data properties
Spatial Representation Type: Raster
Pixel Depth: 32 bit
Pixel Type: float
Compression Type: LZW
Number of Bands: 1
Raster Format: TIFF
No Data Value: -3.40E+38
Scale Factor: 1
Number Columns: 12701
Column Resolution: 30 meter
Number Rows: 21718
Row Resolution: 30 meter
Extent in the file's coordinate system:
North: 1204012.135
South: 552472.135
West: -147200.885
East: 233829.115
Extent in decimal degrees:
North: 69.8980555555556
South: 64.4575
West: 155.931944444444
East: 166.474444444444
Cell Geometry: area
Spatial Reference Properties:
Type: Projected
Projection: Albers_Conic_Equal_Area
Geographic Coordinate Reference: WGS 1984
Open Geospatial Consortium (OGC) Well Known Text (WKT):
PROJCS["unnamed",
GEOGCS["WGS 84",
DATUM["WGS_1984",
SPHEROID["WGS 84",6378137,298.257223563,
AUTHORITY["EPSG","7030"]],
AUTHORITY["EPSG","6326"]],
PRIMEM["Greenwich",0],
UNIT["degree",0.0174532925199433],
AUTHORITY["EPSG","4326"]],
PROJECTION["Albers_Conic_Equal_Area"],
PARAMETER["standard_parallel_1",25],
PARAMETER["standard_parallel_2",75],
PARAMETER["latitude_of_center",60],
PARAMETER["longitude_of_center",160],
PARAMETER["false_easting",0],
PARAMETER["false_northing",0],
UNIT["metre",1,
AUTHORITY["EPSG","9001"]]]
Shapefile:
kolyma_landsat_fires_1969_2007.zip: When unzipped, the shapefile contains six files (*.shx, *.dbf, *.prj, *.sbn, *.sbx, and *.shp). This shapefile shows the spatial extent of fires that occurred circa 1969-2007 in the Kolyma River Basin in northeastern Siberia and were derived from 30-m resolution Landsat imagery.
Parameters of the shapefile:
Geometry Type: Polygon
Geographic Coordinate System: GCS_WGS_1984
Datum: D_WGS_1984
Prime Meridian: Greenwich
Angular Unit: Degree
Projected Coordinate System: Kolym_Albers_Equal_Area_Conic
Projection: Albers
false_easting: 0.000
false_northing: 0.000
central_meridian: 160.000
standard_parallel_1: 25.000
standard_parallel_2: 75.000
latitude_of_origin: 60.000
Linear Unit: Meter
Extent in file’s coordinate system:
North: 1156315.971132
South: 583637.449861
West: -145868.013909
East: 178927.925891
Extent in decimal degrees:
North: 69.506823
South: 64.767754
West: 156.611717
East: 164.669443
Attributes:
FID: Internal feature number; sequential unique whole numbers that are automatically generated
Shape: Feature geometry
preImg: The year of the most recent pre-fire Landsat scene in which the area that later burned was visible.
postImg: The year of the first post-fire Landsat scene in which the burned area was visible.
burnYr: Year of fire occurrence
range: The uncertainty (in years) of the estimated burn year (i.e., the actual year in which the fire occurred could have been between burnYr – range and burnYr + range). range equals zero for fires that (1) were picked up by MODIS active fire, (2) drove a notable depression in NDVI, or (3) when Landsat scenes were available for two sequential years and timing of the pre-fire image (e.g. late fall) made it highly probably that the fire occurred the year of the post-fire image. Otherwise, range value was derived from the pre- and post-fire images.
fullFire: Indicates if the entire burned area occur within the study area. Some fires straddled multiple Landsat scenes and thus only partial potions that fell within the study area were mapped. This attribute exists so partial fires could be excluded when calculating statistics related to fire size.
lon: Polygon centroid longitude
lat: Polygon centroid latitude
area_km2: Area of fire in square kilometers
notes: Additional information about the record
Table 1. Landsat and geospatial data used to derive the data sets.
|
|
Satellite or Data Set |
Data Acquisition |
Scenes (n) |
Resolution (m) |
|
Biomass Mapping |
WorldView-1 (WV-1) Landsat 5 TM |
21 April 2009 26 July 2007 |
7 4 |
0.5 30 |
|
Fire Scar Mapping |
Landsat 7 ETM+ Landsat 5 TM |
1999–2004 1995 2005 |
26 21 |
30 30 |
|
Fire Scar Mapping |
Landsat 1–3 MSS |
2006, 2007 1972-1974 |
12 |
79 |
|
Ancillary Data Sets |
||||
|
Maps |
Digital Elevation Model (ASTER)
|
Composite 2000–2008+
|
1 |
30 |
|
Fire Scar Mapping |
Burned Area (MODIS MCD43A1 v5 product)
|
Monthly 2000-2007
|
96 |
500 |
|
Fire Scar Mapping |
NDVI(GIMMS AVHRR) |
Biweekly 1981–2007 |
636 |
8×10³ |
Application and Derivation
These data are of value to climate modeling. Quantifying climate impacts associated with forest disturbances in Siberia necessitates understanding forest biomass distribution, disturbance regimes and post-disturbance ecosystem recovery; however, there is considerable uncertainty in each of these areas (Berner et al., 2012).
Quality Assessment
Field measurements of larch aboveground biomass against biomass estimates derived from satellite imagery were compared to AGB field data from 25 sites and there was strong agreement (r2=0.91, p<0.001, RMSE=622 g/m2; see Berner et al., 2012).
Data Acquisition, Materials, and Methods
Site description
The study area covered approximately 100,000 km2 of the Kolyma River watershed in far northeastern Russia. The region is underlain by continuous permafrost and has a cold, dry and continental climate (Berner et al., 2012).
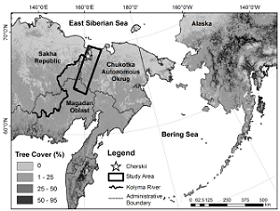
Figure 2. The lower Kolyma River watershed study area (Berner et al., 2012).
Cajander larch is the only tree species in the study area and dominates the permafrost zone from the Lena River in Central Yakutia to the Sea of Okhotsk in the Far East (Krestov, 2003; Abaimov, 2010). Larch are a shade-intolerant deciduous needleleaf conifer capable of growing on permafrost and withstanding very short, cool growing seasons (Abaimov et al., 2000). In northeastern Siberia these trees are generally <10m tall and AGB rarely exceeds 10 kg per m2 (Kajimoto et al., 2010). Trees can annually produce up to 65 kg per ha of wind-dispersed seeds (Abaimov, 2010). Forest succession after stand replacing fires generally involves a multi-decadal shrub stage, followed by larch re-achieving dominance 20–50 yr after fire (Zyryanova et al., 2007; Alexander et al., 2012).
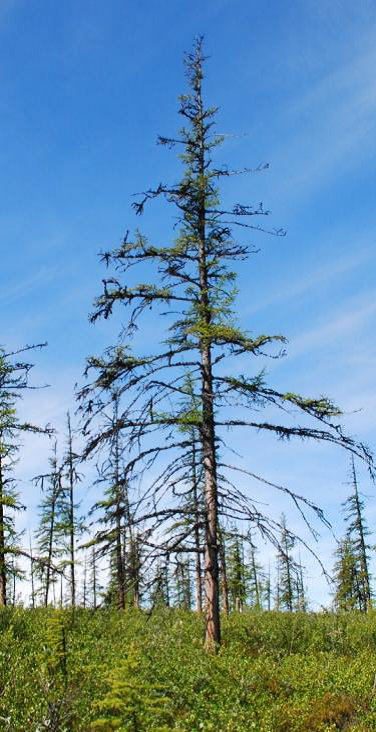
Figure 3. Cajander larch in the Kolyma Basin (image from Berner et al., 2013).
Satellite and geospatial data for biomass mapping
Image processing
Biomass mapping was based on four along-track Landsat 5 scenes acquired on 26 July 2007. These were the most recent cloud and smoke-free images available for the region and defined the spatial extent of the study area. The scenes were converted from surface radiance to top of atmosphere reflectance using the Landsat calibration tool in ENVI (ITT Visual Information Solutions, v4.8). Water bodies, clouds, cloud shadows and steep north-facing slopes where shadows obscured underlying vegetation were masked. Water bodies were identified using a 30-class isodata unsupervised clustering algorithm with a minimum class-size of 20 pixels and then buffered one pixel outward to ensure complete removal. Clouds and cloud shadows were manually delineated and excluded. Shadowed northern slopes were removed based on topography by selecting areas with slope >15 degrees and aspect either >270 or <45 degrees. Landsat preprocessing resulted in a radiometrically calibrated image mosaic void of water bodies, clouds and areas shaded by clouds and mountains.
Seven Panchromatic WorldView-1 (WV-1) images with a nadir spatial resolution of 50-cm were provided by the University of Minnesota Polar Geospatial Center. The seven images, which covered approximately 2,150 km2, were acquired at local noon on 21 April 2009, with an average off nadir view angle of 2 degrees. The WV-1 images came orthorectified and calibrated to top of atmosphere reflectance. The six contiguous images were mosaicked and then co-registered to the Landsat mosaic to ensure proper geographical overlap. Co-registration involved identifying 50 matching points. The WV-1 mosaic was warped using a first-order polynomial (RMSE = 16.7 m). It was not necessary to adjust the georeferencing of the single noncontiguous WV-1 scene. The Landsat water mask and the topography shadow mask were applied and digitized, then two small urban zones were removed from the analysis.
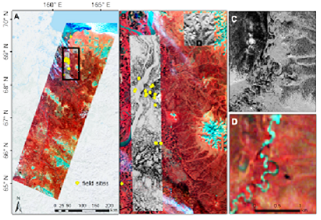
Figure 4. Maps of the Kolyma River watershed showing the field site locations (yellow dots): (A) Landsat 5 imagery, (B) WorldView-1 imagery. To illustrate the large difference in spatial resolution between sensors, Panels C and D show close-up views for WorldView-1 and Landsat 5, respectively. The Landsat 5 imagery is displayed using bands 4, 3, 1 (RGB) (Berner et al., 2012). The field sites indicated in the images were located near Cherskii, in the Sakha Republic (Yakutia). The study area also included in the mountainous Chukotka Autonomous Okrug and Magadan Oblast.
Biomass mapping
AGB was mapped using WV-1 images, Landsat, and a random forest model:
- In the WV-1 images, individual trees and tree shadows contrasted sharply with the bright, snow-covered land surface. After testing a series of threshold values, pixels were classified as tree shadow if reflectance was between 0.17 and 0.37. This resulted in a 50-cm resolution binary map showing tree shadow and non-tree shadow.
- The tree shadow map was then aggregated to 30-m resolution to match the footprint of the Landsat mosaic (TSFLS) that covered an area about 50 times that of the WV-1 scenes. This involved calculating the percent of each 30×30-m pixel that was classified as tree shadow. This value was defined as TSFWV.
- Following the calculation of TSFWV, 2,500 points were randomly selected that were spaced at least 30-m apart and were stratified by three TSFWV classes (0–1 %, 1–30 %, and 30–100 %).
- The underlying TSF pixel values were then extracted and used to train (n = 2000) and evaluate (n = 500) a random forest model to predict TSFLS from the Landsat data.
Random Forest model
A combination of Landsat reflectance values and band metrics (e.g., NDVI) were used as predictor data for the random forest model. Random Forests are a form of classification and regression analysis where many decision trees are constructed using bootstrap sampling, with the final prediction determined based upon “votes” cast by each tree.
- The randomForest package in R was used to build 500 decision trees, with five predictor variables randomly selected and tested at each node of each tree.
- Model performance was evaluated by regressing TSFLS by TSFWV for 500 points not used in model construction.
- The calibrated Random Forest model yielded a map of TSFLS that was then compared with AGB field measurements. Fieldwork was conducted near Cherskii, in the Sakha Republic (Yakutia) and also portions of the mountainous Chukotka Autonomous Okrug and Magadan Oblast. In July 2010 Alexander et al., 2012 inventoried 17 larch sites and in 2011, Bunn and Frey (unpublished) inventoried eight additional sites (Berner et al., 2012). Field estimates of larch AGB were derived from allometric equations that related diameter at breast height to AGB (Alexander et al., 2012 ).
- A least-squared linear regression equation was then used to linearly transform the map of TSFLS into a map of AGB (Berner et al., 2012).
Fire scar perimeter mapping
Fire scar perimeter mapping was based on 59 Landsat scenes that were acquired either 1972-1974 (n = 12) (Landsat 1-2 MSS) or 1995–2007 (n = 47) (Landsat 5 TM). Landsat data are not available from 1975-1995 across eastern Siberia because there were no operational ground receiving stations. Furthermore, there were no Landsat images available for the southernmost quarter of the study area (path 104, row 14) until 1999 (Landsat 7 ETM+). The Landsat images that were used to map fires were acquired between June and September, preferentially under cloud-free conditions late in the growing season.
Additional geospatial data sets were also used including topography, burned area, and vegetation productivity data (Table 1). The topography data set was the 1 arc-second (approx 30- m) digital elevation model (DEM) generated by the Japanese Ministry of Economy, Trade and Industry and NASA from Advanced Spaceborne Thermal Emission and Reflection Radiometer data (ASTER GDEM v2) (Meyer et al., 2011). The burned area MODIS data set, which spanned 2000-2007, was the 500-m monthly burned area product (MCD43A1 v5) generated from Moderate Resolution Imaging Spectroradiometer (MODIS) sensors carried aboard NASA’s Aqua and Terra satellites. A normalized difference vegetation index (NDVI) data set generated from Advanced Very High Resolution Radiometer (AVHRR) data by NASA’s Global Inventory Modeling and Mapping Studies (GIMMS v3G) project (Tucker et al., 2005) was used as a proxy for vegetation productivity. This 8-km resolution biweekly data set runs from 1981 through to the present.
Fire scar identification:
- The 59 Landsat images were first sorted into four regions based on the WRS-2 grid (path 104, rows 11–14). Each stack of images was then visually inspected in chronological order.
- False-color images were used along with the normalized burn ratio (NBR) and NDVI to identify fire scars. The band combinations 7-5-2 (L5 and L7) and 3-4-2 (L1-L3) proved useful for identifying fire scars, as were the band metrics, which were calculated as NDVI = (RNIR – Rred) / (RNIR + Rred) and NBR = (RNIR – RSWIR) / (RNIR + RSWIR).
- Fire scar perimeters were hand-digitized at a scale of 1 : 150 000 or 1 : 60 000, depending on the fire size and perimeter complexity, and then the fire scar perimeters were spatially adjusted to align with the Landsat 5 image used to map biomass.
- For each fire scar, the period of time during which the fire occurred was determined by recording the year of the pre-fire and post-fire Landsat images. For fires that occurred between 2000-2007 the MODIS burned area product (MCD45A1) was used to identify the year of burn when possible.
- Large fires that occurred between 1981-2000 were dated by using GIMMS-NDVI to identify when NDVI rapidly dropped and stayed low relative to surrounding areas. Fire scars were generally visible in NIR for about six years following fire. For fresh fire scars visible in the earliest available imagery, or immediately after the Landsat blackout period, the fires were estimated that had occurred anytime during the preceding six years. If fires occurred during the Landsat blackout period, but were not visible in post-1995 NIR imagery, they were estimated to have occurred during the 1980s.
- The burn year was estimated when smoke trails were not visible and when it was not possible to date fires based on MODIS or GIMMS.
- To determine fire scars circa 1966-2007, fire rotation and density were calculated across the northern quarter of the study area since the spatial coverage of Landsat imagery was incomplete prior to 1999. Fire rotation is the average number of years necessary to burn an area equivalent in size to the area of interest and is calculated by dividing the time period by the fraction of the landscape that burned during that period (Heinselman, 1973). Fire density was calculated as the number of fire scars formed in a given year divided by the area over which they occurred. In basing these calculations on the circa 1966-2007 time period, it was assumed that fires visible in the 1972 imagery occurred within the preceding six years (Berner et al., 2012).
Data Access
This data is available through the Oak Ridge National Laboratory (ORNL) Distributed Active Archive Center (DAAC).
Siberian Boreal Forest Aboveground Biomass and Fire Scar Maps, Russia, 1969-2007
Contact for Data Center Access Information:
- E-mail: uso@daac.ornl.gov
- Telephone: +1 (865) 241-3952
References
Abaimov, A. P. Geographic Distribution and Genetics of Siberian Larch Species, in: Permafrost Ecosystems: Siberian Larch Forests, edited by: Osawa, A., Zyryanova, O. A., Matsuura, Y., Kajimoto, T., and Wein, R.W., Springer, New York, 41–55, 2010.
Abaimov, A. P., Zyryanova, O. A., Prokushkin, S. G., Koike, T., and Matsuura, Y. Forest Ecosystems of the Cryolithic Zone of Siberia: Regional Features, Mechanisms of Stability and Pyrogenic Changes, Eur. J. Forest Res., 1, 1–10, 2000.
Alexander, H., Mack, M., Goetz, S., Loranty, M., Beck, P., Earl, K., Zimov, S., Davydov, S., and Thompson, C. Carbon Accumulation Patterns During Post-Fire Succession in Cajander Larch (Larix cajanderi) Forests of Siberia, Ecosystems, 1–18, doi:10.1007/s10021-012-9567-6, 2012.
Berner, L., P. Beck, A. Bunn, and S. Goetz. Impacts of climate change on plant productivity in the Cajander larch woodlands of northeastern Eurasia, American Geophysical Union presentation, 2013.
Berner, L.T., P.S.A. Beck, M.M. Loranty, H. D. Alexander, M.C. Mack, and S,J. Goetz. 2012. Cajander larch (Larix cajanderi) biomass distribution, fire regime and post-fire recovery in northeastern Siberia. Biogeosciences, 9, 3943-3959, 2012. Doi: 10.5194/bg-9-3943-2012
Heinselman, M. L. Fire in the virgin forests of the Boundary Waters Canoe Area, Minnesota, Quaternary Res., 3, 329–382, doi:10.1016/0033-5894(73)90003-3, 1973.
Kajimoto, T., Osawa, A., Usoltev, V. A., and Abaimov, A. P. Biomass and Productivity of Siberian Larch Forest Ecosystems, in: Permafrost Ecosystems: Siberian Larch Forests, edited by: Osawa, A., Zyryanova, O. A., Matsuura, Y., Kajimoto, T., and Wein, R. W., Springer, New York, 99-122, 2010.
Krestov, P. V.: Forest Vegetation of Easternmost Russia (Russian Far East), in: Forest Vegetation of Northeast Asia, edited by: Kolbek, J., Srutek, M., and Box, E., 28, Kluwer, Dordrecht, 93-180, 2003.
Meyer, D., Tachikawa, T., Kaku, M., Iwasaki, A., Gesch, D., Oimoen, M., Zheng, Z., Danielson, J., Krieger, T., Curtis, W., Haase, J., Abrams, M., Crippen, R., and Carabaja, C. ASTER Global Digital Elevation Model Version 2-Summary of Validation Results, Japan-US ASTER Science Team, 1-26, 2011
Tucker, C., Pinzon, J., Brown, M., Slayback, D., Pak, E., Mahoney, R., Vermote, E., and El Saleous, N. An extended AVHRR 8-km NDVI dataset compatible with MODIS and SPOT vegetation NDVI data, Int. J. Remote Sens., 26, 4485-4498,doi:10.1080/01431160500168686, 2005.
Zyryanova, O. A., Yaborov, V. T., Tchikhacheva, T. I., Koike, T., Makoto, K., Matsuura, Y., Satoh, F., and Zyryanov, V. I. The Structural and Biodiversity after Fire Disturbance in Larix gmelinii (Rupr.) Rupr. Forests, Northeast. Asia Eur. J. Forest Res., 10, 19–29, 2007.