Get Data
Revision Date: June 25, 2014
Summary:
This global data set of photosynthetic rates and leaf nutrient traits was compiled from a comprehensive literature review. It includes estimates of Vcmax (maximum rate of carboxylation), Jmax (maximum rate of electron transport), leaf nitrogen content (N), leaf phosphorus content (P), and specific leaf area (SLA) data from both experimental and ambient field conditions, for a total of 325 species and treatment combinations. Both the original published Vcmax and Jmax values as well as estimates at standard temperature are reported.
The maximum rate of carboxylation (Vcmax) and the maximum rate of electron transport (Jmax) are primary determinants of photosynthetic rates in plants, and modeled carbon fluxes are highly sensitive to these parameters. Previous studies have shown that Vcmax and Jmax correlate with leaf nitrogen across species and regions, and locally across species with leaf phosphorus and specific leaf area, yet no universal relationship suitable for global-scale models is currently available.
These data are suitable for exploring the general relationships of Vcmax and Jmax with each other and with leaf N, P and SLA. This data set contains one *.csv file.
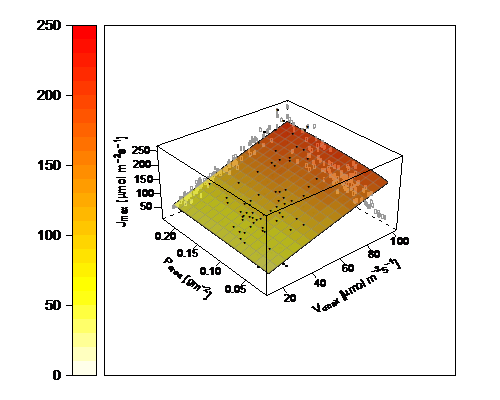
Figure 1. The relationship between Jmax and Vcmax as modified by leaf P, from Walker et al. 2014.
Data and Documentation Access:
Get Data: http://daac.ornl.gov/cgi-bin/dsviewer.pl?ds_id=1224
Data Citation:
Cite this data set as follows:
Walker, A.P., I. Aranda, A.P. Beckerman, H. Bown, L.A. Cernusak, Q.L. Dang, T.F. Domingues, L. Gu, S. Guo, Q. Han, J. Kattge, M. Kubiske, D. Manter, E. Merilo, G. Midgley, A. Porte, J.C. Scales, D. Tissue, T. Turnbull, C. Warren, G. Wohlfahrt, F.I. Woodward, and S.D. Wullschleger. 2014. A Global Data Set of Leaf Photosynthetic Rates, Leaf N and P, and Specific Leaf Area. Data set. Available on-line [http://daac.ornl.gov] from Oak Ridge National Laboratory Distributed Active Archive Center, Oak Ridge, Tennessee, USA. http://dx.doi.org/10.3334/ORNLDAAC/1224
Table of Contents:
- 1 Data Set Overview
- 2 Data Characteristics
- 3 Applications and Derivation
- 4 Quality Assessment
- 5 Acquisition Materials and Methods
- 6 Data Access
- 7 References
1. Data Set Overview:
This global data set of photosynthetic rates and leaf nutrient traits was compiled from a comprehensive literature review. It includes estimates of Vcmax (maximum rate of carboxylation), Jmax (maximum rate of electron transport), leaf nitrogen content (N), leaf phosphorus content (P), and specific leaf area (SLA) data from both experimental and ambient field conditions, for a total of 325 species and treatment combinations. Both the original published Vcmax and Jmax values as well as estimates at standard temperature are reported.
The maximum rate of carboxylation (Vcmax) and the maximum rate of electron transport (Jmax) are primary determinants of photosynthetic rates in plants, and modeled carbon fluxes are highly sensitive to these parameters. Previous studies have shown that Vcmax and Jmax correlate with leaf nitrogen across species and regions, and locally across species with leaf phosphorus and specific leaf area, yet no universal relationship suitable for global-scale models is currently available.
Table 1. List of data contributors.
| Contributors | Afiliation |
|---|---|
| Anthony P. Walker (alp@ornl.gov) | Environmental Sciences Division, Oak Ridge National Laboratory, USA & Department of Animal and Plant Sciences, University of Sheffield, UK |
| Ismael Aranda | Instituto Nacional de Investigacion y Tecnologia Agraria y Alimentaria (INIA-CIFOR), Madrid, Spain) |
| Andrew P. Beckerman | Department of Animal and Plant Sciences, University of Sheffield, UK |
| Horacio Bown | Facultad de Ciencias Forestales y Conservación de la Naturaleza, Universidad de Chile, Santiago, Chile |
| Lucas A. Cernusak | Department of Marine and Tropical Biology, James Cook University, Australia |
| Qing-Lai Dang | Faculty of Natural Resources Management, Lakehead University, Canada |
| Tomas F. Domngues | Depto. de Biologia, Faculdade de Filosofia, Ciências e Letras de Ribeirão Preto, Brasil |
| Lianhong Gu | Environmental Sciences Division, Oak Ridge National Laboratory, USA |
| Shiwei Guo | Nanjing Agricultural University, Nanjing, Jiangsu Province, China |
| Quingmin Han | Hokkaido Research Center, Forestry and Forest Products Research Institute (FFPRI), Japan |
| Jens Kattge | Max Plank Institute for Biogeochemistry, Germany |
| Mark Kubiske | U.S. Forest Service, Northern Research Station, USA |
| Daniel Manter | USDA-ARS, Soil-Plant-Nutrient Research, USA |
| Ebe Merilo | Institute of Botany and Ecology, Tartu University, Estonia |
| Guy Midgley | Climate Change and Bioadaptation Division, The South African National Biodiversity Institute, South Africa |
| Annabel Porté | French National Institute for Agricultural Research (INRA), and Université de Bordeaux, France |
| Joanna C. Scales | Plant Biology and Crop Science, Rothamsted Research, UK |
| David Tissue | Hawkesbury Institute for the Environment, University of Western Sydney, Australia |
| Tarryn Turnbull | Department of Environmental Sciences, University of Sydney, Australia |
| Charles Warren | School of Biological Sciences, The University of Sydney, Australia |
| Georg Wohlfahrt | Institute of Ecology, University of Innsbruck, Austria |
| F. Ian Woodward | Department of Animal and Plant Sciences, University of Sheffield, UK |
| Stan D. Wullschleger | Environmental Sciences Division, Oak Ridge National Laboratory, USA |
2. Data Characteristics:
Spatial Coverage
Latitude, longitude and elevation are provided for each study site.
Temporal Coverage
Compilation from published measurements taken between 1993/01/01 to 2010/12/31.
Temporal Resolution
None
Site boundaries: (All latitude and longitude given in degrees and fractions)
| Site (Region) | Westernmost Longitude | Easternmost Longitude | Northernmost Latitude | Southernmost Latitude |
|---|---|---|---|---|
| Global | -122.40 | 176.13 | 58.42 | -43.2 |
Data File Information
There is one data file in this data set archive: Leaf_Photosynthesis_Traits.csv. The data set is in comma-separated values format (*.csv) and the file is <1 MB in size. Missing data in all numeric columns are represented by -9999.99. Full literature citations referred to in the data file are provided at the end of this guide document.
Table 2. Parameters in the data file.
Missing values are reported as -9999.
| Column | Name | Units/format | Description |
|---|---|---|---|
| 1 | Author | Study author and year (full citations provided in Table 3) | |
| 2 | Species | Taxonomic name of plant species | |
| 3 | Plant_taxonomy | categorical | A = Angiosperm or G = Gymnosperm |
| 4 | Plant_type | categorical | Coded following the classification used by Domingues et al 2010: A = crop, D = deciduous, E = evergreen, F = forb, G = grass, SD = semi-deciduous |
| 5 | Longitude | decimal degrees | Longitude of study site |
| 6 | Latitude | decimal degrees | Latitude of study site |
| 7 | Elevation | meters | Elevation of study site |
| 8 | Measurement year | Year measurements were taken, if known | |
| 9 | Vcmax_reported | umol/m2/s | Vcmax value reported in published study |
| 10 | Jmax_reported | umol/m2/s | Jmax value reported in published study |
| 11 | Vcmax_25C | umol/m2/s | Standardized estimate from Walker et al 2014 |
| 12 | Jmax_25C | umol/m2/s | Standardized estimate from Walker et al 2014 |
| 13 | Leaf_N | g/m2 | Leaf nitrogen concentration reported in published study |
| 14 | Leaf_P | g/m2 | Leaf phosphorous concentration reported in published study |
| 15 | SLA | m2/g | Specific leaf area reported in published study |
| 16 | Needle_age | years | Gymnosperms only: age of the needle, if known. |
| 17 | Treatment_CO2 | categorical | Experimental CO2 treatment from original study, if applicable: amb = ambient, ele = elevated |
| 18 | Treatment_N | categorical | Experimental nitrogen treatment from original study, if applicable (refer to original study for details) |
| 19 | Treatment_P | categorical | Experimental phosphorous treatment from original study, if applicable (refer to original study for details) |
| 20 | Treatment_light | categorical | Experimental light or canopy treatment from original study, if applicable (refer to published study for details) |
| 21 | Treatment_other | Other experimental treatment applied | |
| 22 | Treatment_other_levels | level of other experimental treatment applied | |
| 23 | Measurement_temperature | degrees C | Temperature at which the parameters were reported in the manuscript. Where a range of values was reported, the reported temperature was corrected to a standard temperature using a temperature sensitivity function |
| 24 | Photosynthetic_reference | Literature source for photosynthetic parameter temperature correction | |
| 25 | Kinetic_reference | Literature source for kinetic parameter temperature function. | |
| 26 | Km | Pa | Michaelis-Menten constant for RuBisCO (Km = Kc(1 + O/Ko)) |
| 27 | Kc | Pa | Michaelis-Menten constant of RuBisCO for CO2 (see Walker et al 2014) |
| 28 | Ko | kPa | Michaelis-Menten constant of RuBisCO for O2 (see Walker et al 2014) |
| 29 | Tau | unitless | Carboxylation to oxygenation ratio |
| 30 | Gamma_star | Pa | CO2 compensation point in the absence of dark respiration (gamma*) |
| 31 | Wj_reference | Literature source for function to describe light limited rate
of carboxylation. Standard equation: J= J ( Ci-gamma*)/(4 Ci+8gamma* |
|
| 32 | J_reference | Literature source for function that describes electron transport rate as a function of incident photosynthetically active radiation | |
| 33 | J_flag | If yes, the original study reported J (actual rate of electron transport at saturating CO2) and Walker calculated the values reported in column “Jmax_reported” | |
| 34 | Irradiance | W/m2 | Values reported by original study |
| 35 | Alpha | mol e/mol photons | Apparent quantum yield (alpha) values reported by original study |
| 36 | Theta | unitless | Curvature of light response (theta) values reported by original study |
| 37 | O2_reported | kPa | O2 partial pressure values reported by original study |
| 38 | Notes | ||
3. Data Application and Derivation:
These data are suitable for exploring relationships of Vcmax and Jmax with each other and with leaf N, P and SLA.
4. Quality Assessment:
While the general relationship between Vcmax and Jmax is robust across data sets, there is substantial variation of individual species data from this relationship. Some of this variation may arise due to measurement error or temperature sensitivity. The study authors measured the temperature sensitivity of carbon assimilation by comparing predictions from Jmax and Vcmax standardized to 25°C to predictions based on the original data. Errors introduced by the standardisation were well within the measurement error of A/Ci curves (see Walker et al. 2014 Supplementary material 1 for details). Results were compared to relationships in the TRY database (Kattge et al 2011) and A/Ci curves reported by Wullschleger (1993).
5. Data Acquisition Materials and Methods:
The data in this compilation are based on a comprehensive literature survey. The aim was to find papers that had simultaneously measured as many of the following leaf traits: Vcmax, Jmax, leaf N, leaf P and specific leaf area (SLA) or leaf mass to area ratio (LMA). Minimum requirements for inclusion in this data set were that either Vcmax or Jmax were calculated from A/Ci curves along with two of the other three leaf traits. This literature search yielded data from 25 papers published between 1998 and 2011, represemting 135 species by location combinations, distributed globally (Table 3). Some of these data were collected on plants in their natural environment and subject to natural environmental variation, while other data were collected on lab grown plants (mostly tree species) subjected to experimental treatments. The majority of the species used in the greenhouses and labs were native to the area of the research centre. Either species means or treatment means were collected leading to a dataset of 325 species by treatment combinations.
Using a method (detailed in the supplementary material of Walker et al. 2014) similar to Kattge & Knorr (2007), the authors removed the variation in Vcmax and Jmax across studies caused by different parametric assumptions by standardizing Vcmax and Jmax to a common set of kinetic parameters. They also corrected Vcmax and Jmax to a common measurement temperature of 25 degrees C and to the O2 partial pressure at the measurement elevation. To generate a larger SLA data set where leaf mass per unit area (LMA) was reported, LMA was converted to SLA by taking the reciprocal.
Table 3: Data sources, study locations, and experimental manipulations included in this compilation. PFT abbreviations: Temp – temperate, Trop – tropical, Ev – evergreen, Dc – deciduous, Nl – needleleaf tree, Bl – broadleaf tree.
| Reference | Num. species | PFT | Long (degrees) | Lat (degrees) | Elevation (m) | Location | Country | Experiment | N | P |
|---|---|---|---|---|---|---|---|---|---|---|
| Aranda et al. 2005 | 1 | Temp Ev Bl | -3.43 | 39.23 | 650 | Alburquerque | Spain | light * water | y | n |
| Bauer et al. 2001 | 6 | Temp Dc Bl & Ev N1 | -71.03 | 42.21 | 40 | Harvard Forest | USA | CO2*N | y | n |
| Bown et al. 2007 | 1 | Temp Ev Nl | 176.13 | -38.26 | 600 | Purokohukohu Experimental Basin | New Zealand | N*P | y | y |
| Brück & Guo 2006 | 1 | Temp legume crop | 10.08 | 54.19 | 40 | Kiel | Germany | NH4 vs NO3 | y | n |
| Calfapietra 2005 | 1 | Temp Dc Bl | 11.48 | 42.22 | 150 | Viterbo | Italy | CO2*N canopy level | y | n |
| Carswell et al. 2005 | 4 | Temp Dc Bl & Ev Nl | 170.3 | -43.2 | 90 | Okarito | New Zealand | N*P | y | y |
| Cernusak et al. 2011 | 2 | Trop Ev Bl | 139.56 | -22.59 | 150 | Boulia | Australia | none | y | y |
| Cernusak et al. 2011 | 2 | “ | 133.19 | -17.07 | 230 | Sturt plains | Australia | none | y | y |
| Cernusak et al. 2011 | 2 | “ | 132.22 | -15.15 | 170 | Dry creek | Australia | none | y | y |
| Cernusak et al. 2011 | 2 | “ | 131.23 | -14.09 | 70 | Daly river | Australia | none | y | y |
| Cernusak et al. 2011 | 2 | “ | 131.07 | -13.04 | 80 | Adelaide river | Australia | none | y | y |
| Cernusak et al. 2011 | 2 | “ | 131.08 | -12.29 | 40v | Howard Springs | Australia | none | y | y |
| Domingues et al 2010 | 3 | Trop Dc Bl | -1.5 | 15.34 | 280-300 | Hombori | Mali | none | y | y |
| Domingues et al 2010 | 7 | “ | -1.17 | 12.73 | 50 | Bissiga | Burkina Faso | none | y | y |
| Domingues et al 2010 | 8 | “ | -3.15 | 10.94 | 300 | Dano | Burkina Faso | none | y | y |
| Domingues et al 2010 | 5 | “ | -1.86 | 9.3 | 370 | Mole | Ghana | none | y | y |
| Domingues et al 2010 | 8 | “ | -1.18 | 7.3 | 170 | Kogye | Ghana | none | y | y |
| Domingues et al 2010 | 21 | Trop Dc Bl & Ev Bl | -1.7 | 7.72 | 200 | Boabeng Fiame | Ghana | none | y | y |
| Domingues et al 2010 | 4 | “ | -2.45 | 7.14 | 25 | Asukese | Ghana | none | y | y |
| Grassi 2002 | 1 | Sub-trop Ev Bl | 149.07 | -35.18 | 600 | Canberra | Australia | N | y | n |
| Han et al. 2008 | 1 | Temp Ev Nl | 138.8 | 35.45 | 1030 | Canberra | Australia | N | y | n |
| Katahata et al 2007 | 1 | Ev shrub | 138.4 | 36.51 | 900 | Niigata | Japan | light*leaf age | y | n |
| Kubiske et al 2002 | 2 | Temp Bl Dc | 84.04 | 45.33 | 215 | Pellston | USA | N* CO2*light | y | n |
| Manter et al 2005 | 1 | Temp Ev Nl | -122.4 | 45.31 | 75 | Portland | USA | N | y | n |
| Merilo et al 2006 | 2 | Temp Ev Nl | 26.55 | 58.42 | 65 | Saare | Estonia | light | y | n |
| Midgley et al 1999 | 4 | Temp Ev shrub | 20 | -34.5 | 120 | Cape Agulhas | South Africa | CO2*N&P | y | n |
| Porte & Lousteau 1998 | 1 | Temp Ev Nl | -0.46 | 44.42 | 60 | Bordeaux | France | leaf age*canopy level | y | y |
| Rodriguez-Calcerrada et al. 2008 | 2 | Temp Dc Bl | -3.3 | 41.07 | 50 | Madrid | Spain | light | y | n |
| Sholtis et al 2004 | 1 | Temp Dc Bl | -84.2 | 35.54 | 230 | Oak Ridge | USA | CO2*canopy level | y | n |
| Turnbull et al. 2007 | 1 | Temp Ev Bl | 142.05 | -37.03 | 470 | Ballarat | Australia | defoliation | y | y |
| Warren 2004 | 1 | Temp Ev Bl | 143.53 | -37.25 | 450 | Creswick | Australia | N | y | n |
| Watanabe et al. 2011 | 1 | Temp Dc Nl | 141 | 43 | 180 | Asapporo | Japan | CO2*N | y | y |
| Wohlfahrt et al. 1999 | 28 | Temp C3 grass & forb | 11.01 | 46.01 | 1540-1900 | Monte Bondone | Eastern Alps (Italy and Austria) | none | y | n |
| Zhang & Dang 2006 | 1 | Temp Dc Bl | 89.14 | 48.22 | 200 | Ontario | Canada | CO2*age | n | y |
6. Data Access:
This data is available through the Oak Ridge National Laboratory (ORNL) Distributed Active Archive Center (DAAC).
Data Archive Center:
Contact for Data Center Access Information:
E-mail: uso@daac.ornl.gov
Telephone: +1 (865) 241-3952
7. References:
Kattge J, Knorr W. 2007. Temperature acclimation in a biochemical model of photosynthesis: a reanalysis of data from 36 species. Plant, Cell & Environment 30: 1176–1190.
Kattge J, Diaz S, Lavorel S, Prentice C, Leadley P, Boenisch G, Garnier E, Westoby M, Reich PB, Wright IJ, et al. 2011. TRY - a global database of plant traits. Global Change Biology 17: 2905–2935.
Walker AP, Beckerman AP, Gu L, Kattge J, Cernusak LA, Domingues TF, Scales JC, Wohlfahrt G, Wullschleger SD, Woodward FI. 2014. The relationship of leaf photosynthetic traits—Vcmax and Jmax—to leaf nitrogen, leaf phosphorus and specific leaf area: A meta-analysis and modelling study. Ecology and Evolution.
Wullschleger SD. 1993. Biochemical limitations to carbon assimilation in C3 plants - a retrospective analysis of the A/Ci curves from 109 species. Journal of Experimental Botany 44: 907–920.
Data Source References:
Aranda I, Castro L, Pardos M, Gil L, Pardos JA. 2005. Effects of the interaction between drought and shade on water relations, gas exchange and morphological traits in cork oak (Quercus suber L.) seedlings. Forest Ecology and Management 210: 117–129.
Bauer GA, Berntson GM, Bazzaz FA. 2001. Regenerating Temperate Forests under Elevated CO2 and Nitrogen Deposition: Comparing Biochemical and Stomatal Limitation of Photosynthesis. New Phytologist 152: 249–266.
Bown HE, Watt MS, Clinton PW, Mason EG, Richardson B. 2007. Partitioning concurrent influences of nitrogen and phosphorus supply on photosynthetic model parameters of Pinus radiata. Tree Physiology 27: 335–344.
Bruck H, Guo S. 2006. Influence of N form on growth photosynthesis of Phaseolus vulgaris L. plants. Journal of Plant Nutrition and Soil Science 169: 849–856.
Calfapietra C, Tulva I, Eensalu E, Perez M, De Angelis P, Scarascia-Mugnozza G, Kull O. 2005. Canopy profiles of photosynthetic parameters under elevated CO2 and N fertilization in a poplar plantation. Environmental Pollution 137: 525–535.
Carswell FE, Whitehead D, Rogers GND, Mcseveny TM. 2005. Plasticity in photosynthetic response to nutrient supply of seedlings from a mixed conifer-angiosperm forest. Austral Ecology 30: 426–434.
Cernusak LA, Winter K, Dalling JW, Holtum JAM, Jaramillo C, Körner C, Leakey ADB, Norby RJ, Poulter B, Turner BL, et al. 2011. Tropical forest responses to increasing atmospheric CO2: current knowledge and opportunities for future research. Functional Plant Biology 40: 531–551.
Domingues TF, Meir P, Feldpausch TR, Saiz G, Veenendaal EM, Schrodt F, Bird M, Djagbletey G, Hien F, Compaore H, et al. 2010. Co-limitation of photosynthetic capacity by nitrogen and phosphorus in West Africa woodlands. Plant Cell and Environment 33: 959–980.
Grassi G, Meir P, Cromer R, Tompkins D, Jarvis PG. 2002. Photosynthetic parameters in seedlings of Eucalyptus grandis as affected by rate of nitrogen supply. Plant Cell and Environment 25: 1677–1688.
Han Q, Kawasaki T, Nakano T, Chiba Y. 2008. Leaf-age effects on seasonal variability in photosynthetic parameters and its relationships with leaf mass per area and leaf nitrogen concentration within a Pinus densiflora crown. Tree Physiology 28: 551–558.
Katahata S-I, Naramoto M, Kakubari Y, Mukai Y. 2007. Photosynthetic capacity and nitrogen partitioning in foliage of the evergreen shrub Daphniphyllum humile along a natural light gradient. Tree Physiology 27: 199–208.
Kubiske ME, Zak DR, Pregitzer KS, Takeuchi Y. 2002. Photosynthetic acclimation of overstory Populus tremuloides and understory Acer saccharum to elevated atmospheric CO2 concentration: interactions with shade and soil nitrogen. Tree Physiology 22: 321–329.
Manter DK, Kavanagh KL, Rose CL. 2005. Growth response of Douglas-fir seedlings to nitrogen fertilization: importance of Rubisco activation state and respiration rates. Tree Physiology 25: 1015–1021.
Merilo E, Heinsoo K, Kull O, Soderbergh I, Lundmark T, Koppel A. 2006. Leaf photosynthetic properties in a willow (Salix viminalis and Salix dasyclados) plantation in response to fertilization. European Journal of Forest Research 125: 93–100.
Midgley GF, Wand SJE, Pammenter NW. 1999. Nutrient and genotypic effects on CO2-responsiveness: Photosynthetic regulation in Leucadendron species of a nutrient-poor environment. Journal of Experimental Botany 50: 533–542.
Porte A, Loustau D. 1998. Variability of the photosynthetic characteristics of mature needles within the crown of a 25-year-old Pinus pinaster. Tree Physiology 18: 223–232.
Rodriguez-Calcerrada J, Reich PB, Rosenqvist E, Pardos JA, Cano FJ, Aranda I. 2008. Leaf physiological versus morphological acclimation to high-light exposure at different stages of foliar development in oak. Tree Physiology 28: 761–771.
Sholtis JD, Gunderson CA, Norby RJ, Tissue DT. 2004. Persistent Stimulation of Photosynthesis by Elevated CO2 in a Sweetgum (Liquidambar styraciflua) Forest Stand. New Phytologist 162: 343–354.
Tissue DT, Griffin KL, Turnbull MH, Whitehead D. 2005. Stomatal and non-stomatal limitations to photosynthesis in four tree species in a temperate rainforest dominated by Dacrydium cupressinum in New Zealand. Tree Physiology 25: 447–456.
Turnbull TL, Adams MA, Warren CR. 2007. Increased photosynthesis following partial defoliation of field-grown Eucalyptus globulus seedlings is not caused by increased leaf nitrogen. Tree Physiology 27: 1481–1492.
Warren CR. 2004. The photosynthetic limitation posed by internal conductance to CO2 movement is increased by nutrient supply. Journal of Experimental Botany 55: 2313–2321.
Watanabe M, Watanabe Y, Kitaoka S, Utsugi H, Kita K, Koike T. 2011. Growth and photosynthetic traits of hybrid larch F1 (Larix gmelinii var. japonica × L. kaempferi) under elevated CO2 concentration with low nutrient availability. Tree Physiology 31: 965–975.
Wohlfahrt G, Bahn M, Haubner E, Horak I, Michaeler W, Rottmar K, Tappeiner U, Cernusca A. 1999. Inter-specific variation of the biochemical limitation to photosynthesis and related leaf traits of 30 species from mountain grassland ecosystems under different land use. Plant, Cell & Environment 22: 1281–1296.
Zhang S, Dang Q-L. 2006. Effects of carbon dioxide concentration and nutrition on photosynthetic functions of white birch seedlings. Tree Physiology 26: 1457–1467.
Sources for equations and model parameters:
Bernacchi CJ, Pimentel C, Long SP. 2003. In vivo temperature response functions of parameters required to model RuBP-limited photosynthesis. Plant Cell and Environment 26: 1419–1430.
Brooks A, Farquhar GD. 1985. Effect of Temperature on the Co2/O2 Specificity of Ribulose-1,5-Bisphosphate Carboxylase Oxygenase and the Rate of Respiration in the Light - Estimates from Gas-Exchange Measurements on Spinach. Planta 165: 397–406.
Von Caemmerer S. 2000. Biochemical Models of Leaf Photosynthesis. Collingwood, Australia: CSIRO Publishing.
Von Caemmerer S, Farquhar GD. 1981. Some relationships between the biochemistry of photosynthesis and the gas exchange of leaves. Planta 153: 376–387.
Dreyer E, Roux XL, Montpied P, Daudet FA, Masson F. 2001. Temperature response of leaf photosynthetic capacity in seedlings from seven temperate tree species. Tree Physiology 21: 223–232.
Farquhar G, Wong S. 1984. An Empirical Model of Stomatal Conductance. Functional Plant Biology 11: 191–210.
Farquhar GD, Caemmerer SV, Berry JA. 1980. A Biochemical-Model of Photosynthetic Co2 Assimilation in Leaves of C-3 Species. Planta 149: 78–90.
Harley PC, Loreto F, Marco GD, Sharkey TD. 1992. Theoretical Considerations when Estimating the Mesophyll Conductance to CO2 Flux by Analysis of the Response of Photosynthesis to CO2. Plant Physiology 98: 1429–1436.
Jordan DB, Ogren WL. 1984. The CO2/O2 specificity of ribulose 1,5-bisphosphate carboxylase/oxygenase. Planta 161: 308–313.
Leuning R. 1997. Scaling to a common temperature improves the correlation between the photosynthesis parameters Jmax and Vcmax. Journal of Experimental Botany 48: 345–347.
McMurtrie R, Wang Y. 1993. Mathematical-Models of the Photosynthetic Response of Tree Stands to Rising Co2 Concentrations and Temperatures. Plant Cell and Environment 16: 1–13.
Sharkey TD, Bernacchi CJ, Farquhar GD, Singsaas EL. 2007. Fitting photosynthetic carbon dioxide response curves for C3 leaves. Plant, Cell & Environment 30: 1035–1040.