Documentation Revision Date: 2015-12-14
Summary
Reported forest areas were gridded using a compilation of landuse maps. Growing stocks were converted to biomass and carbon using default factors from the IPCC Good Practice Guidance (2006). Based on data density, fluctuations in reported data and consistency of the data with other sources used, a qualitative uncertainty score was added. The data may be displayed using a map viewer such as Panoply or ArcGIS as maps at 1-degree x 1-degree grid with five year intervals.
There is one data file in NetCDF (.nc4) format with this data set.
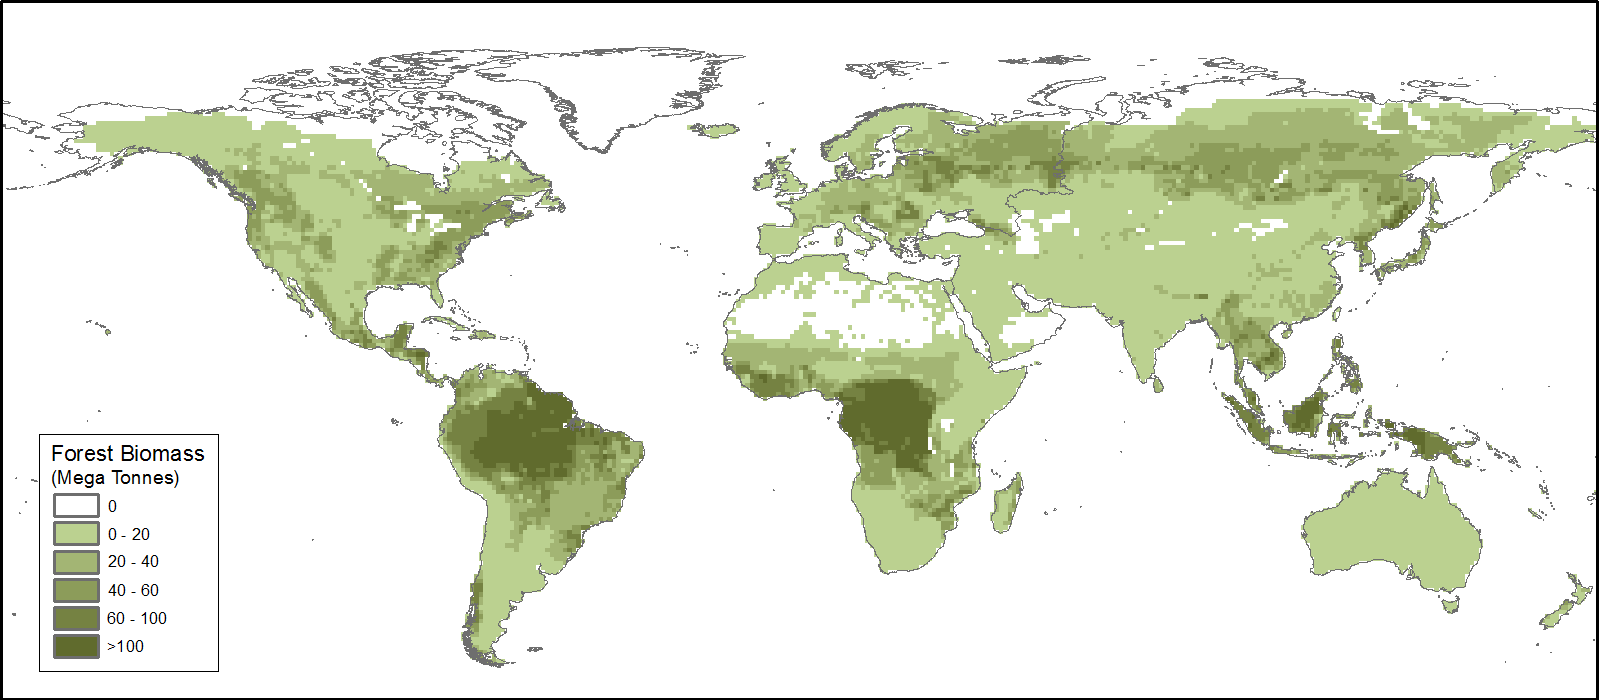
Figure 1. Global distribution of forest biomass in 1950
Citation
Hengeveld, G.M., K. Gunia, M. Didion, S. Zudin, A.P.P.M. Clerkx, and M.J. Schelhaas. 2015. Global 1-degree Maps of Forest Area, Carbon Stocks, and Biomass, 1950-2010. ORNL DAAC, Oak Ridge, Tennessee, USA. http://dx.doi.org/10.3334/ORNLDAAC/1296
Table of Contents
- Data Set Overview
- Data Characteristics
- Application and Derivation
- Quality Assessment
- Data Acquisition, Materials, and Methods
- Data Access
- References
Data Set Overview
Project: Global Vegetation Collections
Investigators: G. Hengeveld, K. Gunia, M. Didion, S. Zudin, A.P.P.M. Clerkx, and M.J. Schelhaas.
This data set provides global forest area, forest growing stock, and forest biomass data at 1-degree resolution for the period 1950-2010. The data set is based on a compilation of forest area and growing stock data reported in international assessments performed by FAO, MCPFE (now Forest Europe), and UNECE. Data of different assessments are to the extent possible harmonized to reflect both forest area and other wooded land, to be comparable between countries and assessments.
Reported forest areas were gridded using a compilation of landuse maps. Growing stocks were converted to biomass and carbon using default factors from the IPCC Good Practice Guidance (2006). Based on data density, fluctuations in reported data and consistency of the data with other sources used, a qualitative uncertainty score was added. The data may be displayed using a map viewer such as Panoply or ArcGIS as maps at 1-degree x 1-degree grid with five year intervals. For example, the global distribution of biomass for the year 1950 is displayed in Fig. 1.
Data Characteristics
Spatial Coverage
Global
Spatial Resolution
1-degree resolution
Temporal Coverage
Data are for the periods 1950-01-01 - 2010-12-31
Temporal Resolution
Calculations were made at five year intervals.
Site boundaries: (All latitude and longitude given in decimal degrees, datum: WGS84)
| Site (Region) | Westernmost Longitude | Easternmost Longitude | Northernmost Latitude | Southernmost Latitude |
|---|---|---|---|---|
| Global | -180 | 180 | 70 | -70 |
Data File Information
The data file historical_global_1-degree_forest_biomass.nc4 is in netCDF (.nc4) format and the variables are defined below. Missing or fill values are reported as -9999. Refer to Section 5 below for additional information.
Units Note: Bulk mass was calculated per 1-degree grid cell. This takes into account that a grid cell is not fully covered with forest, and that we did not use an equal area projection.
| Column | Name |
Units |
Description |
|---|---|---|---|
| 1 | ForestStockChange | million tonnes carbon/ 5 yr / 1-degree grid cell | Change in forest tree carbon stock |
| 2 | Forest_carbonstock | tonnes carbon / 1-degree grid cell | Forest tree carbon stock |
| 3 | Total_Biomass | tonnes / 1-degree grid cell | Total forest tree biomass |
| 4 | R | Root-shoot ratio | |
| 5 | ABG_ha | tonnes / ha | Above ground biomass per forest area |
| 6 | AboveGroundBiomass | tonnes carbon / 1-degree grid cell | Aboveground forest tree biomass |
| 7 | ConBCEF | IPCC default biomass conversion and expansion factors (BCEFs) for Conifers, Units =1 | |
| 8 | BrBCEF | IPCC default biomass conversion and expansion factors (BCEFs) for Broadleaved, Units =1 | |
| 9 | ConiferShare | unitless | Fraction of forest cover that is conifers |
| 10 | stockperarea | m3/ha | Forest growing stock per hectare. Growing stocks were converted to total aboveground biomass and carbon using default factors from the IPPC Good Practice Guidance (2006). |
| 11 | stock | m3 / 1-degree grid cell | Forest growing stock |
| 12 | area | ha / 1-degree grid cell | Forest area |
| 13 | Unc_GS | Uncertainty score for Growing Stock | |
| 14 | Unc_Area | Uncertainty score for forest area | |
| 15 | time | year | Middle of each 5th year. |
| 16 | time_bnds | year | Years since 1950-01-01 |
| 17 | Lat | decimal degrees | Latitude |
| 18 | lon | decimal degrees | Longitude |
Application and Derivation
This product has been developed for use with the Carbon Cycle Data Assimilation System (CCDAS), but can be used in a variety of other ways as well.
Quality Assessment
No formal uncertainty could be assessed. For each country an expert judgement of the quality of the input data was given. Then a heuristic interpolation of the uncertainty score was applied. Refer to section 5 for a more detailed discussion.
The mean absolute error of the estimations is 25 m3/ha for coniferous forest, 20 m3/ha for broadleaved forest and 25 m3/ha for total forest growing stock per hectare.
Data Acquisition, Materials, and Methods
The data set is based on a compilation of forest area and growing stock data reported in international assessments performed by FAO, MCPFE (now Forest Europe), and UNECE. Data of different assessments are to the extent possible harmonized to reflect both forest area and other wooded land, to be comparable between countries and assessments. Reported forest areas were gridded using a compilation of land-use maps. Growing stocks were converted to biomass and carbon using default factors from the IPCC Good Practice Guidance (2006). Based on data density, fluctuations in reported data and consistency of the data with other sources used, a qualitative uncertainty score was added (Fig. 2) . The data may be displayed using a map viewer such as Panoply or ArcGIS as maps at 1-degree x 1-degree grid with five year intervals.
Forest area
To downscale the statistical/interpolated forest area values, a ratio was calculated between these values and the total forest area in the input forest raster map, for each country and year. This ratio was used to scale the raster values in the forest map so that the forest area per country in the output map would fit with the statistical/interpolated forest area value for that country. Output maps were calculated for every fifth year only (1950, 1955, …).
Forest growing stock
Interpolated values of forest growing stock were divided by the interpolated forest area values to derive values per hectare by country and year. These values were then multiplied with the previously calculated forest area maps at 1-km scale for each year. The resulting raster maps show the growing stock at 1-km level.
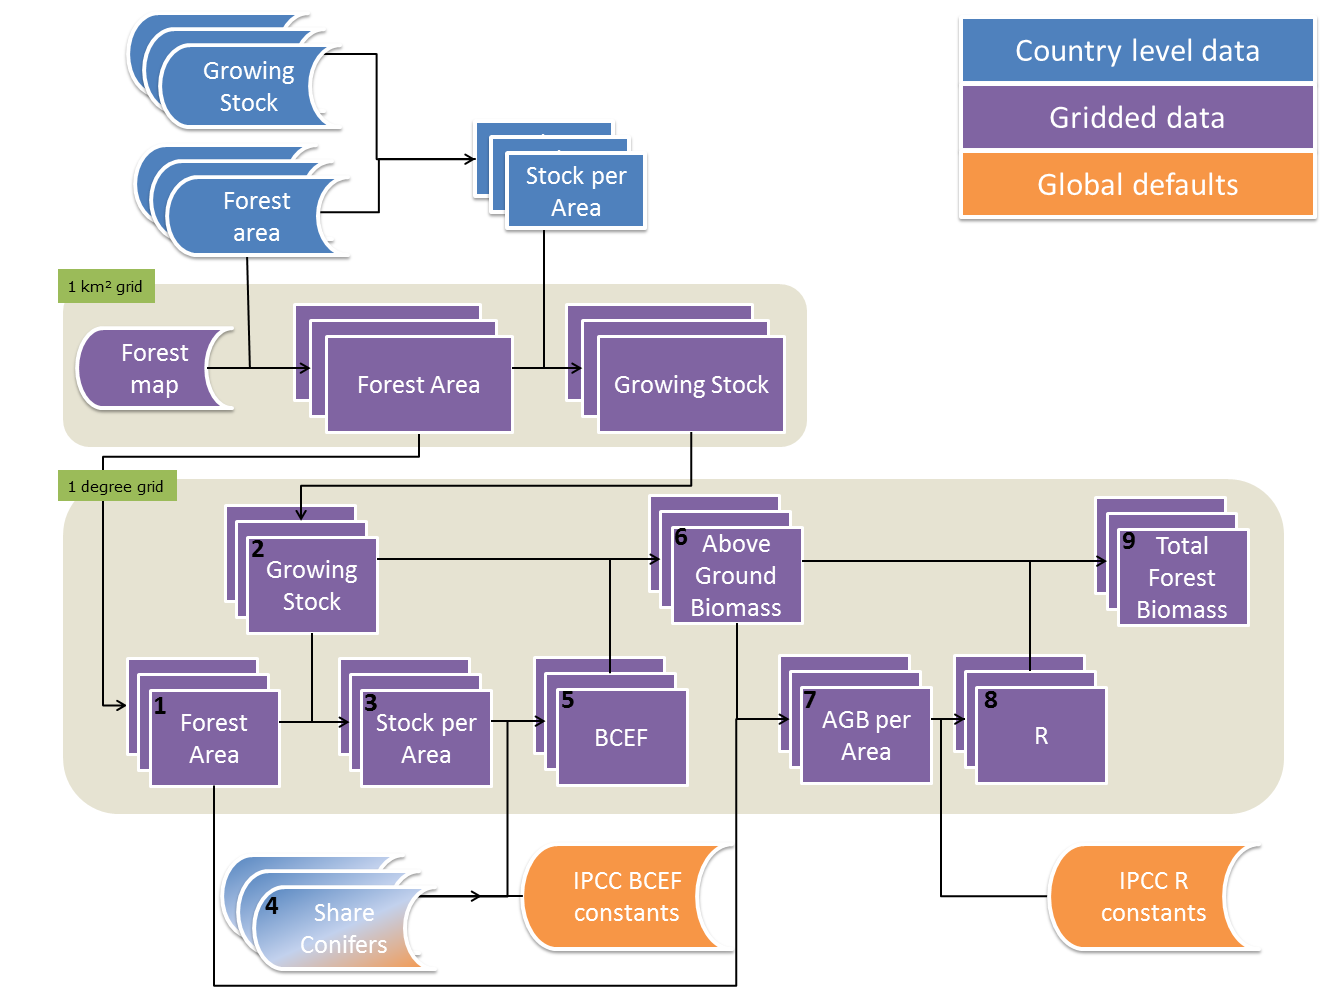
Figure 2. Data flow. Depiction of the dataflow towards the different forest biomass maps, showing dependencies and where in the process data are included.
Calculation of derived forest parameters
From the forest area and growing stock statistics a number of forest parameters were derived; above ground biomass, total biomass and total carbon stored in trees in forests. The calculations for these parameters are all expressed per 1-degree grid.
Aggregation to 1-degree grid cells
Forest area and growing stock rasters were aggregated to the common 1-degree grid by summing up raster cell values for each grid cell. When all 1 km-raster cells within one 1-degree grid cell showed ‘no data’, a ‘no data’ value was assigned to that 1-degree grid cell.
Above-ground biomass
IPCC default biomass conversion and expansion factors (BCEFs) were used to convert volume data to biomass. BCEFs published by the IPCC (IPCC 2006) vary depending on ecological domain, forest type (coniferous / broadleaved) and classes of growing stock level (volume per hectare). The BCEF values were aggregated per ecological domain for broadleaved and coniferous species separately. To avoid sudden jumps in biomass when exceeding class boundaries, power functions were fitted on these classes.
The recorded fraction of forest in conifers and broadleaves (termed "shares") were interpolated to complete time series like forest area and growing stock. Shares were preferentially used related to growing stock, but took shares related to area if no other data were available. If no country specific data were available, default values were used for the ecological domain. The country data were combined with a map on ecological domains provided by the Food and Agriculture Organization (FAO 2001) so that for each occurring combination of country and ecological domain the correct BCEF function could be applied:
BCEFij = aij GSbij
With a and b parameters for ecological domain i and species type j and GS growing stock (m3/ha) in that grid cell. Total above-ground biomass (AB) was then calculated as:
AB =∑ GS x Sj x BCEFij
With S the share of species type j in the total growing stock.
Total biomass
Total Biomass (B) was calculated from total above-ground biomass and an estimate of belowground biomass as determined from the IPCC default root-to-shoot ratios (R):
B=AB x (1+Ri)
Because of the low number of classes for R, no function was fitted. The values of R were aggregated per ecological domain.
Carbon
All biomass quantities were converted to carbon assuming a carbon content of 47% (IPCC, 2006, table).
Forest-stock Change
The variables above are quantities present (pools). Additionally we calculated 5-year changes in forest stock by simple subtraction of 5-year pools.
Uncertainty estimate
One of the goals of this data set is to provide validation material for global carbon and vegetation models. An assessment of the uncertainty range of the data is crucial for such validation exercises. Since measured uncertainties for these types of data are not reported, we made a subjective assessment based on four identified sources of uncertainties:
- Basic uncertainty in the data: Countries differ in geographical circumstances, accessibility of the terrain, extent, funding, and methodologies applied and differ therefore in accuracy of the reported data. A basic uncertainty was assigned to each country, ranging from class 1 (low) to class 3 (high) and applied this to the whole time period. This subjective assignment was based on the variability in the de-trended reported time series.
- Methodological developments over time: Methodologies have evolved and become more accurate over time. The variability within the time series was clearly larger before 1990 than thereafter. Therefore, an increasing uncertainty was assumed going back in time, defined at 0.025 classes for each year before 1990.
- Interpolation. Interpolation uncertainty was assumed to increase with the distance to the observations, defined as an increase in uncertainty of 0.1 class per year.
- Mismatch between forest map and country statistics. For some countries the area of forest reported could not be fit into the grid cells in this country with a forest cover. Such mismatch can be due to shifting forest cover patterns, or to difference in the definition of forest between the land cover map and the forest statistics used. For countries containing cells with between 100 and 120 % of the cell area covered by forest the uncertainty class was raised by 1. For countries containing cells with more than 120% of the cell area covered by forest the uncertainty class was raised by 2.
The total uncertainty for an estimate was defined as the sum of these four sources of uncertainty. The result is a qualitative assessment of uncertainty, expressed as a number. For practical purposes this number can be multiplied with a percentage, so upper and lower bounds can be calculated. Forest area was multiplied by 5%, by 7.5% for growing stock and by 10% for biomass estimates. Growing stock has inherently larger uncertainties than forest area, and biomass estimates suffer from additional uncertainties in the BCEF and R (IPCC 2006). Fluxes (in this case net stock changes) are even more uncertain due to lack of information about interannual variability. Therefore only 5-year values are presented, but without an estimate of the uncertainty.
Data Access
This data is available through the Oak Ridge National Laboratory (ORNL) Distributed Active Archive Center (DAAC).
Global 1-degree Maps of Forest Area, Carbon Stocks, and Biomass, 1950-2010
Contact for Data Center Access Information:
- E-mail: uso@daac.ornl.gov
- Telephone: +1 (865) 241-3952
References
EFI, 2011. Forest Map of Europe. European Forest Institute and European Commission, Joint Research Centre. URL: www.efi.int/portal/virtual_library/information_services/mapping_services/forest_map_of_europe/
FAO. 2010. Global Forest Resources Assessment 2010. Main Report, Rome (Italy): FAO.
FAO, 2001. Global Ecological Zones. Food and Agriculture Organization of the United Nations. URL: http://www.fao.org/geonetwork/srv/en/metadata.show?id=1255
Hengeveld, G.M., K. Gunia, M. Didion, S. Zudin, A.P.P.M. Clerkx, M.J. Schelhaas. Gridded maps as derived from a compilation of global forest biomass estimates 1950-2010.
IPCC, 2006. Default biomass conversion and expansion factors. IPCC Guidelines for National Greenhouse Gas Inventories, Volume 4 – Agriculture, Forestry and Other Land Use, Intergovernmental Panel on Climate Change.
JRC, 2003. Global Land Cover 2000 database. European Commission, Joint Research Centre.
UNECE & FAO. 2010. Forest Europe. Oslo (Norway): National Reports, Forest Europe, Liaison Unit Oslo.