Documentation Revision Date: 2020-08-18
Dataset Version: 1
Summary
Land cover maps were produced using a process that began with the classification, visual interpretation, and data verification of the 2005 imagery (using ground truth data) to produce a 2005 national LULC map. The 1995 Landsat images were overlaid onto the 2005 map and polygons were traced where LULC change had occurred. The process was applied to the 1985 imagery using the 1995 map as the starting reference. On-screen image interpretation was used to assess the maps (Roy et al., 2015; Meiyappan et al., 2016 in review). The minimum mapping unit was 2.5 hectares.
There are three data files in GeoTIFF (.tif) format with this data set; one file each for 2005, 1995, and 1985. A companion file lists the specific satellite resources used as the basis for the LULC classifications.
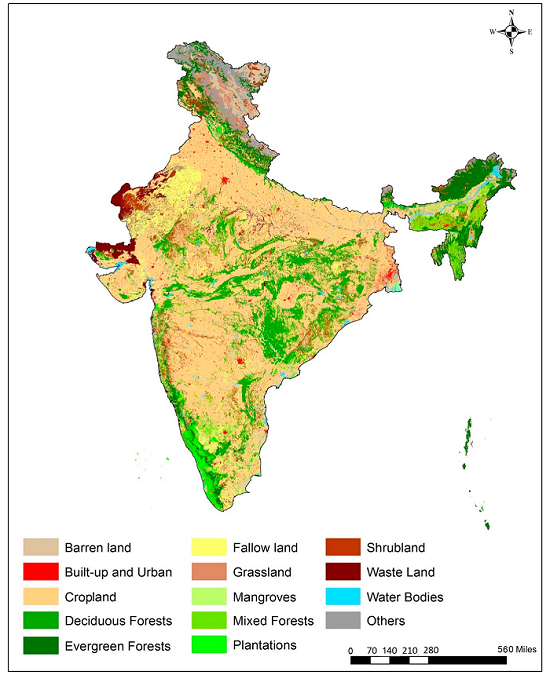
Figure 1. Land use and land cover map of India for 2005. This map served as a reference for the 1995 and 1985 LULC maps (Roy et al., 2015).
Citation
Roy, P.S., P. Meiyappan, P.K. Joshi, M.P. Kale, V.K. Srivastav, S.K. Srivasatava, M.D. Behera, A. Roy, Y. Sharma, R.M. Ramachandran, P. Bhavani, A.K. Jain, and Y.V.N. Krishnamurthy. 2016. Decadal Land Use and Land Cover Classifications across India, 1985, 1995, 2005. ORNL DAAC, Oak Ridge, Tennessee, USA. https://doi.org/10.3334/ORNLDAAC/1336
Table of Contents
- Dataset Overview
- Data Characteristics
- Application and Derivation
- Quality Assessment
- Data Acquisition, Materials, and Methods
- Data Access
- References
Dataset Overview
This study utilized satellite imagery to generate national level LULC maps for India at decadal intervals for 1985, 1995 and 2005. The process began with the classification, visual interpretation, and data verification of the 2005 imagery (using ground truth data) to produce a 2005 LULC map. The 1995 Landsat images were overlaid onto the 2005 map and polygons were traced where LULC change had occurred. The process was applied to the 1985 imagery using the 1995 map as the starting reference. On-screen image interpretation was used to assess the mapped data. The minimum mapping unit was 2.5 hectares.
Related Publications:
Meiyappan, P., P.S. Roy, Y. Sharma, R.M. Ramachandran, P.K. Joshi, R.S. DeFries, and A.K. Jain. 2016. Dynamics and determinants of land change in India: Integrating satellite data with village socioeconomics, In review.
Roy, Parth S.; Roy, Arijit; Joshi, Pawan K.; Kale, Manish P.; Srivastava, Vijay K.; Srivastava, Sushil K.; Dwevidi, Ravi S.; Joshi, Chitiz; Behera, Mukunda D.; Meiyappan, Prasanth; Sharma, Yeshu; Jain, Atul K.; Singh, Jamuna S.; Palchowdhuri, Yajnaseni; Ramachandran, Reshma M.; Pinjarla, Bhavani; Chakravarthi, V.; Babu, Nani; Gowsalya, Mahalakshmi S.; Thiruvengadam, Praveen. Development of Decadal (1985–1995–2005) Land Use and Land Cover Database for India. Remote Sens. 2015, 7, 2401-2430; doi:10.3390/rs70302401
Acknowledgements:
Preparation of this data set was supported by the NASA Land Use/Land Cover Change Program (Grant No: NNX14AD94G), based on data from the Indian Space Research Organization (ISRO) and Landsat (USGS). We thank the ISRO and all the team members who have participated in the preparation of the maps.
Data Characteristics
Spatial Coverage: India (National boundaries conform to that published by the Survey of India)
Spatial Resolution: 100 x 100 m
Temporal Resolution: Decadal
Temporal Coverage: 1985-01-01 to 2005-12-31
Study Area: (all latitudes and longitudes given in decimal degrees)
|
Site |
Westernmost Longitude |
Easternmost Longitude |
Northernmost Latitude |
Southernmost Latitude |
|
India |
66.305 |
98.93195 |
36.32194 |
6.71167 |
Data File Information
There are three data files in GeoTIFF (.tif) format with this data set, one file each for 2005, 1995, and 1985. The pixel values and spatial properties are the same for all files.
The files are named LULC_YYYY.tif:
LULC_2005.tif
LULC_1995.tif
LULC_1985.tif
Pixel values / Classification (see Table 2 below):
1- Deciduous Broadleaf Forest
2- Cropland
3- Built-up Land
4- Mixed Forest
5- Shrubland
6- Barren Land
7- Fallow Land
8- Wasteland
9- Water Bodies
10- Plantations
11- Aquaculture
12- Mangrove Forest
13- Salt Pan
14- Grassland
15- Evergreen Broadleaf Forest
16- Deciduous Needleleaf Forest
17- Permanent Wetlands
18- Snow & Ice
19- Evergreen Needleleaf Forest
Spatial Data Properties
Spatial Representation Type: Raster
Pixel Depth: 1 bit
Pixel Type: byte
Compression Type: LZW
Number of Bands: 1
Raster Format: TIFF
Source Type: generic
No Data Value: 127
Scale Factor: 0.9996
Number Columns: 29,484
Column Resolution: 100 meter
Number Rows: 33,555
Row Resolution: 100 meter
Extent in the item's coordinate system
North: 4121824.84
South: 766324.84
West: -822562.163
East: 2125837.837
Spatial Reference Properties
Type: Projected
Geographic Coordinate Reference: WGS 84
Projection: UTM zone 44N
Open Geospatial Consortium (OGC) Well Known Text (WKT)
PROJCS["WGS 84 / UTM zone 44N",
GEOGCS["WGS 84",
DATUM["WGS_1984",
SPHEROID["WGS 84",6378137,298.257223563,
AUTHORITY["EPSG","7030"]],
AUTHORITY["EPSG","6326"]],
PRIMEM["Greenwich",0],
UNIT["degree",0.0174532925199433],
AUTHORITY["EPSG","4326"]],
PROJECTION["Transverse_Mercator"],
PARAMETER["latitude_of_origin",0],
PARAMETER["central_meridian",81],
PARAMETER["scale_factor",0.9996],
PARAMETER["false_easting",500000],
PARAMETER["false_northing",0],
UNIT["metre",1,
AUTHORITY["EPSG","9001"]],
AUTHORITY["EPSG","32644"]]
Application and Derivation
These data could be useful to climate change studies (forest loss, land use, etc), social studies, and for understanding the long-term usage patterns of natural resources and facilitating sustainable management to plan, monitor and evaluate development. Analyses of the LULC change area are presented in Meiyappan, et al. (2016 in review).
Quality Assessment
The accuracy of the 2005 data were evaluated using pre-determined field sample points. A total of 12,606 stratified random samples to were selected to assess the accuracy of the map with the help of ground truth data (Biodiversity Information System, 2014; Roy et al., 2012). The confusion error matrix was created with the mapped and ground reference points to determine the users’ accuracy and Cohen’s kappa accuracy. Most of the LULC classes showed accuracies of more than 90% except for plantation, wasteland, and barren land. However, the accuracies of these three later classes are also within the acceptable limits. An overall mapping accuracy was achieved of 94.46% and the Kappa accuracy of 0.9445 for 2005 (Roy et al., 2015).
The migration of classes (LULC change) from one category to another between different years (1985 to 2005) was found to be only 10.36% of total geographical area, of which it was 5.74% between 1985 and 1995, and 8.55% between 1995 and 2005. Field surveys and other information (existing land and revenue records) were used in 5% of the noted change areas to ascertain the nature of change, and the extent and direction of change. It can be assumed that the mapping and Kappa accuracies of the 1995 and 1985 maps are similar to that of 2005 (Roy et al., 2015).
Data Acquisition, Materials, and Methods
Remote Sensing Resources
This study utilized Landsat satellite imagery, IRS 1C–LISS III (1994–1995) and Resourcesat 1 (2004–2005) imagery, multi-temporal Landsat 2005 MSS,TM, and ETM+ data that were projected to WGS84 datum (UTM 44N projection) at sub-pixel level. Refer to the companion file Decadal_LULC_India_satellite_compfile.pdf for a complete list of the satellites, sensors, paths/rows, and dates.
Table 1. Satellite remote sensing data used for the LULC mapping.
| Period | Satellite | Sensor | Spatial Resolution |
|---|---|---|---|
| 1984-1985 | Landsat 4 | MSS | 80 (resampled to 60 m) |
| 1994-1995 | Landsat 5 and IRS 1B | Thematic Mapper (TM), Enhanced Thematic Mapper (ETM +), Linear Imaging Self-Scanning Sensor – 1 (LISS I) | 30 and 72 m (resampled to 56 m) respectively |
| 2004-2005 | Landsat 5 and Resourcesat | ETM+, LISS III | 30 and 23.5 m respectively |
LULC Mapping Process
The following methodology was used to produce the 2005, 1995, and 1985 maps.
2005 LULC
The 2005 satellite data were classified and a national map of land cover was produced. The 2005 satellite data were aggregated into 19 IGBP classes (Table 2) from the available 150 classes using hierarchical class merging approach and converted to a vector map using webGIS tool. The 2005 LULC vector map was overlaid on the satellite data (Landsat TM 2005) for three seasons, winter (January-March), pre-monsoon (April-June), and post-monsoon (mid-October to December) to identify cropland and fallow land (multiple cropping was not captured). Extensive ground truth data were collected using existing field transects with high-resolution satellite images. The errors and discrepancies were corrected using the ground truth data and ancillary information supplemented by existing maps (Roy et al., 2015).
Table 2. Land use/land cover (LULC) classification scheme and description of classes.
Note: The IGBP Classifications in the table correspond to the pixel values in the data provided with this data set.
| Pixel Value | Land Use Type (IGBP Classification) | Description |
|---|---|---|
| 1 | Deciduous Broadleaf Forest | Woody vegetation with a percent cover >60% and height exceeding 2 m. Consists of broadleaf tree communities with an annual cycle of leaf-on and leaf-off periods. |
| 2 | Crop land | Temporarily cropped area followed by harvest and a bare soil period (e.g. single and multiple cropping systems). Note that perennial woody crops will be classified as either forest or shrubland, whichever is appropriate. Includes orchards. Different types of cropland based on seasons (e.g. kharif, rabi, zaid) were not subclassified. |
| 3 | Built-up Land | Land covered by buildings and other man-made structures |
| 4 | Mixed Forests | Trees with a percent cover >60% and height exceeding 2 m. Consists of tree communities with interspersed mixtures or mosaics of the other four forest types. None of the forest types exceeds 60% of landscape |
| 5 | Shrubland | Land with woody vegetation less than 2 m in height and with greater than 10% shrub canopy cover. The shrub foliage can be either evergreen or deciduous |
| 6 | Barren land | Exposed soil, sand, rocks, or snow and never have more than 10% vegetated cover during any time of the year |
| 7 | Fallow land | Land taken up for cultivation temporarily allowed to remain uncultivated for one or more seasons. |
| 8 | Wasteland | Sparsely vegetated land with signs of erosion and land deformation that could be attributed to lack of appropriate water and soil management, or natural causes. These are land identified as currently underutilized and could be reclaimed to productive uses with reasonable effort. Degraded forest (<10% tree cover) with signs of erosion is classified under wasteland |
| 9 | Water bodies | Areas with surface water, either impounded in the form of ponds, lakes, reservoirs or flowing as streams, rivers, etc. Can be either fresh or salt-water bodies |
| 10 | Plantations | Commercial horticulture plantations, orchards and tree cash crops |
| 11 | Aquaculture | Land used to farm aquatic organisms including fish, mollusc, crustaceans and aquatic plants. |
| 12 | Mangrove Forest | Evergreen forests in the intertidal areas. These forests are dense and dominated by halophytic plants |
| 13 | Salt Pan | Land covered with salt and minerals |
| 14 | Grassland | Herbaceous types of cover. Tree and shrub cover is less than 10% |
| 15 | Evergreen Broad leaf Forest | Broad leaf woody vegetation with a percent cover >60% and height exceeding 2 m. Almost all trees and shrubs remain green year round. Canopy is never without green foliage. |
| 16 | Deciduous Needleleaf Forest | Woody vegetation with a percent cover >60% and height exceeding 2 m. Consists of seasonal needle leaf tree communities with an annual cycle of leaf-on and leaf-off periods. |
| 17 | Permanent wetland | Land with permanent mixture of water and herbaceous or woody vegetation. The vegetation can be present either in salt, brackish, or fresh water |
| 18 | Snow and Ice | Land covered with snow or ice for most of the year |
| 19 | Evergreen Needle forest | Needle leaf woody vegetation with a percent cover >60% and height exceeding 2 m.Almost all trees remain green all year. Canopy is never without green foliage. |
Footnote: Savannas (both woody and non-woody) were merged within the forest category. Savannas are defined as herbaceous and other understory systems, with forest canopy cover of 10-60%, and height exceeding 2 m. Also note that IGBP definition of forest is different from that of Forestry Survey of India (2013). FSI defines forest cover as all lands more than 1 ha in area, with a tree canopy density of more than 10% as forest, irrespective of ownership and legal status. FSI reported forest area includes areas of trees outside forest (forest plantation, and agriculture plantations). In our study, forest plantations are a separate category (“Plantations” category), and agricultural plantations are included within “Cropland” category.
1995 LULC
To minimize errors in land change detection between 2005 and 1995, the 1995 Landsat images were overlaid onto the 2005 map and polygons were traced where land change had occurred, leaving unchanged polygons unmodified (for greater consistency). This method reduced the effort required to produce the 1995 map since only polygons that underwent change between 1995 and 2005 were traced. In addition, as polygons that remained unchanged over time were preserved, it minimized errors in land change detection by eliminating human-errors in visual interpretation of unmodified polygons that could have occurred if the 1995 mapped data were interpreted independent of the 2005 mapped data and land change were inferred by differencing the two maps. The nature and extent of the LULC changes were verified from the ground truth data and records from various revenue and forest departments of the respective states (Roy et al., 2015; Meiyappan et al., 2016 in review).
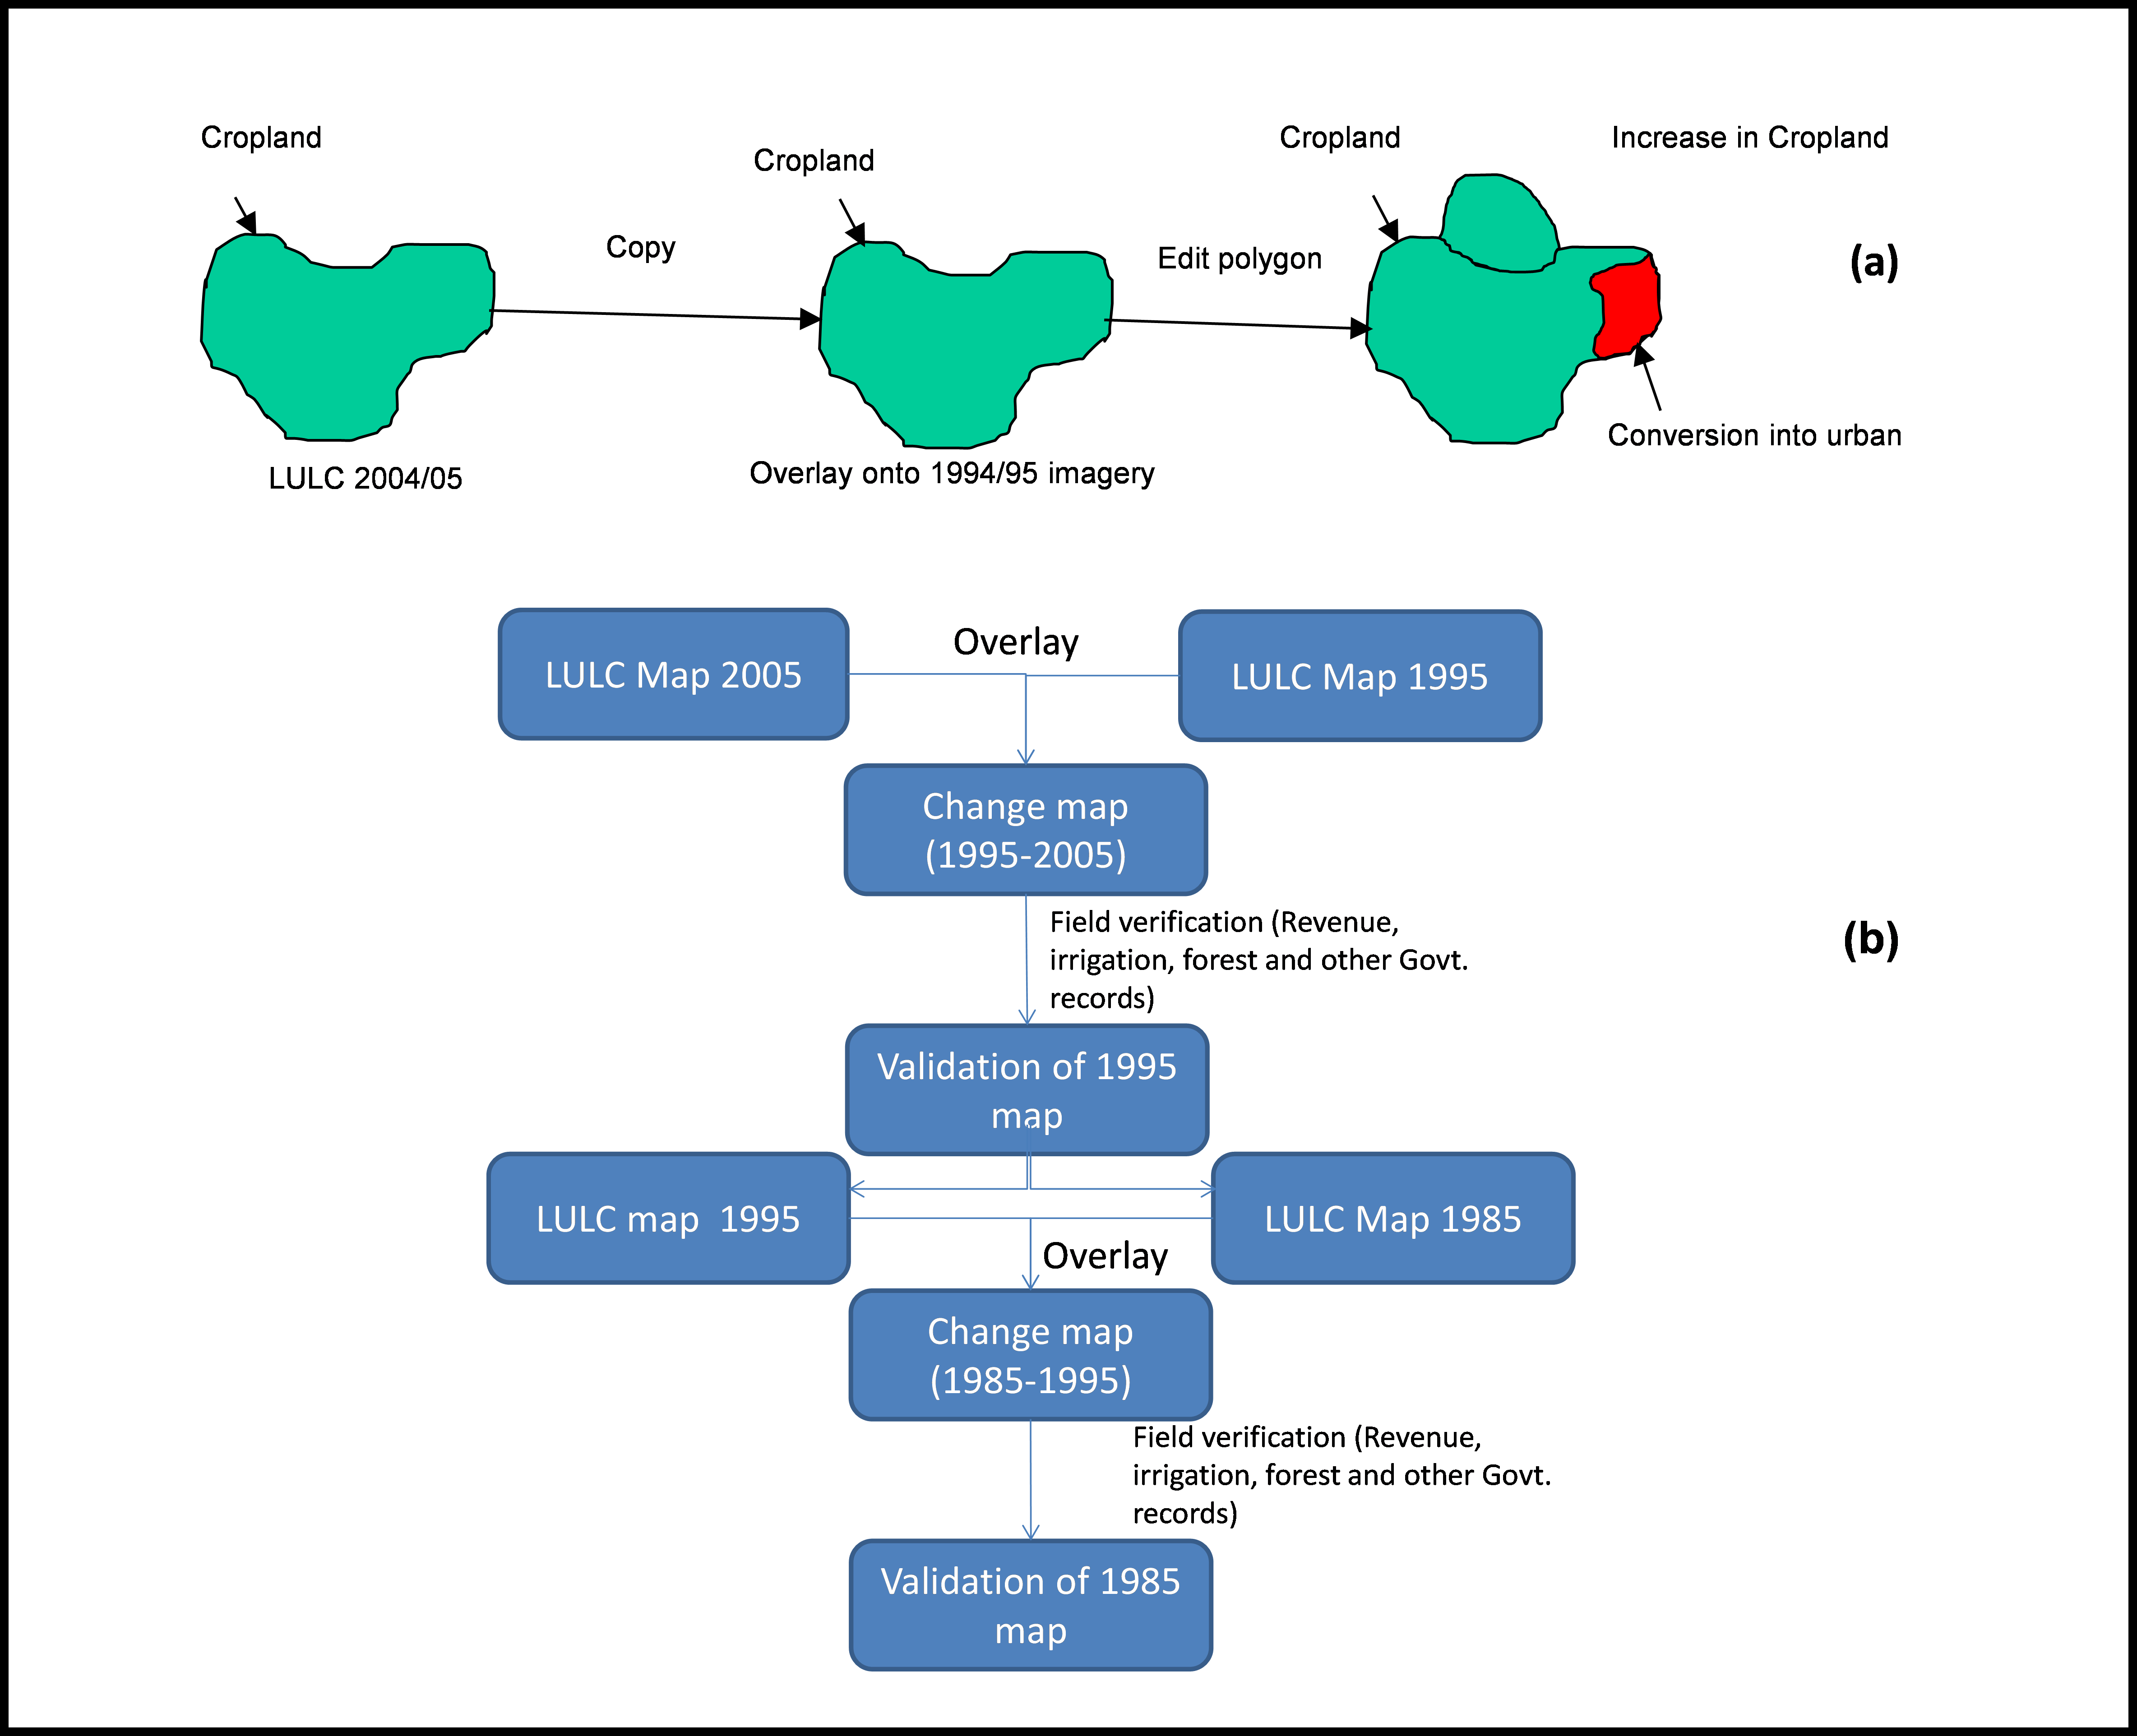
Figure 2. Methodology for LULC maps of 1995 and 1985 to maintain continuity of accuracy as in 2005 (a) editing of changes in polygon, (b) procedure for change mapping and validation. From Roy et al., 2015.
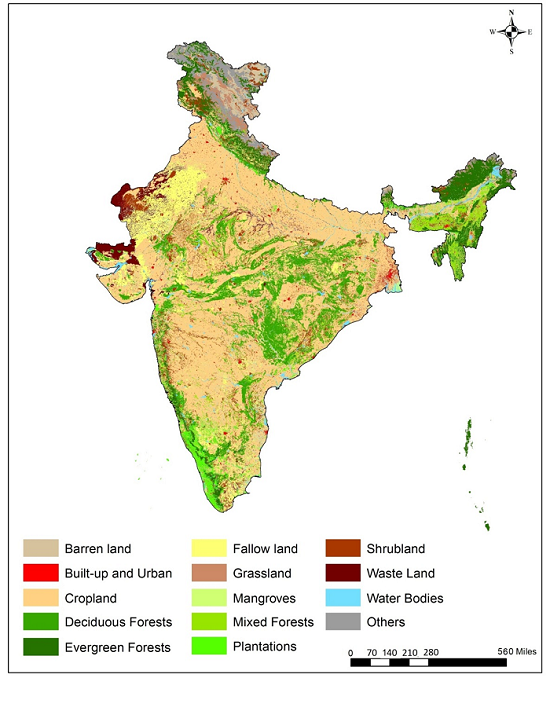
Figure 3. Land use and land cover map for 1995 (Roy et al., 2015).
1985 LULC
A similar approach was followed to detect land change between 1985 and 1995, using the 1995 map as a reference and also verification with ground data ( Roy et al., 2015; Meiyappan et al., 2016 in review).

Figure 4. Land use and land cover map for 1985 (Roy et al., 2015).
LULC Change Areas
The 1985, 1995, and 2005 maps were then crossed to generate the change areas. Field surveys were also carried out in 5% of the noted change areas to ascertain the nature of change, their extent and direction of change. The 2005, 1995, and 1985 LULC maps provide reliable and accurate information on the magnitude of LULC change. Change areas are not provided with this data set. See Meiyappan et al., 2016 in review.
LULC Notes
Andaman and Nicobar Islands and Lakshadweep were mapped only for year 2005. For year 1995 and 1985 maps, the land pixels of both the regions were filled with that of 2005. In other words, this data set does not record any land use change for Andaman and Nicobar Islands and Lakshadweep, but this does not mean that no land change occurred in reality between 1985 and 2005.
Data Access
These data are available through the Oak Ridge National Laboratory (ORNL) Distributed Active Archive Center (DAAC).
Decadal Land Use and Land Cover Classifications across India, 1985, 1995, 2005
Contact for Data Center Access Information:
- E-mail: uso@daac.ornl.gov
- Telephone: +1 (865) 241-3952
References
Biodiversity Information System. Vegetation Type Map of India Prepared from Satellite Remote Sensing 2005 Data Set at 1:50000 Scale. Available online: http://bis.iirs.gov.in/ (accessed on 23 August 2014).
Forestry Survey of India. India State of Forest Report. Ministry of Environment and Forest, Govt. of India: Dehradun, India, 2013; p. 252.
Meiyappan, P., P.S. Roy, Y. Sharma, R.M. Ramachandran, P.K. Joshi, R.S. DeFries, and A.K. Jain. 2016. Dynamics and determinants of land change in India: Integrating satellite data with village socioeconomics, In review.
Roy, Parth S.; Roy, Arijit; Joshi, Pawan K.; Kale, Manish P.; Srivastava, Vijay K.; Srivastava, Sushil K.; Dwevidi, Ravi S.; Joshi, Chitiz; Behera, Mukunda D.; Meiyappan, Prasanth; Sharma, Yeshu; Jain, Atul K.; Singh, Jamuna S.; Palchowdhuri, Yajnaseni; Ramachandran, Reshma M.; Pinjarla, Bhavani; Chakravarthi, V.; Babu, Nani; Gowsalya, Mahalakshmi S.; Thiruvengadam, Praveen. Development of Decadal (1985–1995–2005) Land Use and Land Cover Database for India. Remote Sens. 2015, 7, 2401-2430; doi:10.3390/rs70302401
Roy, P.S.; Kushwaha, S.P.S.; Murthy, M.S.R.; Roy, A.; Kushwaha, D.; Reddy, C.S.; Behera, M.D.; Mathur, V.B.; Padalia, H.; Saran, S.; et al. Biodiversity Characterization at Landscape Level: National Assessment 2012; Indian Institute of Remote Sensing: Dehradun, India, 2012; p. 140.