Documentation Revision Date: 2017-06-30
Data Set Version: 1
Summary
There are 42 data files in GeoTIFF (.tif) format with this data set; 14 fire and boreal forest area characterization variables, each provided at three different resolutions: quarter degree, half degree, and one degree.
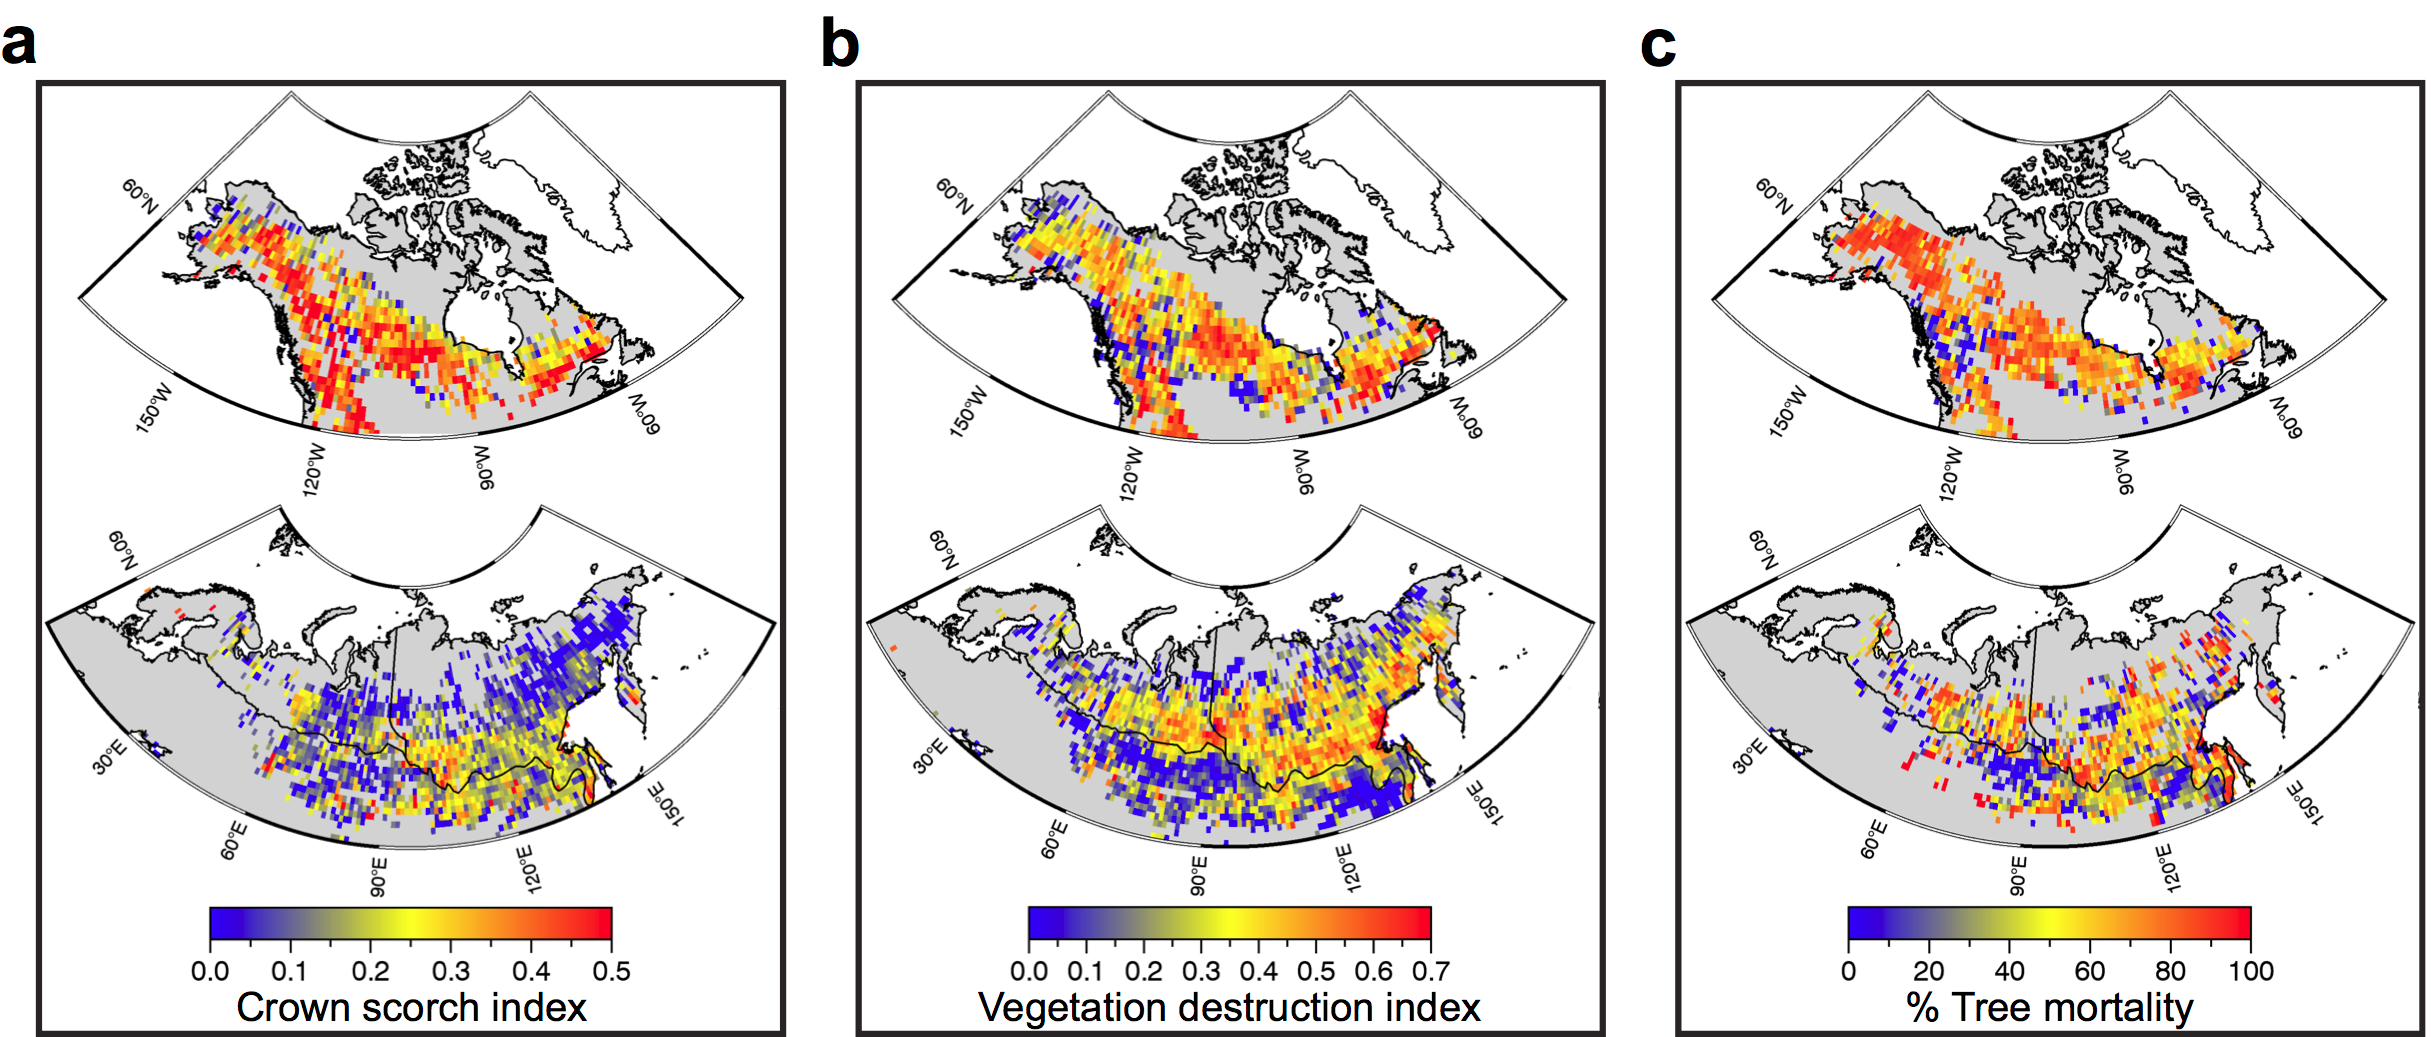
Figure 1. Maps of derived metrics aggregated to 1 degree for (a) crown scorch, (b) vegetation combustion, and (c) total relative tree mortality (from Rogers et al., 2015, Supplementary Figure 4).
Citation
Rogers, B.M., A.J. Soja, M.L. Goulden, and J.T. Randerson. 2017. Fire Intensity and Burn Severity Metrics for Circumpolar Boreal Forests, 2001-2013. ORNL DAAC, Oak Ridge, Tennessee, USA. https://doi.org/10.3334/ORNLDAAC/1520
Table of Contents
- Data Set Overview
- Data Characteristics
- Application and Derivation
- Quality Assessment
- Data Acquisition, Materials, and Methods
- Data Access
- References
Data Set Overview
This data set provides products pertaining to the instantaneous, immediate, and longer-term ecological effects of fires in the boreal forests of Northern Eurasia and North America. Satellite products were transformed and combined into three synthetic metrics better suited for understanding fire ecology and refining global models: an index of crown scorch (fire intensity), live vegetation destruction (fire severity), and percent tree mortality (burn severity).
Fire radiative power (FRP), a measure of the instantaneous release of combustion energy determined by fire line intensity and fire line length, was quantified using daily 1-km thermal anomalies/active fires of all quality during 2003-2013 and was used as a metric for fire intensity. Crown scorch is related to fire intensity, tree survival and the prevalence of crown fires, which represents a fundamental difference in fire regimes between the two continents.
Additional data are provided that are correlated, sensitive to, or result from fires. These include: increase in spring albedo which is correlated with fire severity as more needles, branches and boles that shade snow are destroyed, dNBR, sensitive to landscape charring, loss of live vegetation, soil exposure, and reduction in canopy water, dNDVI sensitive to the destruction of photosynthetic vegetation, and dLST sensitive to biomass loss through decreased roughness, reduced transpiration, and deposition of char. In addition, mean albedo was determined 5-12 years after fires, and mean percent decrease in tree cover was determined 5-7 years after fires.
Related Publications
Rogers, B.M., A.J. Soja, M.L. Goulden, J.T. Randerson. 2015. Influence of tree species on continental differences in boreal fires and climate feedbacks. Nature Geoscience 8, 228-234. http://dx.doi.org/10.1038/ngeo2352
Acknowledgements
This work was financially supported by the US National Science Foundation (NSF) and the National Aeronautics and Space Administration (NASA), the NASA Carbon Cycle (NNX11AF96G), Atmosphere (NNX10AT83G), and Interdisciplinary Research in Earth Science (NNH09ZDA-IDS-0116) programs, and the Carbon in Arctic Reservoirs Vulnerability Experiment (CARVE).
Data Characteristics
Spatial Coverage: Circumpolar boreal Eurasia and North America
Spatial Resolution: quarter degree, half degree, and one degree resolution
Temporal Coverage: 2001-01-01 to 2013-12-31
Temporal Resolution: Annual and 5-10 year means
Study Area (All latitude and longitude given in decimal degrees)
| Site | Westernmost Longitude | Easternmost Longitude | Northernmost Latitude | Southernmost Latitude |
|---|---|---|---|---|
| Circumpolar boreal forests-Eurasia and North America | -180 | 180 | 80 | 40 |
Data file information
This data set provides 42 data files in GeoTIFF (.tif) format which includes 14 variables in quarter degree, half degree, and one degree resolution.
Table 1. File names and descriptions (Note that XX in the file names represents quarter degree, half degree, or one degree resolution)
| File names: | Description |
|---|---|
| fire_radiative_power_XX.tif | Mean fire radiative power from Aqua and Terra (MW) from 2003-2013 |
| spring_albedo_XX_degree.tif | Mean change in spring albedeo one year after fires from 2001-2012 |
| tree_cover_decrease_XX_degree.tif | Mean decrease in tree cover after fires from 2001-2009, provided as a percent |
| normalized_burn_ratio_XX_degree.tif | Mean dNBR from 2001-2012 |
| NDVI_XX.tif | Mean change in NDVI after fires from 2001-2012 |
| day_land_surface_temp_XX_degree.tif | Mean change in daytime land surface temperature (degrees Celsius) from Aqua from 2003-2012 |
| crown_scorch_XX.tif | Mean crown scorch index (0-1) from 2003-2009 |
| veg_destructive_index_XX_degree.tif | Mean vegetation destruction (0-1) from 2003-2012 |
| Tree_mortality_XX.tif | Mean tree mortality (long-term) from 2001-2005, provided as a percent |
| spring_albedo_5to12_yrs_XX_degree.tif | Mean change in spring albedo 5-12 years after fires from 2001-2008 |
| tree_cover_decrease_5to7_yrs_XX_degree.tif | Mean decrease in tree cover 5-7 years after fires, provided as a percent |
| pct_burned_XX.tif | Mean annual burned in boreal pixels from 2001-2012, provided as a percent |
| pct_boreal_pixel_XX.tif | Boreal pixels, including water, provided as a percent |
| boreal_regions_XX_degree.tif | Regional mask for boreal forest regions |
Properties of the GeoTIFF files
Table 2. All files have the following properties:
| Map units | # bands | Data type | Fill value | Westernmost Longitude | Easternmost Longitude | Northernmost Latitude | Southernmost Latitude |
|---|---|---|---|---|---|---|---|
| degree | 1 | float32 for most files. The boreal_regions_XX files (boreal masks) are data type Int16. | -9999 | -180 | 180 | 80 | 40 |
Note that the GeoTIFFS are provided as decimal degrees, i.e., not projected.
Table 3. Minimum and maximum pixel values in each file
| File name | Minimum value | Maximum value |
|---|---|---|
| fire_radiative_power_1_degree.tif | 0 | 1671 |
| fire_radiative_power_half_degree.tif | 0 | 2590 |
| fire_radiative_power_quarter_degree.tif | 0 | 2840.5 |
| spring_albedo_1_degree.tif | -0.3 | 0.3 |
| spring_albedo_half_degree.tif | -0.3 | 0.4 |
| spring_albedo_quarter_degree.tif | -0.4 | 0.4 |
| tree_cover_decrease_1_degree.tif | -0.8 | 1 |
| tree_cover_decrease_half_degree.tif | -2.4 | 1 |
| tree_cover_decrease_quarter_degree.tif | -2.4 | 1 |
| normalized_burn_ratio_1_degree.tif | -0.2 | 0.7 |
| normalized_burn_ratio_half_degree.tif | -0.4 | 0.7 |
| normalized_burn_ratio_quarter_degree.tif | -0.5 | 0.8 |
| NDVI_1_degree.tif | -0.2 | 0.4 |
| NDVI_half_degree.tif | -0.3 | 0.4 |
| NDVI_quarter_degree.tif | -0.5 | 0.6 |
| day_land_surface_temp_1_degree.tif | -8.7 | 15.1 |
| day_land_surface_temp_half_degree.tif | -12.4 | 17 |
| day_land_surface_temp_quarter_degree.tif | -15.2 | 17 |
| crown_scorch_1_degree.tif | -0.1 | 0.7 |
| crown_scorch_half_degree.tif | -0.1 | 0.8 |
| crown_scorch_quarter_degree.tif | -0.2 | 0.8 |
| veg_destructive_index_1_degree.tif | -0.1 | 0.8 |
| veg_destructive_index_half_degree.tif | -0.1 | 0.9 |
| veg_destructive_index_quarter_degree.tif | -0.1 | 0.9 |
| tree_mortality_1_degree.tif | -0.4 | 1 |
| tree_mortality_half_degree.tif | -0.4 | 1 |
| tree_mortality_quarter_degree.tif | -0.4 | 1 |
| spring_albedo_5to12_yrs_1_degree.tif | -0.2 | 0.4 |
| spring_albedo_5to12_yrs_half_degree.tif | -0.2 | 0.4 |
| spring_albedo_5to12_yrs_quarter_degree.tif | -0.2 | 0.4 |
| tree_cover_decrease_5to7_yrs_1_degree.tif | -1.1 | 1 |
| tree_cover_decrease_5to7_yrs_half_degree.tif | -1.1 | 1 |
| tree_cover_decrease_5to7_yrs_quarter_degree.tif | -1.4 | 1 |
| pct_burned_1_degree.tif | 0 | 6.7 |
| pct_burned_half_degree.tif | 0 | 9.7 |
| pct_burned_quarter_degree.tif | 0 | 12.3 |
| pct_boreal_pixel_1_degree.tif | 0 | 99.9 |
| pct_boreal_pixel_half_degree.tif | 0 | 100 |
| pct_boreal_pixel_quarter_degree.tif | 0 | 100 |
| boreal_regions_1_degree.tif ** | 0 | 4 |
| boreal_regions_half_degree.tif ** | 0 | 4 |
| boreal_regions_quarter_degree.tif ** | 0 | 4 |
** Note: For the boreal regions files, the pixel values are actually region classification values 0, 1, 2, 3, or 4 where:
0=Greenland; 1=Southern Eurasia; 2=North America; 3=Northeast Eurasia; and 4=Northwest Eurasia.
Application and Derivation
This data set provides products of value for predicting immediate and longer-term ecological effects of forest fires in the boreal forests of Northern Eurasia and North America.
Quality Assessment
Uncertainty was quantified in a variety of ways depending on the analysis. Bootstrap resampling techniques were used where sample populations were defined by individual years or severity metrics. Note that these uncertainties were not derived spatially, but rather for aggregated statistics and graphics.
Data Acquisition, Materials, and Methods
Data sources
The data were derived from a variety of sources including MODIS products, climate reanalysis data and forest inventories. All analyses of fire intensity and severity were performed using MODIS remote-sensing products (https://lpdaac.usgs.gov/data_access/data_pool) at their native 250-m, 500-m or 1-km resolution. Fire and burn severity metrics were quantified for burned pixels between 2001 and 2012 in the MCD64A1 data set. Independent products were transformed and linearly combined to derive proxy metrics for crown scorch, live vegetation destruction, and tree mortality.
Table 4. Satellite products used to derive this data.
| Variable | Product name | Satellite | Days of year | Acquisition Years |
|---|---|---|---|---|
| Fire radiative power (FRP) | MOD14A1,MYD14A1 | Aqua and Terra | 1-365 | 2003-2013 |
| Spring albedo | MCD43A3 | Aqua and Terra | 48-81 | 2003-2013 |
| Tree cover | MOD44B | Terra | annual | 2000-2010 |
| dNBR | MCD43A3 | Aqua and Terra | 177-209 | 2003-2013 |
| NDVI | MOD13A1,MYD13A1 | Aqua and Terra | 177-209 | 2003-2013 |
| Land surface temperature | MYD11A2 | Aqua | 177-209 | 2003-2013 |
The Climate Research Unit (CRU) National Centers for Environmental Prediction (NCEP) reanalysis climate data between 2000 and 2010 was used to calculate fire weather indices from the Canadian Fire Weather Index System during fires and the three-month fire season for each region. Individual MODIS fire pixels were aggregated to fire events on the basis of temporal and spatial proximity and used to quantify fire spread rates and sizes.
Boreal area
Boreal pixels were defined by climate and vegetation type for pixels north of 40 degrees N. The boreal-temperate boundary was defined using an upper threshold of 3 degree C mean annual temperature. Long-term (1950 - 2000) mean climate data were taken from Hijmans et al. (2005) at 30 arc-second resolution and re-gridded to 500-m using a nearest-neighbor approach. Areas under human management (croplands, cropland/natural vegetation mosaic, and urban types) were excluded, considering only pixels of non-grassland natural vegetation from the level 5 MODIS MCD12Q1 product (available from http://e4ftl01.cr.usgs.gov/MOTA/MCD12Q1.051/) with IGBP land cover classification.
Data Processing
Fire radiative power (FRP fire intensity)
FRP (fire intensity) was quantified using daily 1-km thermal anomalies/active fires of all quality during 2003 - 2013 from the Aqua (MYD14A1, available from http://e4ftl01.cr.usgs.gov/MOLA/MYD14A1.005/) and Terra (MOD14A1, available from http://e4ftl01.cr.usgs.gov/MOLT/MOD14A1.005/) satellites (Giglio et al., 2006), considering only 1-km pixels that contained at least two 500-m boreal mask pixels. The analyses were restricted to begin in 2003 as this is the first full year of coverage from the Aqua satellite. Using only Aqua or only Terra data from the same time period produced similar results with respect to continental differences (mean FRP across Eurasia was 51% of the North American mean using all data, 50% with just Aqua, and 53% with just Terra). All fire severity metrics were analyzed for burned pixels from the MCD64A1 burned area data set that were contained in our 500-m boreal mask, and were calculated using values from one year pre-fire and one season to one year post-fire.
Spring albedo (dAlbedo)
Increases in spring albedo (dAlbedo) were characterized one year after fire using observations spanning day of year (DOY) 49 through 81 from the MCD43A3 white sky shortwave albedo product (available from http://e4ftl01.cr.usgs.gov/MOTA/MCD43A3.005/) for 2001 - 2012 fires. Spring albedo is typically higher after fires in high latitudes. Pixels were used derived from full inversions of best and good quality, as well as magnitude inversions with at least seven observations (BRDF band quality 1, 2, and 3), taken from the MCD43A2 albedo quality product (available from http://e4ftl01.cr.usgs.gov/MOTA/MCD43A2.005/). Southern Eurasia displayed a relatively high level of inter-annual variability in spring albedo due to variable snow cover: the coefficient of variation for spring albedo was 0.094 for Southern Eurasia vs. 0.015, 0.026, and 0.036 for Northeast Eurasia, Northwest Eurasia, and North America, respectively, for all boreal pixels during 2000 - 2013. To reduce the resultant variability and improve the accuracy of our metric, years one and two pre-fire, and one and two post-fire, were averaged together to calculate dAlbedo in Southern Eurasia, when available (Rogers et al., 2015).
Decreases in tree cover (dTree)
Increases in spring albedo (dAlbedo) were characterized one year after fire using observations spanning day of year (DOY) 49 through 81. Relative decreases in tree cover (dTree) were calculated from the MODIS 250-m vegetation continuous fields product MOD44B (Townshend et al., 2011) averaged to 500-m. Because change ratios can be artificially inflated by low-density stands, only pixels with at least 19% pre-fire tree cover were considered. This threshold adequately separates forest from tundra in North America.
Differenced normalized burn ratio (dNBR) and NDVI
The differenced normalized burn ratio (dNBR) utilizes changes to near- and shortwave-infrared reflectance bands and is generally sensitive to landscape charring, increased soil exposure, and loss of vegetation. Decreases in NDVI (dNDVI) indicate destruction to photosynthetic tissue. These metrics were calculated in similar ways for fires during 2001 - 2012.
dNBR was calculated using the MCD43A3 product:
NBR= PSUB2-PSUB7/PSUB2 + PSUB7
dNBR=NBRsubpre-fire – NBRsubpost-fire
NDVI values were obtained from the MOD13A1 (available from http://e4ftl01.cr.usgs.gov/MOLT/MOD13A1.005/) and MYD13A1 (available from http://e4ftl01.cr.usgs.gov/MOLA/MYD13A1.005/) vegetation indices products, and dNDVI was calculated similar to equation 3. Only the highest-quality observations from summer (DOY 177 - 209) were used for both metrics. In locations where burning occurred early in the season, mainly Southern Eurasia, the landscape experienced two growing seasons by the summer of year one post-fire. For these pixels, using a post-fire value from the following summer notably decreased dNBR and dNDVI compared to using the year-of-fire summer value. Therefore, the year-of summer value was used for all fires occurring in the spring (pre-June 1), which mostly acted to increase mean fire severity in Southern Eurasia.
Summer land surface temperature (dLST)
Increases in summer land surface temperature (dLST) were quantified using DOY 177 - 209 from the 1-km Aqua satellite product (MYD11A2, available from http://e4ftl01.cr.usgs.gov/MOLA/MYD11A2.005/) for fires during 2003 - 2012. Aqua data were used because its daytime overpass time occurs at approximately 1:30 pm, which was expected to provide greater temperature contrasts compared to the 10:30 am overpass time of Terra. One-km pixels were used that contained at least two boreal mask pixels and at least one 500-m burn pixel from the MCD64A1 data set. As with dNBR and dNDVI, post-fire values for dLST were selected from the year-of-fire for spring fires, and from one year post-fire for all others (Rogers et al., 2015).
Crown scorch
FRP, dAlbedo, and dTree were used to estimate crown scorch. The maximum annual FRP for each pixel was used within a 500-m buffer. FRP is the product of fireline intensity and fire line length, and as such is influenced by the length of the fire front, its intensity and rate of spread, and any residual burning in areas the fire front has passed through. FRP has been shown to correlate linearly with scorch height when raised to a power of 2/3. The final measure of FRP for this crown scorch index at a given pixel was thus equal to (maximum annual FRP) 2/3 within a 500-m buffer (the exponent also helps account for the highly right-tailed distribution of FRP values).
An index of crown scorch was calculated for all MCD64A1 500-m burned pixels between 2003 and 2009 that contained valid dAlbedo, dTree, and maximum FRP values. The three metrics were normalized linearly between zero and one, although dAlbedo and dTree were allowed to be negative at individual pixels to preserve regional contrasts. Upper bounds for each variable corresponded to the highest 95th percentile of the four regions (typically North America). A lower bound was set at the lowest 5th percentile (typically Southern Eurasia). Normalized values were then averaged to produce the crown scorch index. Due to the lack of validation data, an attempt was not made to actually separate crown from surface fires (Rogers et al., 2015).
Vegetation destruction
An index of live vegetation destruction was created from dNBR, dNDVI, and dLST. Together, these metrics provide information about fire-induced losses in to synthesizing and transpiring vegetation, reductions in upper-layer soil water and roughness length, and the degree of landscape charring. As with our index of crown scorch, burned pixels during 2003 - 2012 that contained valid data for these three products were used. Values were normalized between zero and one in a manner similar to dAlbedo and dTree (above), and averaged together to produce an index.
Longer-term responses of spring albedo (dAlbedolt) and tree cover (dTreelt)
Fires during 2001 - 2008 were used to characterize longer-term responses of spring albedo and tree cover. Post-fire trajectories were derived for each variable using fires between 2001 and 2005. For every fire year, variables were tracked from the pre-fire year through maximum post-fire year for pixels that contained a valid pre-fire year and at least one valid post-fire year data point. Collections of trajectories were then averaged to produce one coherent time series. Because these variables may display temporal trends, burned trajectories were normalized by control trajectories, derived in the same manner using all available pixels for each fire year. Because of the relatively high inter-annual variability in spring albedo in Southern Eurasia, a running three-year average filter was used for spring albedo in each pixel for this region when applicable. Uncertainty in the trajectories was quantified by deriving them separately from each fire year between 2001 and 2005. Trajectories for Eurasia were calculated by averaging the separate Eurasian regional trajectories, weighted by total burned area. These longer-term responses of spring albedo (dAlbedolt) and tree cover (dTreelt) were used to quantify longer-term burn severity. Based on our trajectories, post-fire trajectories were averaged for years 5 - 12 for spring albedo and 5 - 7 for tree cover from fires during 2001 - 2008 to derive dAlbedolt and dTreelt (Rogers et al., 2015).
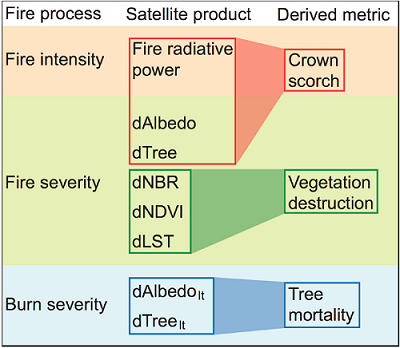
Figure 2. Conceptual flowchart for derived fire intensity, fire severity, and burn severity metrics (Rogers et al., 2015, Supplementary Figure 3).
Total relative tree mortality
Total relative tree mortality was quantified using a similar index-based method with dAlbedolt and dTreelt. The MODIS tree cover product was useful for this assessment because it represents the fractional coverage of trees. However, its accuracy over boreal forests and burned landscapes has not been fully explored. Because of the expected non-linear and regionally-dependent correlation between spring albedo and tree cover, functions were first derived relating the two for each region based on all pixels containing valid values for both. For each pixel, spring albedo from the pre-fire year and the mean from the post-fire years were transformed into tree cover using the above relationships. Relative decreases in tree cover were estimated from the albedo-transformed values using the same approach as for dTreelt. These two independent metrics of decreased relative tree cover were then normalized to values between zero and one and averaged in a similar manner to the other derived metrics. The resultant index was multiplied by a scalar to arrive at actual percent tree mortality, with an upper threshold of 100%. A multiplier was chosen that resulted in a mean North American tree mortality of 80%. Although no regional or continental estimates of fire-induced tree mortality are available for North America or Eurasia, mortality is assumed to be near -complete in North America. Our estimate of 80% mortality across North America therefore theoretically accounts for unburned fractions in the moderate-resolution imagery, assuming near-complete mortality at the fire -affected plot level (temporal consideration is especially important here, as estimates of immediate mortality in northern Eurasia were substantially less than decade-integrated totals) (Rogers et al., 2015).
Data Access
These data are available through the Oak Ridge National Laboratory (ORNL) Distributed Active Archive Center (DAAC).
Fire Intensity and Burn Severity Metrics for Circumpolar Boreal Forests, 2001-2013
Contact for Data Center Access Information:
- E-mail: uso@daac.ornl.gov
- Telephone: +1 (865) 241-3952
References
Giglio, L., I. Csiszar, and C.O. Justice. Global distribution and seasonality of active fires as observed with the Terra and Aqua Moderate Resolution Imaging Spectroradiometer (MODIS) sensors. J. Geophys. Res.-Biogeosciences 111, G02016 (2006) http://dx.doi.org/ 10.1029/2005JG000142
Hijmans, R.J., S.E. Cameron, J.L. Parra, P.G. Jones, and A. Jarvis. Very high resolution interpolated climate surfaces for global land areas. Int. J. Climatol. 25, 1965–1978 (2005). http://dx.doi.org/10.1002/joc.1276
Rogers, B.M., A.J. Soja, M.L. Goulden, J.T. Randerson. 2015. Influence of tree species on continental differences in boreal fires and climate feedbacks. Nature Geoscience 8, 228-234. http://dx.doi.org/10.1038/ngeo2352
Townshend, J.R.G. et al. Vegetation Continuous Fields MOD44B, 2000 - 2010 Percent Tree Cover, Collection 5. (Univ. of Maryland, 2011).