Get Data
Revision Date: May 29, 2014
Summary:
This data set provides estimates of different forms of naturally occurring soil phosphorus (P) including labile inorganic P, organic P, occluded P, secondary mineral P, apatite P, and total P on a global scale at 0.5-degree resolution.
The data were assembled from chronosequence information and global spatial databases to develop a map of total soil P and the distribution among mineral bound, labile, organic, occluded, and secondary P forms in soils. Uncertainty was calculated for the different forms. The data set has no explicit temporal component -- data were nominally for the pre-industrial period ca. 1850.
The estimated global spatial variation and distribution of different soil P forms presented in this study will be useful for global biogeochemistry models that include P as a limiting element in biological production by providing initial estimates of the available soil P for plant uptake and microbial utilization (Yang et al., 2013).
There is one netCDF data file (.nc) with this data set.
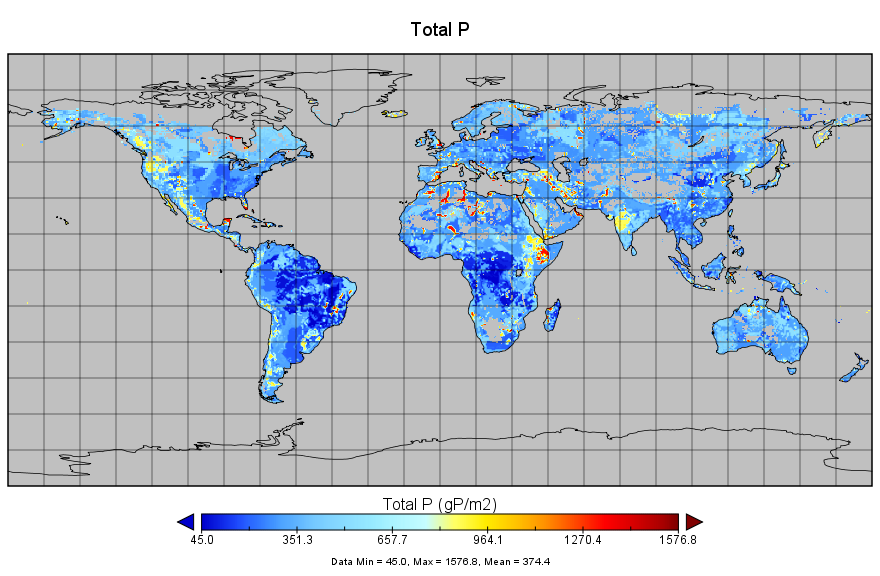
Figure 1. Map of total global soil Phosphorus distribution.
Acknowledgements. This research was sponsored by the US Department of Energy, Office of Science, Biological and Environmental Research (BER) programs and performed at Oak Ridge National Laboratory (ORNL). A. Jain was funded by the NASA LCLUC Program (No. NNX08AK75G) and the Office of Science (BER), US Department of Energy (DOE-DE-SC0006706).
Data and Documentation Access:
Get Data: http://daac.ornl.gov/cgi-bin/dsviewer.pl?ds_id=1223
Data Citation:
Cite this data set as follows:
Yang, X., W.M. Post, P.E. Thornton, and A. Jain. 2014. Global Gridded Soil Phosphorus Distribution Maps at 0.5-degree Resolution. Data set. Available on-line [http://daac.ornl.gov] from Oak Ridge National Laboratory Distributed Active Archive Center, Oak Ridge, Tennessee, USA. http://dx.doi.org/10.3334/ORNLDAAC/1223
Table of Contents:
- 1 Data Set Overview
- 2 Data Characteristics
- 3 Applications and Derivation
- 4 Quality Assessment
- 5 Acquisition Materials and Methods
- 6 Data Access
- 7 References
1. Data Set Overview:
This data set provides estimates of different forms of naturally occurring soil Phosphorus (P) (labile inorganic P, organic P, occluded P, secondary mineral P, apatite P, and total P) on a global scale. An approach was developed that utilized existing knowledge of soil P processes and databases of parent material and soil P measurements to provide spatially explicit estimates of different forms of naturally occurring soil P.
2. Data Characteristics:
There is one netCDF (version 3) data file (.nc) with this data set. The data were assembled from chronosequence information and global spatial databases (Yang et al., 2013).
All P units are in grams P per m2 (g P/m2). Fill values are -9999.
Table 1. File name: pforms_den.nc
| Variable abbreviation | Variable description |
|---|---|
| Tot | Total P |
| lat | degrees N |
| lon | degrees East |
| Lab | Labile Inorganic P |
| org | organic P |
| Occ | Occluded P |
| Sec | Secondary Mineral P |
| apa | apatite P |
Site boundaries: (All latitude and longitude given in decimal degrees)
| Site (Region) | Westernmost Longitude | Easternmost Longitude | Northernmost Latitude | Southernmost Latitude |
|---|---|---|---|---|
| Global | -180 | 180 | 90 | -90 |
Temporal Coverage
The data set has no explicit temporal component. Data were nominally for the year 1850.
3. Data Application and Derivation:
Despite the large uncertainty, the estimated global spatial variation and distribution of different soil P forms presented in this study will be useful for global biogeochemistry models that include P as a limiting element in biological production by providing initial estimates of the available soil P for plant uptake and microbial utilization (Yang et al., 2013).
4. Quality Assessment:
The coefficient of variation (%, standard derivation divided by mean then multiplied by 100) was used to describe the uncertainty in our estimate, which was large. The large uncertainty reflects our limited understanding of the processes controlling soil P transformations during pedogenesis and a deficiency in the number of soil P measurements (Yang et al., 2013).
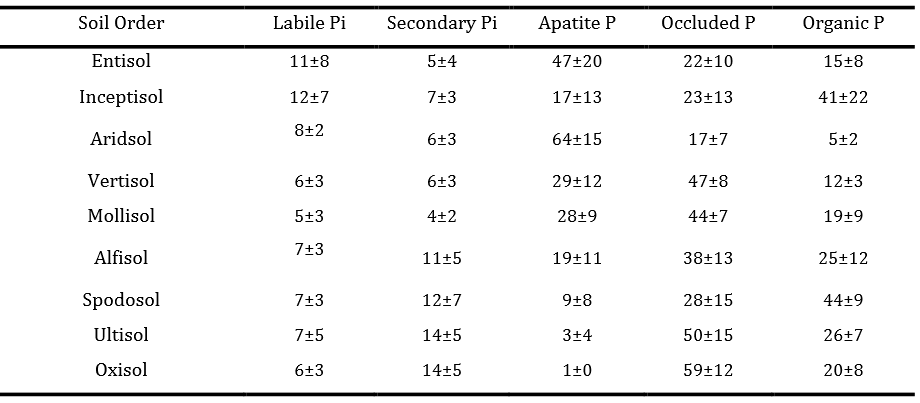
Table 2. Percentage of P (mean ± sd) in different forms based on Hedley P database (based on Yang and Post, 2011).
5. Data Acquisition Materials and Methods:
This data set provides spatial estimates of different forms of naturally occurring soil P on the global scale. An approach was developed that utilized existing knowledge of soil P processes and databases of parent material and soil P measurements (Yang et al., 2013).
The global distribution of the soil parent material
The global distribution of the soil parent material was derived by combining two global surficial lithology maps. The fundamental one was the global surficial lithology map of Durr et al. (2005), which includes 15 rock types plus water and ice. This map was transformed into raster format with the resolution of 0.5 degree × 0.5 degree according to Durr et al., 2005. The data were summarized to derive the dominant rock type for each grid cell. Each 0.5-degree grid cell in the sedimentary rock category was further designated as either shale or sandstone by overlaying the Amiotte Suchet et al. (2003) map, which consists of global distribution of 6 main rock types (shales and sandstones as separate categories) at 0.5-degree resolution.
P concentration in parent material of soils
The P concentration (ppm) of each lithology unit was assigned values from Hartmann et al. (2012), which is based on a literature review of typical rock P concentration and composition of rock types per lithology classes. P concentration of loess in Hartmann et al. (2012) was based on Chinese loess. The P concentration of glacial loess in North America and other regions was assigned based on measurements from previous studies (Runge et al., 1974).
Quantification of soil P transformations
The Walker and Syers conceptual model of P transformations during pedogenesis provided a useful tool to link soil development stages and soil P amount and forms (Johnson et al., 2003; Smeck, 1985). For the quantification of this conceptual model, two kinds of information were needed: 1) the percentage loss of parent material P for soils in different weathering stages, for which we relied on soil P data from chronosequence studies and soil profile measurements, and 2) the fraction of different forms of P for each United States Department of Agriculture (USDA) soil order, which were derived based on Hedley P data compiled from the literature (Yang and Post, 2011).
A phosphorus pedogenic depletion index (PPDI), an estimate of the accumulated loss of parent material P during pedogenesis, was provided by most of the chronosequence and soil profile studies, or was caluculated according to the following equation:
PPDI = (1− TP TP0 ×(ε +1))×100%
where TP is the current total soil P content (in kg P ha−1 or g Pm−2) and TP0 is the total P content (in kg P ha−1 or g Pm−2) of the least weathered soil in the chronosequence or the total P in the unweathered horizon for the soil profile. ε is the volumetric soil strain (Brimhall and Dietrich, 1987; Brimhall et al., 1992). P content was either provided in literature cited or calculated by multiplying P concentration (in ppm) with bulk density and the depth sampled. Using these chronosequence and soil profile measurements, the average PPDI was derived for slightly and intermediately weathered soil categories. The PPDI was calculated for highly weathered Spodosols, Ultisols, and Oxisols individually.
Hedley P data
The Hedley sequential fractionation method (Hedley and Stewart, 1982; Tiessen and Moir, 1993) has gained considerable attention as a useful tool to examine different forms of soil P and provides a comprehensive assessment of available P in soils (Johnson et al., 2003). We expanded an earlier study (Cross and Schlesinger, 1995) that summarized Hedley P data and created a larger Hedley P database that included 178 published Hedley fractionation measurements (Yang and Post, 2011). The compiled literature data was summarized by soil order for fractions of total P in different P forms.
Distributions of different P forms in soils
The spatial distribution of soil P forms was developed in three main steps:
First, the parent material map was combined with the rock P concentration database to generate a map of parent material P concentration.
Second, the map was derived of total P content in top 50 cm soils by overlaying the map of soil order on the map of parent material P, and applying PPDI and soil strain using the following equation:
TPS = 0.01D x ρPCP(1−PPDI)/ ε +1
Where TPS (g Pm−2) is total P in the top 50 cm soil, D is the soil depth (50 cm), ρp (g cm−3) is the bulk density of parent material, CP (ppm) is parent material P concentration, and ε is the volumetric soil strain.
Third, the maps of different forms of P in soils were derived by applying the relationship between soil order and the fractions of total P held in different P forms derived based on literature Hedley data.
The global distribution of soil orders was obtained from the USDA website (http://www.nrcs.usda.gov/wps/portal/nrcs/detail/national/home/?cid=nrcs142p2_054013). For Latin America, the soil order map based on the Soil and Terrain database for Latin America and the Caribbean (SOTERLAC, http://www.isric.org/ was used. The (Food and Agriculture Organization) FAO90 soil code used in the SOTERLAC database was converted to USDA soil taxonomy following Quesada (2011). The SOTERLAC database was used to replace the USDA soil order map for Latin America because the USDA map is based on a reclassification of the FAO-UNESCO Soil Map of the World combined with a soil climate map, which has a considerable bias towards the dominance of Oxisols (Ferralsols in FAO map) in Amazonia (Richter and Babbar, 1991).
6. Data Access:
This data is available through the Oak Ridge National Laboratory (ORNL) Distributed Active Archive Center (DAAC).
Data Archive Center:
Contact for Data Center Access Information:
E-mail: uso@daac.ornl.gov
Telephone: +1 (865) 241-3952
7. References:
Amiotte Suchet, P. Worldwide distribution of continental rock lithology: Implications for the atmospheric/soil CO2 uptake by continental weathering and alkalinity river transport to the oceans, Global Biogeochem. Cy., 17, 1038, doi:10.1029/2002gb001891, 2003.
Brimhall, G. H., Chadwick, O.A., Lewis, C.J., Compston, W., Williams, I.S., Danti, K.J., Dietrich, W.E., Power, M.E., Hendricks, D., and Bratt, J. Deformational mass transport and invasive processes in soil evolution, Science, 255, 695-702, 1992.
Brimhall, G.H. and Dietrich, W.E. Constitutive mass balance relations between chemical composition, volume, density, porosity, and strain in metasomatic hydrochemical systems: results on weathering and pedogenesis, Geochim. Cosmochim. Ac., 51, 567-587, 1987.
Durr , H., M. Meybeck, and S. Durr. Lithologic composition of the Earth’s continental surfaces derived from a new digital map emphasizing riverine material transfer, Global Biogeochem. Cy., 19, doi:10.1029/2005GB002515, 2005.
Hartmann, J., H.H. Durr, N. Moosdorf, M. Meybeck, and S. Kempe. The geochemical composition of the terrestrial surface (without soils) and comparison with the upper continental crust, Int. J. Earth Sci., 101, 365-376, 2012.
Hedley, M. and J. Stewart. Method to measure microbial phosphate in soils, Soil Biol. Biochem., 14, 377-385, 1982.
Johnson, A.H., J. Frizano, and D.R. Vann. Biogeochemical implications of labile phosphorus in forest soils determined by the Hedley fractionation procedure, Oecologia, 135, 487-499, 2003.
Richter, D. and L. Babbar. Soil diversity in the tropics, Adv. Ecol. Res., 21, 315-389, 1991.
Runge, E., T. Walker, and D. Howarth. A study of Late Pleistocene loess deposits, South Canterbury, New Zealand. Part I. Forms and amounts of phosphorus compared with other techniques for identifying paleosols, Quat. Res., 4, 76-84, 1974.
Smeck, N. Phosphorus dynamics in soils and landscapes, Geoderma, 36, 185–199, 1985.
Tiessen, H. and J.O. Moir. Characterization of available P by sequential extraction, in: Soil sampling and methods of analysis, 2 ed., edited by: Carter, M., and Gregorich, E., CRC Press, Taylor & Francis Group, Boca Raton, FL, 75-86, 1993.
Yang, X., W.M. Post, P.R. Thornton, and A. Jain. The distribution of soil phosphorus for global biogeochemical modeling, Biogeosciences, 10, 2525-2537, doi:10.5194/bg-10-2525-213, 2013.
Yang, X. and W.M. Post. Phosphorus transformations as a function of pedogenesis: A synthesis of soil phosphorus data using Hedley fractionation method, Biogeosciences, 8, 2907-2916, doi:10.5194/bg-8-2907-2011, 2011.