Get Data
Revision Date: January 12, 2015
Summary:
This data set provides the concentrations of soil microbial biomass carbon (C), nitrogen (N) and phosphorus (P), soil organic carbon, total nitrogen, and total phosphorus at biome and global scales. The data were compiled from a comprehensive survey of publications from the late 1970s to 2012 and include 3,422 data points from 315 papers. These data are from soil samples collected primarily at 0-15 cm depth with some from 0-30 cm. In addition, data were compiled for soil microbial biomass concentrations from soil profile samples to depths of 100 cm.
Sampling site latitude and longitude were available for the majority of the samples that enabled assembling additional soil properties, site characteristics, vegetation distributions, biomes, and long-term climate data from several global sources of soil, land-cover, and climate data. These site attributes are included with the microbial biomass data.
This data set contains two *.csv files of the soil microbial biomass C, N, P data. The first provides all compiled results emphasizing the full spatial extent of the data, while the second is a subset that provides only data from a series of profile samples emphasizing the vertical distribution of microbial biomass concentrations.
There is a companion file, also in .csv format, of the references for the surveyed publications. A reference_number relates the data to the respective publication.
The concentrations of soil microbial biomass, in combination with other soil databases, were used to estimate the global storage of soil microbial biomass C and N in 0-30 cm and 0-100 cm soil profiles. These storage estimates were combined with a spatial map of 12 major biomes (boreal forest, temperate coniferous forest, temperate broadleaf forest, tropical and subtropical forests, mixed forest, grassland, shrub, tundra, desert, natural wetland, cropland, and pasture) at 0.05-degree by 0.5-degree spatial resolution. The biome map and six estimates of C and N storage and C:N ration in soil microbial biomass are provided in a single netCDF format file.
In summary, there are two .csv files of soil microbial biomass C, N, and P concentration data and one netCDF file of global C and N soil profile storage estimates with this data set.
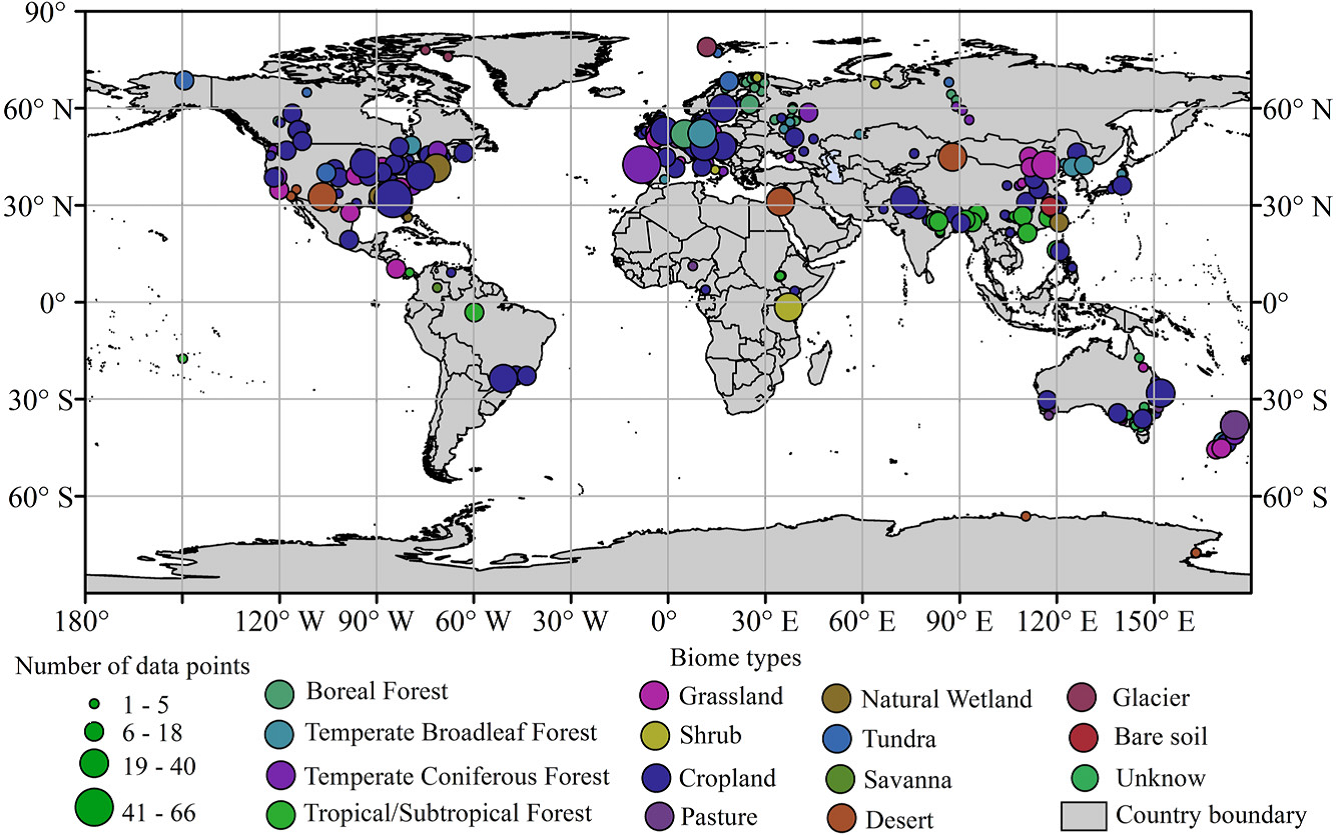
Figure 1. Distribution of the data points used in this study (3,259 out of 3,422 data points with geographical coordinates are shown in this map (from Xu et al., 2013)).
Data and Documentation Access:
Get Data: http://daac.ornl.gov/cgi-bin/dsviewer.pl?ds_id=1264
Companion Documentation:
XuXF2013_GEB.pdf: A global analysis of soil microbial biomass carbon, nitrogen and phosphorus in terrestrial ecosystems
Soil_Microbial_Biomass_C_N_P_references.csv: References for the surveyed publications
Data Citation:
Cite this data set as follows:
Xu, X., P.E. Thornton, and W.M. Post. 2014. A Compilation of Global Soil Microbial Biomass Carbon, Nitrogen, and Phosphorus Data. Data set. Available on-line [http://daac.ornl.gov] from Oak Ridge National Laboratory Distributed Active Archive Center, Oak Ridge, Tennessee, USA. http://dx.doi.org/10.3334/ORNLDAAC/1264
Table of Contents:
- 1 Data Set Overview
- 2 Data Characteristics
- 3 Applications and Derivation
- 4 Quality Assessment
- 5 Acquisition Materials and Methods
- 6 Data Access
- 7 References
1. Data Set Overview:
This data set provides the concentrations of soil microbial biomass carbon (C), nitrogen (N) and phosphorus (P), soil organic carbon, total nitrogen, and total phosphorus at biome and global scales. The data were compiled from a comprehensive survey of publications from the late 1970s to 2012 and include 3,422 data points from 315 papers. These data are from soil samples collected primarily at 0-15 cm depth with some from 0-30 cm. In addition, data were compiled for soil microbial biomass concentrations from soil profile samples to depths of 100 cm.
Sampling site latitude and longitude were available for the majority of the samples that enabled assembling additional soil properties, site characteristics, vegetation distributions, biomes, and long-term climate data from several global sources of soil, land-cover, and climate data. These site attributes are included with the microbial biomass data.
2. Data Characteristics:
Data File Information
There are two data files in comma-separated (.csv) format and one NetCDF v3/v4 (*.nc4) file at 0.05-degree by 0.5-degree spatial resolution.
File #1: Soil_Microbial_Biomass_C_N_P_spatial.csv
File #2: Soil_Microbial_Biomass_C_N_P_vertical.csv
Both files have the same column headings. Recall that the *_vertical.csv file is a subset of the *_spatial.csv file.
Missing values for both character and numeric fields are null (blank cells). The % completeness column (out of 3,422 possible values in the Soil_Microbial_Biomass_C_N_P_spatial.csv file) shows that most publications offered carbon results and fewer with nitrogen and phosphorus.
| Column | Column heading | Units/format | Description | % Completeness of 3,422 possible values in *_spatial.csv |
|---|---|---|---|---|
| 1 | Country | Country of study site where data were collected | 100 | |
| 2 | Biome | categorical | Biome type used for regional extrapolation: Boreal forest; Temperate Coniferous forest; Temperate Broadleaf forest; Tropical/Subtropical forest; Mixed forest; Grassland; Shrubland; Tundra; Desert; Natural wetlands; Cropland; Pasture | 100 |
| 3 | Lat | decimal degrees | Latitude of study site where soil samples were collected | 95 |
| 4 | Lon | decimal degrees | Longitude of study site where soil samples were collected | 95 |
| 5 | Elevation | Elevation of study site where soil samples were collected | 23 | |
| 6 | Vegetation | Vegetation at study site where soil samples were collected | 77 | |
| 7 | MAT | degrees C | Temperature for the region where soil samples were collected in degrees C. Climate data were provided by the University of East Anglia Climatic Research Unit (http:// www.cru.uea.ac.uk/) | 33 |
| 8 | MAP | mm | Precipitation data for the region where data were collected in mm. Climate data were provided by the University of East Anglia Climatic Research Unit (http:// www.cru.uea.ac.uk/) | 38 |
| 9 | Soil Microbial Biomass Carbon | mmol Kg-1 | Soil microbial biomass carbon | 93 |
| 10 | Soil Microbial Biomass Nitrogen | mmol Kg-1 | Soil microbial biomass nitrogen | 42 |
| 11 | Soil Microbial Biomass Phosphorus | mmol Kg-1 | Soil microbial biomass phosphorus | 21 |
| 12 | Soil Organic Carbon | mmol Kg-1 | Soil organic carbon | 86 |
| 13 | Total Nitrogen | mmol Kg-1 | Total nitrogen | 63 |
| 14 | Total Organic Phosphorus | mmol Kg-1 | Total organic phosphorus content | 16 |
| 15 | pH | Soil pH | 64 | |
| 16 | Date | Date when soil samples were collected at study site | 70 | |
| 17 | Upper_depth | cm | Upper depth of soil sample interval | 89 |
| 18 | Lower_depth | cm | Soil sampling depth in cm | 86 |
| 19 | Depth | character | Soil sampling depth in cm | 89 |
| 20 | Note | character | Note pertaining to study site where data were collected | 54 |
| 21 | Method | character | Method used in studies to measure
soil microbial biomass C, N, or P. FE: fumigation extraction (Vance et al., 1987) FI: fumigation incubation (Jenkinson, 1966, 1988) SIR: substrate induced respiration (Anderson and Domsch, 1978) |
100 |
| 22 | Geographical coordinate | character | Note pertaining to the collection and assignment of the geographical coordinates for the study sites | 52 |
| 23 | Reference_number | integer | Reference for the data source | 100 |
File #3: Global_Soil_Microbial_BiomassCN.nc: A NetCDF v3/v4 (*.nc4) file at 0.05-degree spatial resolution. Missing and fill values are reported as -9999.
Data Center Processing Note: Attributes in the netCDF header were modified by the ORNL DAAC to bring the file into CF Convention compliance. All other aspects of the file were left unchanged.
| Parameter | Units/format | Description |
|---|---|---|
| Lat | decimal degrees | Latitude |
| Lon | decimal degrees | Longitude |
| Biome | categorical | Biome type used for regional extrapolation: Boreal forest; Temperate Coniferous forest; Temperate Broadleaf forest; Tropical/Subtropical forest; Mixed forest; Grassland; Shrubland; Tundra; Desert; Natural wetlands; Cropland; Pasture |
| SMC30cm | gC/m2 | Soil microbial biomass carbon in top 30 cm soil profile |
| SMN30cm | gN/m2 | Soil microbial biomass nitrogen in top 30 cm soil profile |
| SMC100cm | gC/m2 | Soil microbial biomass carbon in top 100 cm soil profile |
| SMN100cm | gN/m2 | Soil microbial biomass nitrogen in top 100 cm soil profile |
| CN30cm | C:N ratio of soil microbial biomass in top 30 cm soil profile | |
| CN100cm | C:N ratio of soil microbial biomass in top 100 cm soil profile |
Spatial Coverage
Point data and spatial data in 0.5-degree resolution.
Temporal Coverage
Compilation from published measurements taken between 1977/11/16 to 2012/06/01.
Temporal Resolution
One time estimates
Site boundaries: (All latitude and longitude given in degrees and fractions)
| Site (Region) | Westernmost Longitude | Easternmost Longitude | Northernmost Latitude | Southernmost Latitude |
|---|---|---|---|---|
| Global | -180 | 180 | 90 | -90 |
| Compiled data | -149.83 | 177.9 | 79 | -77.63 |
3. Data Application and Derivation:
The units of compiled data points (mmol Kg-1) and the produced maps (gC/m2) are different. The steps for conversion and calculations from soil elemental concentration was calculated based on soil elemental density, soil bulk density, etc., when producing the global maps of carbon and nitrogen density in the soil microbial biomass, are not described here. See Xu et al., 2013.
4. Quality Assessment:
Sources of uncertainties for the compiled data and for the results of any analyses are described in Xu et al., 2013.
5. Data Acquisition Materials and Methods:
The data in this compilation are based on a comprehensive literature survey. Publications were collected by searching for ‘soil microbial biomass’ in Google Scholar. A few criteria were used to screen the data for this study. The criteria were: (1) the soil microbial biomass (at least one of soil microbial biomass C, N or P) must be reported; (2) the reported soil microbial biomass C, N and P must be less than organic C, total N and total P, respectively, in soils. Based on the second criterion, a few publications used in previous similar studies (Cleveland and Liptzin, 2007; Hartman, 2011) were excluded. Finally, 3,422 data points in 14 biomes across the globe were retrieved from 315 papers (Fig. 1). Fourteen biomes were finally aggregated into 12 biomes for robust statistical analysis. Associated information for the sampling site was also retrieved, including soil pH, sampling depth, sampling date, biome type, latitude, longitude, and climate variables. There is a dynamic version of this database hosted on Google Code (http:// code.google.com/p/global-soil-microbial-biomass/).
The date of publications used spans from the late 1970s to 2012. The number of data points for several biomes were insufficient for a robust statistical analysis, therefore biomes with few data points were aggregated, specifically, savanna was combined into grassland. Several land-cover types were not included in the analysis, for instance glacier and bare soils (mainly urban and industrial sites). Surface soil data were aggregated into 12 major biome types.
The data points were collected for surface soils, primarily 0-15 cm depth with some 0-30 cm; all measurements were assumed to represent the top 0-30 cm soil profile, consistent with previous data sets on global soil organic C and total N (Batjes, 1996; Jobbagy and Jackson, 2000). For those data points with no geographical coordinates reported in the literature, geographical coordinates were searched on based on the names of site, state and country. There were 3,259 data points obtained with geographical information. These geographical coordinates were used to locate the sites on the global map (Fig. 1) and for retrieving the long-term climate conditions associated with these observational data. Also, any available soil microbial biomass data at depth along the soil profile to 100 cm were collected and used to estimate global storage of soil microbial biomass C and N in 0-30 cm and 0-100 cm soil profiles.
Global maps of vegetation distribution, soil properties and long-term climate data were used for spatial extrapolation in order to estimate global storage of soil microbial biomass C and N in terrestrial ecosystems. Climate data were provided by the University of East Anglia Climatic Research Unit (http:// www.cru.uea.ac.uk/); the 1961–90 average climate data were used to represent the long-term climate conditions. The vegetation distribution data were generated by combining several data sources: global pasture and cropland data from Ramankutty et al. (2008); wetland coverage from global wetland distribution data (Aselmann and Crutzen, 1989); the spatial distribution of of other biomes froma vegetation map developed by Ramankutty and Foley (1998).
A spatial map of 12 major biomes was generated: boreal forest, temperate coniferous forest, temperate broadleaf forest, tropical/subtropical forest, mixed forest, grassland, shrub, tundra, desert, cropland and pasture. The spatial distribution of soil property data is from the Harmonized World Soil Database (FAO/IIASA/ISRIC/ ISSCAS/JRC, 2009) and soil element data are from the IGBP-DIS (Global Soil Data Task Group, 2000) data set (available online from Oak Ridge National Laboratory Distributed Active Archive Center). Since soil data for organic C and total N in the IGBP-DIS are for the 100-cm profile as a whole, the Harmonized World Soil Database was used to calculate the fraction of soil organic C and total N in the top 0-30 cm. It was then combined with the vertical distribution of soil microbial biomass to estimate the global storage of soil microbial biomass C and N in the 0-30 cm and 0-100 cm soil profiles.
Three different methods for measuring soil microbial biomass C, N and/or P over the past decades are presented in the data set. These include the fumigation extraction (FE) method (Vance et al., 1987), the fumigation incubation (FI) method (Jenkinson, 1966, 1988), and the substrate induced respiration (SIR) method (Anderson and Domsch, 1978). The FE and FI methods account for 55 and 26%, respectively, of the total measurements. The FE method was invented in 1987 (Vance et al., 1987), and after several years it was broadly applied. Since 1990, the FE, FI and SIR methods have contributed 62, 19 and 16% of the reported soil microbial biomass measurements. This is consistent with a recent summary of methods used in soil microbial biomass measurements (Joergensen, 2010; Joergensen et al., 2011).
6. Data Access:
These data are available through the Oak Ridge National Laboratory (ORNL) Distributed Active Archive Center (DAAC).
Data Archive Center:
Contact for Data Center Access Information:
E-mail: uso@daac.ornl.gov
Telephone: +1 (865)
241-3952
7. References:
Anderson, J.P.E., and K.H. Domsch. 1978. A Physiological Method for the Quantitative Measurement of Microbial Biomass in Soils. Soil Biology and Biochemistry, 10, 215–221.
Aselmann, I., and Crutzen, P.J. 1989. Global Distribution of Natural Freshwater Wetlands and Rice Paddies, their Net Primary Productivity, Seasonality and Possible Methane Emissions. Journal of Atmospheric Chemsitry, 8, 307–358.
FAO/IIASA/ISRIC/ISSCAS/JRC. 2009. Harmonized world soil database (version 1.1). FAO, Rome, Italy and IIASA, Laxenburg, Austria.
Global Soil Data Task Group. 2000. Global Gridded Surfaces of Selected Soil Characteristics (IGBP-DIS). [Global Gridded Surfaces of Selected Soil Characteristics (International Geosphere-Biosphere Programme - Data and Information System)]. Data set. Available on-line [http://www.daac.ornl.gov] from Oak Ridge National Laboratory Distributed Active Archive Center, Oak Ridge, Tennessee, U.S.A. doi:10.3334/ORNLDAAC/569
Hartman, W.H. 2011. Microbial Phosphorus Cycling and Community Assembly in Wetland Soils and Beyond. Dissertation, Duke University, Norman, NC.
Jenkinson, D.S. 1988. The Determination of Microbial Biomass of Carbon and Nitrogen in Soil. Advances in Nitrogen Cycling in Agricultural Ecosystems (ed. by J.R. Wilson), pp. 368–386.CABI, Wallingford.
Jenkinson, D.S. 1966. Studies on the Decomposition of Plant Material in Soil. II. Partial Sterilization of Soil and the Soil Biomass. Journal of Soil Science, 17, 280–302.
Jobbagy, E.G., and R.B. Jackson. 2000. The Vertical Distribution of Soil Organic Carbon and its Relation to Climate and Vegetation. Ecological Applications, 10, 423–436.
Joergensen, R.G., J. Wu, and P.C. Brookes. 2011. Soil Microbial Biomass Using an Automated Procedure. Soil Biology and Biochemistry, 43, 873–876. Cleveland, C.C. and Liptzin, D. (2007) C:N:P stoichiometry in soil: is there a ‘Redfield ratio’ for the microbial biomass? Biogeochemistry,85, 235–252.
Joergensen, R.G. 2010 Organic Matter and Micro-Organisms in Tropical Soils. Soil Biology and Agriculture in the Tropics (ed. by P. Dion), pp. 17–44. Springer, Berlin.
Ramankutty, N., A.T. Evan, C. Monfreda, J.A. Foley, and Farming the Planet: 1. 2008. The Geographic Distribution of Global Agricultural Lands in the Year 2000. Global BiogeochemicalCycles, 22, GB1003.
Ramankutty, N., and J.A. Foley. 1998. Characterizing Patterns of Global Land Use: An Analysis Of Global Croplands Data. Global Biogeochemical Cycles, 12, 667–685.
Vance, E.D., P.C. Brookes, and D.S. Jenkinson. 1987. An Extraction Method for Measuring Soil Microbial Biomass C. Soil Biology and Biochemistry, 19, 703–707.
Xu, X., P.E. Thornton, and W.M. Post. 2013. A Global Analysis of Soil Microbial Biomass Carbon, Nitrogen and Phosphorus in Terrestrial Ecosystems. Global Ecology and Biogeography, (Global Ecol. Biogeogr.), 22, 737–749. DOI: 10.1111/geb.12029