Documentation Revision Date: 2023-11-27
Dataset Version: 1
Summary
This dataset includes 548 files: 91 data files in HDF-5 format, 91 ENVI binary data files with an accompanying header file, 91 files in Keyhole Markup Language (KML), 91 files in compressed KML (KMZ), 91 quicklook images in Portable Network Graphics (PNG) format, and two files in comma-separated values (CSV) format.
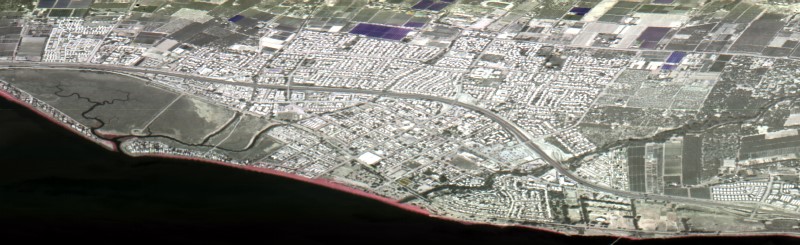
Figure 1. Portion of quicklook image from HyTES instrument collected on 2022-03-23 for the SHIFT campaign. Image shows the coast in the vicinity of Carpinteria, California, east of Santa Barbara (latitude 34.395, longitude -119.525). Source: 20220323t215708_SantaBarbaraCA_L1_B103_V01.png
Citation
Rivera, G., W.R. Johnson, R.J. Freepartner, B.T. Eng, and S.J. Hook. 2023. SHIFT: HyTES L1 Brightness Temperature, March 23 2022. ORNL DAAC, Oak Ridge, Tennessee, USA. https://doi.org/10.3334/ORNLDAAC/2245
Table of Contents
- Dataset Overview
- Data Characteristics
- Application and Derivation
- Quality Assessment
- Data Acquisition, Materials, and Methods
- Data Access
- References
Dataset Overview
This dataset holds Level 1 (L1) brightness temperature data collected by the Hyperspectral Thermal Emission Spectrometer (HyTES) instrument. This imagery was acquired as part of the Surface Biology and Geology High-Frequency Time Series (SHIFT) campaign on March 23, 2022. The SHIFT campaign generated precise, high-frequency data on plant communities for nearly 1,656 square kilometers across Santa Barbara County, California, US, and the nearby ocean. HyTES is a compact image spectrometer that acquires data in 256 spectral bands between 7.5 and 12 micrometers; it was deployed on a Twin Otter aircraft. The SHIFT campaign sought to demonstrate the joint use of both VSWIR and thermal infrared (TIR) data. TIR data are used to measure land surface temperature (LST), which informs models of water flux from land surface through processes such as evapotranspiration. LST is sensitive to solar heat gains and local cooling effects due to evaporative cooling. The HyTES instrument measures TIR radiances that can be used to derive LST, emissivity and Level 3 products such as latent heat flux and detection of air pollution sources. The HyTES data are provided in HDF5 format and include 91 flight scenes. The data are not projected, but georeferencing information for each pixel are provided in the HDF5 and a separate ENVI file for each flight scene. In addition, the flight scene boundaries and an overlay image are provided in Keyhole Markup Language (KML) along with a quicklook image and spectral response data.
Project: Surface Biology and Geology High-Frequency Time Series (SHIFT)
The Surface Biology and Geology (SBG) High Frequency Time Series (SHIFT) was an airborne and field campaign during February to May, 2022, with a follow up activity for one week in September, in support of NASA's SBG mission. Its study area included a 640-square-mile (1,656-square-kilometer) area in Santa Barbara County and the coastal Pacific waters. The primary goal of the SHIFT campaign was to collect a repeated dense time series of airborne Visible to ShortWave Infrared (VSWIR) airborne imaging spectroscopy data with coincident field measurements in both inland terrestrial and coastal aquatic areas, supported in part by a broad team of research collaborators at academic institutions. The SHIFT campaign leveraged NASA's Airborne Visible-Infrared Imaging Spectrometer-Next Generation (AVIRIS-NG) facility instrument to collect approximately weekly VSWIR imagery across the study area. The SHIFT campaign 1) enables the NASA SBG team to conduct traceability analyses related to the science value of VSWIR revisit without relying on multispectral proxies, 2) enables testing algorithms for consistent performance over seasonal time scales and end-to-end workflows including community distribution, and 3) provides early adoption test cases to SHIFT application users and incubate relationships with basic and applied science partners at the University of California Santa Barbara Sedgwick Reserve and The Nature Conservancy's Jack and Laura Dangermond Preserve.
Related Datasets
Hulley, G.C., R.J. Freepartner, and S.J. Hook. 2023. SHIFT: HyTES L2 Geolocated Land Surface Temperature and Emissivity, March 23 2022. ORNL DAAC, Oak Ridge, Tennessee, USA. https://doi.org/10.3334/ORNLDAAC/2246
Hulley, G.C., R.J. Freepartner, and S. J. Hook. 2023. SHIFT: HyTES L3 Geolocated Multispecies Gas Products, March 23 2022. ORNL DAAC, Oak Ridge, Tennessee, USA. https://doi.org/10.3334/ORNLDAAC/2247
Acknowledgement
SHIFT is jointly led by NASA’s Jet Propulsion Laboratory, The Nature Conservancy, and the University of California, Santa Barbara (UCSB).
Data Characteristics
Spatial Coverage: Santa Barbara County, California and nearby Pacific Ocean
Spatial Resolution: Variable by flight segment; generally between 3 to 6 meters.
Temporal Coverage: 2022-03-23
Temporal Resolution: Multiple flight segments over the study area on a single day
Study Area: (All latitudes and longitudes given in decimal degrees)
| Study Area | Westernmost Longitude | Easternmost Longitude | Northernmost Latitude | Southernmost Latitude |
|---|---|---|---|---|
| Santa Barbara County, California and nearby Pacific Ocean | -120.604 | -118.784 | 34.886 | 33.180 |
Data File Information
This dataset includes 548 files: 91 data files in HDF-5 format, 91 ENVI binary data files with an accompanying header file, 91 files in Keyhole Markup Language (KML), 91 files in compressed KML (KMZ), 91 quicklook images in Portable Network Graphics (PNG) format, and two files in comma-separated values (CSV) format.
There are 91 flight scenes with six files for each scene.
The naming convention for most data files is <date>t<time>_<location>_<product level>_<build ID>_<version ID>.<file format type>
- <date> = date in YYYYMMDD
- <time> = time at beginning of data acquisition in HHMMSS. All dates and times are in UTC.
- <location> = short text description of the scene (e.g., "VenturaCA", "SantaBarbaraCA", "PtConceptionCA")
- <product level> = L1 (Level 1)
- <build ID> = software build ID used (e.g., "B103")
- <version ID> = the incremental version the scene has been run for that build id (e.g., "V01")
- <file format> = file format types: "hdf5" = HDF5, "dat" = ENVI binary data, "hdr" = ENVI header file, "kml" = Keyhole Markup Language, "kmz" =compressed KML, and "png" = Portable Network Graphics image.
The HDF5 files hold calibrated brightness temperature (radiance) data. The radiance data are organized in a matrix with three dimensions: lines x samples x bands. The lines are pixels along the flight path, and the number of lines varies with the period of data acquisition. The samples (n = 512) are pixels arranged perpendicular to the flight path. There are 256 wavelength bands covering wavelengths of 7.5 to 12 micrometers. The radiance data are not projected but geolocation information for each pixel is included in the 'pixel_geolocation' dataset in the HDF. The HDF also includes position data for the aircraft platform and pixel-level observation parameters (Table 1).
The ENVI files hold per-pixel geolocation information in an alternative format. Each ENVI includes a binary data file (*.dat) and a header files (*.hdr) that provides metadata in text format. These files are not georeferenced; the data are organized in samples (n=512) and lines (number varies among flight scenes) and bands (n=4, Table 2).
The line dimension of the geolocation data is typically slightly less than that of the radiance data. Due to the slight variation from nadir (as is represented in the camera model), there is not enough geolocation (GPS) information for the last few lines of the scene. Therefore, there is a mismatch of a few lines between the raw scene data and the pixel geolocation data. If using the pixel geolocation information with L1A radiance data, this mismatch should be addressed by clipping radiance data from the end of the scene. The min_geolocation_line and max_geolocation_line variables in the HDF list the first and last lines from the raw data in which geolocation was computed. Lines after max_geolocation_line should be discarded.
The KML files hold the left-hand and right-hand boundaries of the data acquisition along the flight path.
The KMZ files hold an overlay image for the flight scene viewable in Google Earth.
The PNG files are quicklook images for the respective flight scene.
Two CSV files hold information describing the spectral response function for each band (Table 3):
- HyTES_WMX_v6.csv (wave matrix) provides, for each band, a vector of seven wavelengths in microns for which spectral response was measured.
- HyTES_SRF_v6.csv provides, for each band, a vector of seven spectral response intensities measured for wavelengths listed in the wave matrix.
Table 1. Datasets in HDF data files.
| Dataset | Description |
|---|---|
| locational_metadata | Aircraft position, UTC time stamp, time steps (seconds) for each line |
| max_geolocation_line | Acquisition line when geolocation ended |
| min_geolocation_line | Acquisition line when geolocation started |
| pixel_geolocation | Latitude (degrees_north), longitude (degrees_east), height (m), and number of steps taken during ray-casting for each pixel in lines included in geolocation procedure |
| radiance_data | Calibrated brightness temperature (radiance) in W m-2 µm-1 sr-1 |
| raw_data | Raw data from instrument |
| sun_azimuth | Horizontal angle with respect to north of the Sun's position in degrees |
| sun_distance | Distance from surface to Sun in astronomical units (au) |
| sun_zenith | Angle between the sun's rays and the vertical direction in degrees |
| view_azimuth | Horizontal angle with respect to north of the instrument line of sight in degrees |
| view_distance | Distance from surface to instrument in meters |
| view_zenith | Angle between instrument line of sight and the vertical direction in degrees |
Table 2. Bands in the geolocation ENVI files.
| Bands | Units | Description |
|---|---|---|
| Latitude | degrees_north | Pixel latitude in decimal degrees |
| Longitude | degrees_east | Pixel longitude in decimal degrees |
| Altitude | m | Elevation of pixel above mean sea level (a.s.l.) in meters |
| Ray path length | m | Ray path length in meters |
Table 3. Variables in HyTES_WMX_v6.csv and HyTES_SRF_v6.csv.
| Variable | File | Unit | Description |
|---|---|---|---|
| BND | Both | 1 | HyTES band number |
| wvl1, wvl2, ..., wvl7 | HyTES_WMX_v6.csv |
microns |
Wavelengths for which spectral response was measured. Seven columns. |
| HyTES_SRF_v6.csv | 1 | Response intensity for each wavelength. Seven columns. |
Application and Derivation
A primary goal of the SHIFT campaign was to collect a repeated dense time series of airborne Visible to ShortWave Infrared (VSWIR) airborne imaging spectroscopy data with coincident field measurements. The AVIRIS NG instrument collects VSWIR data that will be combined with in-situ measurements of plant diversity and ecophysiology to produce weekly estimates of ecosystem function over the 1,656-km2 study area. In addition to VSWIR data collected during SHIFT, the campaign also collected data in the TIR from the Hyperspectral Thermal Emission Spectrometer (HyTES). HyTES is a pushbroom imaging spectrometer that produces a wide-swath TIR image with high spatial resolution and high spectral resolution (256 bands from 7.5 to 12 μm) providing airborne data of land surface temperature (LST) and emissivity at ~5 m spatial resolution (Hook et al. 2013, Hulley et al. 2016). The addition of HyTES was key for demonstrating the joint use of both TIR and VSWIR with the upcoming SBG mission.
Quality Assessment
Standard calibration procedures for the HyTES instrument were followed. HyTES maintains a set of calibration files for each campaign: https://hytes.jpl.nasa.gov/documents/cal.
Data Acquisition, Materials, and Methods
The Hyperspectral Thermal Emission Spectrometer (HyTES) is an airborne imaging spectrometer with 256 spectral channels between 7.5 and 12 micrometers in the thermal infrared part of the electromagnetic spectrum and 512 pixels cross-track. HyTES was developed to support the Hyperspectral Infrared Imager (HyspIRI) mission and has been flown since 2012. (Johnson et al., 2011; Hook et al., 2013). It provides high spatial and high spectral resolution data on surface temperature and emissivity. It's capabilities include identification of air pollution point sources (Hulley et al., 2016) and geological studies. Additional details about the HyTES instrument are available at https://hytes.jpl.nasa.gov. Additional information about HyTES files is available at https://hytes.jpl.nasa.gov/documents/file-description.
HyTES flights were carried out over the region of the SHIFT campaign study area (Figure 2) on 23 March 2022 from 10:14 AM to 2:57 PM Pacific Time, resulting in 91 flight scenes. Imagery data were processed to Level-1 brightness temperature at sensor.
Level-2 land surface temperature and emissivity and Level-3 multi-species gas products for CH4, H2S, SO2 and NO2 were derived from these L1 data and are available as related datasets.
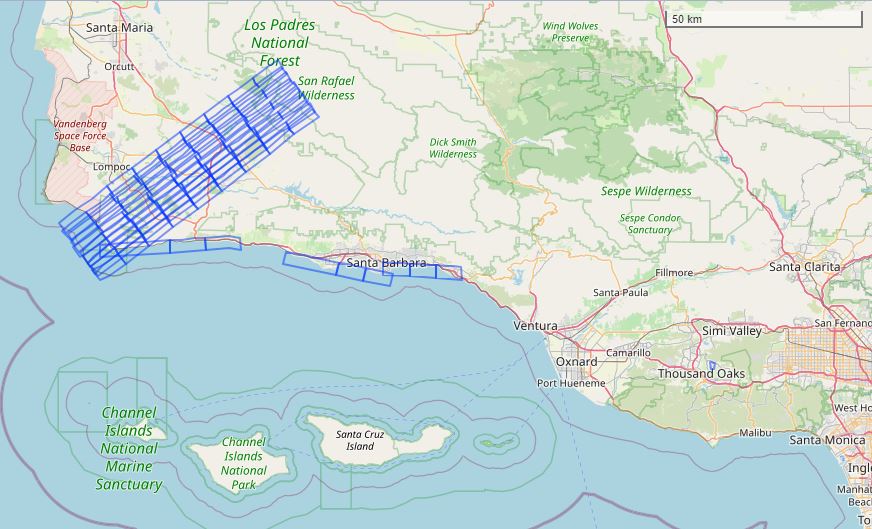
Figure 2. Footprints (blue rectangle) of HyTES flight scenes acquired on March 23 2022 for the SHIFT campaign over Santa Barbara County, California, U.S. Basemap: ©OpenStreetMap contributors.
Data Access
These data are available through the Oak Ridge National Laboratory (ORNL) Distributed Active Archive Center (DAAC).
SHIFT: HyTES L1 Brightness Temperature, March 23 2022
Contact for Data Center Access Information:
- E-mail: uso@daac.ornl.gov
- Telephone: +1 (865) 241-3952
References
Hook, S.J., W.R. Johnson, and M.J. Abrams. 2013. NASA’s Hyperspectral Thermal Emission Spectrometer (HyTES). In: C. Kuenzer and S. Dech (eds). Thermal Infrared Remote Sensing. Remote Sensing and Digital Image Processing, vol 17. Springer, Dordrecht. https://doi.org/10.1007/978-94-007-6639-6_5
Hulley, G. C., R.M. Duren, F.M. Hopkins, S.J. Hook, N. Vance, P. Guillevic, W. R. Johnson, B.T. Eng, J.M. Mihaly, V.M. Jovanovic, S.L. Chazanoff, Z.K.Staniszewski, L. Kuai, J. Worden, C. Frankenberg, G. Rivera, A.D. Aubrey, C.E. Miller, N.K. Malakar, J.M. Sánchez Tomás, and K.T. Holmes. 2016. High spatial resolution imaging of methane and other trace gases with the airborne Hyperspectral Thermal Emission Spectrometer (HyTES). Atmospheric Measurement Techniques 9:2393–2408. https://doi.org/10.5194/amt-9-2393-2016
Hulley, G.C., R.J. Freepartner, and S.J. Hook. 2023. SHIFT: HyTES L2 Geolocated Land Surface Temperature and Emissivity, March 23 2022. ORNL DAAC, Oak Ridge, Tennessee, USA. https://doi.org/10.3334/ORNLDAAC/2246
Hulley, G.C., R.J. Freepartner, and S. J. Hook. 2023. SHIFT: HyTES L3 Geolocated Multispecies Gas Products, March 23 2022. ORNL DAAC, Oak Ridge, Tennessee, USA. https://doi.org/10.3334/ORNLDAAC/2247
Johnson, W.R., S. J. Hook, P. Mouroulis, D.W. Wilson, S.D. Gunapala, v. Realmuto, A. Lamborn, C. Paine, J.M. Mumolo, and B.T. Eng. 2011. HyTES: Thermal imaging spectrometer development. IEEE Explore: Conferences, 2011 Aerospace Conference, Big Sky, MT, USA. https://doi.org/10.1109/AERO.2011.5747394
Stavros, E.N., J. Chrone, K. Cawse-Nicholson, A. Freeman, N. F. Glenn, L. Guild, R. Kokaly, C. Lee, J. Luvall, R. Pavlick, B. Poulter, S.S. Uz, S. Serbin, D.R. Thompson, P.A. Townsend, K. Turpie, K. Yuen, K. Thome, W. Wang, S.-K. Zareh, J. Nastal, D. Bearden, C.E. Miller, and D. Schimel. 2023. Designing an observing system to study the Surface Biology and Geology (SBG) of the Earth in the 2020s. Journal of Geophysical Research: Biogeosciences 128:e2021JG006471. https://doi.org/10.1029/2021JG006471