Documentation Revision Date: 2024-05-13
Dataset Version: 1
Summary
This archive currently includes data from February to May 2022. Additional AVIRIS-NG L1A data from the SHIFT campaign will be added as they become available.
This dataset holds a total of 1,598 files. There are 799 files in ENVI binary format. Each binary file is accompanied by a header file in text format.
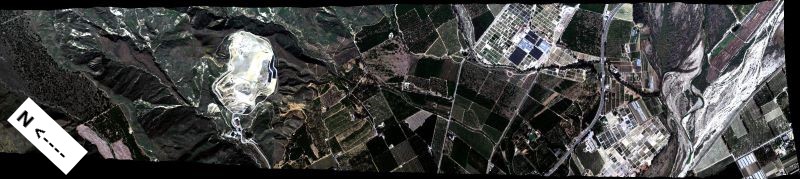
Figure 1. Portion of quicklook image for AVIRIS-NG flight ang20220228t214527 over Ventura County north of Santa Clara River west of Filmore, California on 28 February 28 2022. Approximately 34.403 latitude, -118.990 longitude. Source: ang20220228t214527_geo.jpeg
Citation
Brodrick, P.G., R. Pavlick, M. Bernas, J.W. Chapman, R. Eckert, M. Helmlinger, M. Hess-Flores, L.M. Rios, F.D. Schneider, M.M. Smyth, M. Eastwood, R.O. Green, D.R. Thompson, K.D. Chadwick, and D.S. Schimel. 2023. SHIFT: AVIRIS-NG L1A Unrectified Radiance. ORNL DAAC, Oak Ridge, Tennessee, USA. https://doi.org/10.3334/ORNLDAAC/2184
Table of Contents
- Dataset Overview
- Data Characteristics
- Application and Derivation
- Quality Assessment
- Data Acquisition, Materials, and Methods
- Data Access
- References
- Dataset Revisions
Dataset Overview
This dataset contains Level 1A (L1A) unrectified surface radiance image files as well as files of observational geometry and illumination parameters and supporting sensor band information from NASA's Airborne Visible / Infrared Imaging Spectrometer-Next Generation (AVIRIS-NG) instrument. This imagery was collected as part of the Surface Biology and Geology High-Frequency Time Series (SHIFT) campaign. The SHIFT campaign leveraged NASA's AVIRIS-NG facility instrument to collect VSWIR data at approximately a weekly cadence across a broad study area, enabling traceability analyses related to the science value of VSWIR revisits. This campaign will generate precise, high-frequency data on plant communities collected over nearly 1,656 square kilometers across Santa Barbara County, California, US, and nearby coastal Pacific waters. AVIRIS-NG is a pushbroom spectral mapping system with high signal-to-noise ratio (SNR), designed and toleranced for high performance spectroscopy. AVIRIS-NG measures reflected radiance at 5-nm intervals in the Visible to Shortwave Infrared (VSWIR) spectral range from 380-2510 nm. The AVIRIS-NG sensor has a 1 milliradian instantaneous field of view, providing altitude dependent ground sampling distances from 20 m to sub-meter range. In this dataset, for each flight line, four file types are included: unrectified measured surface radiance image (rdn) files, geometric lookup table (glt), gridded files of input geometry (igm), and parameters relating to the geometry of observation and illumination rendered using the geometric lookup table (obs). The AVIRIS-NG L1B data are provided in ENVI binary format, which includes a flat binary file (bin) accompanied by a header (hdr) file holding metadata in text format.
Project: Surface Biology and Geology High-Frequency Time Series (SHIFT)
The Surface Biology and Geology (SBG) High Frequency Time Series (SHIFT) was an airborne and field campaign during February to May, 2022, with a follow up activity for one week in September, in support of NASA's SBG mission. Its study area included a 640-square-mile (1,656-square-kilometer) area in Santa Barbara County and the coastal Pacific waters. The primary goal of the SHIFT campaign was to collect a repeated dense time series of airborne Visible to ShortWave Infrared (VSWIR) airborne imaging spectroscopy data with coincident field measurements in both inland terrestrial and coastal aquatic areas, supported in part by a broad team of research collaborators at academic institutions. The SHIFT campaign leveraged NASA's Airborne Visible-Infrared Imaging Spectrometer-Next Generation (AVIRIS-NG) facility instrument to collect approximately weekly VSWIR imagery across the study area. The SHIFT campaign 1) enables the NASA SBG team to conduct traceability analyses related to the science value of VSWIR revisit without relying on multispectral proxies, 2) enables testing algorithms for consistent performance over seasonal time scales and end-to-end workflows including community distribution, and 3) provides early adoption test cases to SHIFT application users and incubate relationships with basic and applied science partners at the University of California Santa Barbara Sedgwick Reserve and The Nature Conservancy's Jack and Laura Dangermond Preserve.
Related Datasets
Bohn, N., P.G. Brodrick, D.R. Thompson, R. Eckert, and P. Lovegreen. 2023. SHIFT: AVIRIS-NG Derived Gridded Mosaicked Canopy Water Content, California, 2022. ORNL DAAC, Oak Ridge, Tennessee, USA. https://doi.org/10.3334/ORNLDAAC/2242
Brodrick, P., R. Pavlick, M. Bernas, J.W. Chapman, R. Eckert, M. Helmlinger, M. Hess-Flores, L.M. Rios, F.D. Schneider, M.M. Smyth, M. Eastwood, R.O. Green, D.R. Thompson, K.D. Chadwick, and D.S. Schimel. 2023. SHIFT: AVIRIS-NG L2A Unrectified Reflectance. ORNL DAAC, Oak Ridge, Tennessee, USA. https://doi.org/10.3334/ORNLDAAC/2183
Green, R.O., P.G. Brodrick, J.W. Chapman, M. Eastwood, S. Geier, M. Helmlinger, S.R. Lundeen, W. Olson-Duvall, R. Pavlick, L.M. Rios, D.R. Thompson, and A.K. Thorpe. 2023. AVIRIS-NG L1B Calibrated Radiance, Facility Instrument Collection, V1. ORNL DAAC, Oak Ridge, Tennessee, USA. https://doi.org/10.3334/ORNLDAAC/2095
Acknowledgement
SHIFT is jointly led by NASA’s Jet Propulsion Laboratory, The Nature Conservancy, and the University of California, Santa Barbara (UCSB).
Data Characteristics
Spatial Coverage: Santa Barbara County, California and nearby Pacific Ocean
Spatial Resolution: 4.8 m
Temporal Coverage: 2022-02-24 to 2022-05-29
Temporal Resolution: Approximately weekly flights over study area
Study Area: (All latitudes and longitudes given in decimal degrees)
| Study Area | Westernmost Longitude | Easternmost Longitude | Northernmost Latitude | Southernmost Latitude |
|---|---|---|---|---|
| Santa Barbara County, California and nearby Pacific Ocean | -120.644 | -117.847 | 34.899 | 33.856 |
Data File Information
This dataset includes multiband ENVI binary files (.bin) with associated header (.hdr) files. The ENVI header files hold metadata in text format. There are four ENVI files per flight scene; see Table 1 for description of file types.
TThis dataset holds a total of 1,598 files. There are 799 files in ENVI binary format and 799 header files.
The naming convention for the ENVI files is <flight prefix>_<product>_<ver>.<ext>, where
- <flight prefix> = flight line identifier, angYYYMMDDthhmmss, encoding the date and time by year (YYYY), month (MM), day (DD), hour (hh), minute (mm), and second (ss) of the flight (e.g., ang20220529t222033).
- <product> = Level 1A data product as described in Table 1.
- <ver> = product versioning marker, e.g., “v2aa1_clip”.
- <ext> = file extension of "bin" denotes ENVI binary data files, while “hdr” denotes the ENVI header files.
The header (.hdr) for each ENVI holds metadata for the binary data file, including:
- number of samples (columns), lines (rows), and bands
- band names
- data type (4 = Float32, 5=Float64), interleave type, and byte order
- See https://www.nv5geospatialsoftware.com/docs/ENVIHeaderFiles.html for the header format.
The ENVI files are in unprojected instrument coordinates (samples and lines) that follow the trajectory of the respective flight path. Georeferencing is available via the input geometry product (igm) that provides UTM coordinates for each pixel. The UTM zone and datum are listed in the header file for this product, which includes zone 10N (EPSG: 32610) and zone 11N (EPSG: 32611) for this dataset.
Table 1. Level 1A data products.
| Product abbreviation | Description | Bands | Format |
|---|---|---|---|
| glt | Geometric look-up table. Product that contains the information about which original pixel occupies which output pixel in the final product. Each pixel is sign-coded to indicate if it is real (indicated by a positive value) or a nearest-neighbor infill (indicated by negative values). | 2 bands: sample number, original line number | 32 bit floating point, band squential format |
| igm | Input geometry file. Pixel location data for each radiance image cube. No map correction or resampling is applied; the IGM file reports the surface location of the unadjusted pixel centers in (a) geographic coordinates as decimal degrees or (b) projected UTM coordinates; both use WGS-84 datum. Data includes the estimated ground elevation at pixel center in m. |
3 bands: |
64-bit double precision, band interleaved by pixel |
| rdn | Unrectified measured surface radiances. The header records the spectral calibration (wavelength and full-width at half-maximum value) and smoothing factors for every channel in the radiance data. | 425 bands: radiance (uW nm-1 cm-2 sr-1) at wavelengths of 380 nm to 2510 nm in 5-nm intervals | 32-bit floating point, band interleaved by line |
| obs | Observation parameter file for unorthocorrected radiance image. Parameters relate the geometry of observation and illumination for each pixel rendered using the *_glt lookup table. | 11 bands: Path length (m), To-sensor azimuth (0 to 360 degrees clockwise from N), To-sensor zenith (0 to 90 degrees from zenith) , To-sun azimuth (0 to 360 degrees clockwise from N), To-sun zenith (0 to 90 degrees from zenith) , Solar phase, Slope, Aspect, Cosine(i), UTC Time, Earth-sun distance (AU) | 64-bit double precision, band interleaved by line |
User Note: There is no glt product for flight line ang20220308t195648.
Application and Derivation
A primary goal of the SHIFT campaign was to collect a repeated dense time series of airborne Visible to ShortWave Infrared (VSWIR) airborne imaging spectroscopy data with coincident field measurements in both inland terrestrial and coastal aquatic areas. The AVIRIS NG instrument collects VSWIR data that will be combined with in-situ measurements of plant diversity and ecophysiology to produce weekly estimates of ecosystem function over the 1,656-km2 study area.
These data document seasonal progressions in these ecosystems. Sampling intervals must be short enough to capture subseasonal changes in phenology with associated changes in ecosystem states and functions. Moreover, the changes occur on varying schedules in terrestrial versus aquatic systems and are influenced by spatial heterogeneity in geology, topography, and ocean currents.
Hyperspectral AVIRIS-NG data provide information on ecosystem functions such as water use. For example, to estimate canopy water content, in-situ measurements of plant water status and leaf spectra were taken >100 native oak (Quercus spp.) trees concurrent with AVIRIS-NG flights. These field data were used to calibrate the relationship between field conditions and hyperspectral imagery. Once known, these models can be applied across the landscape on a given date.
Obtaining global VSWIR observations on a 16-day return interval is one of the technological design challenges of the SBG mission. The high time frequency VSWIR data collected by SHIFT provides the opportunity to evaluate the information gained by high revisit rates and check the stability of analytical algorithms over the seasonal time series.
Quality Assessment
The AVIRIS-NG calibration procedure addresses electronic effects involving radiometric responses of each detector, optical effects involving the spatial and spectral view of each detector, and radiometric calibration. Detector responsiveness is measured at the beginning of each deployment and mid-flight for particularly long deployments. Instrument artifacts in the spectrometer data, such as striping, are removed statistically by minimizing a Markov Random Field model. Likewise, bad pixels are identified and corrected using statistical methods followed by laboratory and field protocols to evaluate effectiveness. Details of calibration methods are available in Chapman et al. (2019).
Data Acquisition, Materials, and Methods
As a key component of the SBG High Frequency Time Series (SHIFT) campaign, VSWIR data was collected by the Airborne Visible InfraRed Imaging Spectrometer - Next Generation (AVIRIS-NG) weekly across the Mediterranean terrestrial and aquatic environments in Santa Barbara County, California. The study area for the SHIFT campaign covers 1,656 km2 in the vicinity of Santa Barbara, California, US. It stretches from Los Padres National Forest in the east, westward to the Central California coast, and into the coastal ocean (Figure 2).
The Airborne Visible-Infrared Imaging Spectrometer (AVIRIS-NG) was developed to provide continued access to high signal-to-noise ratio imaging spectroscopy measurements in the solar reflected spectral range (Green et al., 1998). AVIRIS-NG data were calibrated from raw digital numbers to at-sensor radiance following methods of Chapman et al. (2019). The process addresses both electronic and optical effects, and calibrates the data to units of μW nm-1 cm-2 sr-1 .
Pixels were georeferenced using methods developed for the Earth Surface Mineral Dust Source Investigation (EMIT; EMIT L1B ATBD; Thompson et al., 2020). The process used the automated generation of ground control points (GCPs) referenced to a Landsat 8 basemap (https://github.com/emit-sds/emit-sds-l1b-geo). These GCPs were then used to estimate the VSWIR geometric camera model, along with the attitude and ephemeris of the aircraft. This georeferencing method identified the location of each pixel and generated observation view angles, which were used in the surface and atmospheric modeling. The mean georeferencing error was about half a pixel. Some deviations through time were still observable, which were most likely due to digital surface model inaccuracies.
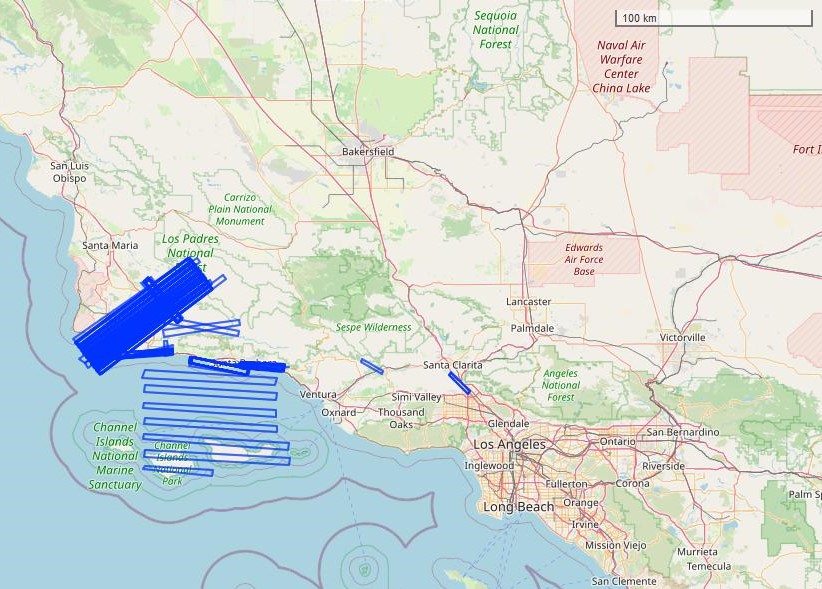
Figure 2. Location of AVIRIS-NG flightlines for SHIFT project in February to May, 2022. Map shows a portion of southern California, US. Footprints of imagery data are shown as blue rectangles. Basemap: © OpenStreetMap contributors.
Data Access
These data are available through the Oak Ridge National Laboratory (ORNL) Distributed Active Archive Center (DAAC).
SHIFT: AVIRIS-NG L1A Unrectified Radiance
Contact for Data Center Access Information:
- E-mail: uso@daac.ornl.gov
- Telephone: +1 (865) 241-3952
References
Bohn, N., P.G. Brodrick, D.R. Thompson, R. Eckert, and P. Lovegreen. 2023. SHIFT: AVIRIS-NG Derived Gridded Mosaicked Canopy Water Content, California, 2022. ORNL DAAC, Oak Ridge, Tennessee, USA. https://doi.org/10.3334/ORNLDAAC/2242
Brodrick, P., R. Pavlick, M. Bernas, J.W. Chapman, R. Eckert, M. Helmlinger, M. Hess-Flores, L.M. Rios, F.D. Schneider, M.M. Smyth, M. Eastwood, R.O. Green, D.R. Thompson, K.D. Chadwick, and D.S. Schimel. 2023. SHIFT: AVIRIS-NG L2A Unrectified Reflectance. ORNL DAAC, Oak Ridge, Tennessee, USA. https://doi.org/10.3334/ORNLDAAC/2183
Chapman, J.W., D.R. Thompson, M.C. Helmlinger, B.D. Bue, R.O. Green, M.L. Eastwood, S. Geier, W. Olson-Duvall, and S.R. Lundeen. 2019. Spectral and radiometric calibration of the Next Generation Airborne Visible Infrared Spectrometer (AVIRIS-NG). Remote Sensing 11:2129. https://doi.org/10.3390/rs11182129
Green, R.O., P.G. Brodrick, J.W. Chapman, M. Eastwood, S. Geier, M. Helmlinger, S.R. Lundeen, W. Olson-Duvall, R. Pavlick, L.M. Rios, D.R. Thompson, and A.K. Thorpe. 2023. AVIRIS-NG L1B Calibrated Radiance, Facility Instrument Collection, V1. ORNL DAAC, Oak Ridge, Tennessee, USA. https://doi.org/10.3334/ORNLDAAC/2095
Green, R.O., M.L. Eastwood, C.M. Sarture, T. G. Chrien, M. Aronsson, B.J. Chippendale, J.A. Faust, B.E. Pavri, C. J. Chovit, M. Solis, M.R. Olah, and O. Williams. 1998. Imaging Spectroscopy and the Airborne Visible/Infrared Imaging Spectrometer (AVIRIS). Remote Sensing of Environment 65:227-248. https://doi.org/10.1016/S0034-4257(98)00064-9
Thompson, D.R., P.G. Brodrick, R.O. Green, O. Kalashnikova, S. Lundeen, G. Okin, W. Olson-Duvall, and T. Painter. 2020. EMIT L2A Algorithm: Surface Reflectance and Scene Content Masks: Theoretical Basis. Version 1.0. NASA Jet Propulsion Laboratory
California Institute of Technology; Pasadena, California. https://earth.jpl.nasa.gov/emit/internal_resources/281
Dataset Revisions
| Version | Release Date | Revision Notes |
|---|---|---|
| 2024-05-12 |
The following 46 ENVI header files were revised to correct the UTM zone denoted in the "map info" and "coordinate system" strings. The UTM zone was changed from 10N to 11N. ang20220224t195402_glt.hdr ang20220420t182836_glt.hdr ang20220512t180531_glt.hdr |
|
| 2024-01-22 | Files associated with three flight lines not associated with the SHIFT project were deleted from this collection: "ang20220228t214527","ang20220228t215349",and "ang20220308t221613". AVIRIS-NG data from those flight lines are available in the AVIRIS Facility Instrument collection. |
|
| 1.0 | 2023-09-14 |