Documentation Revision Date: 2020-12-28
Dataset Version: 2
Summary
This tool is available for the three NASA airborne missions at the following links:
- The Atmospheric Carbon and Transport - America (ACT-America): https://actamerica.ornl.gov/visualize/
- The Atmospheric Tomography Mission (ATom): https://daac.ornl.gov/ATOM/campaign/visualize/
- The Carbon in Arctic Reservoirs Vulnerability Experiment (CARVE): https://carve.ornl.gov/visualize/
Flight path data are available for each flight, and a combination of atmospheric gas concentrations (e.g., CO2, CO, CH4, and ozone) and other chemical and physical measurements are available for each mission. The data were collected with instrumentation such as infrared cavity ring-down spectrometer systems, a dual beam differential UV absorption ozone monitors, and Programmable Flask Packages (PFP) onboard several aircraft including the NASA DC-8, C-130, B-200, and C-23 Sherpa aircraft.
Data can be explored via an interactive map and a time-series plot. Additional information on the data products and data acquisition for each mission are also available at the above links.
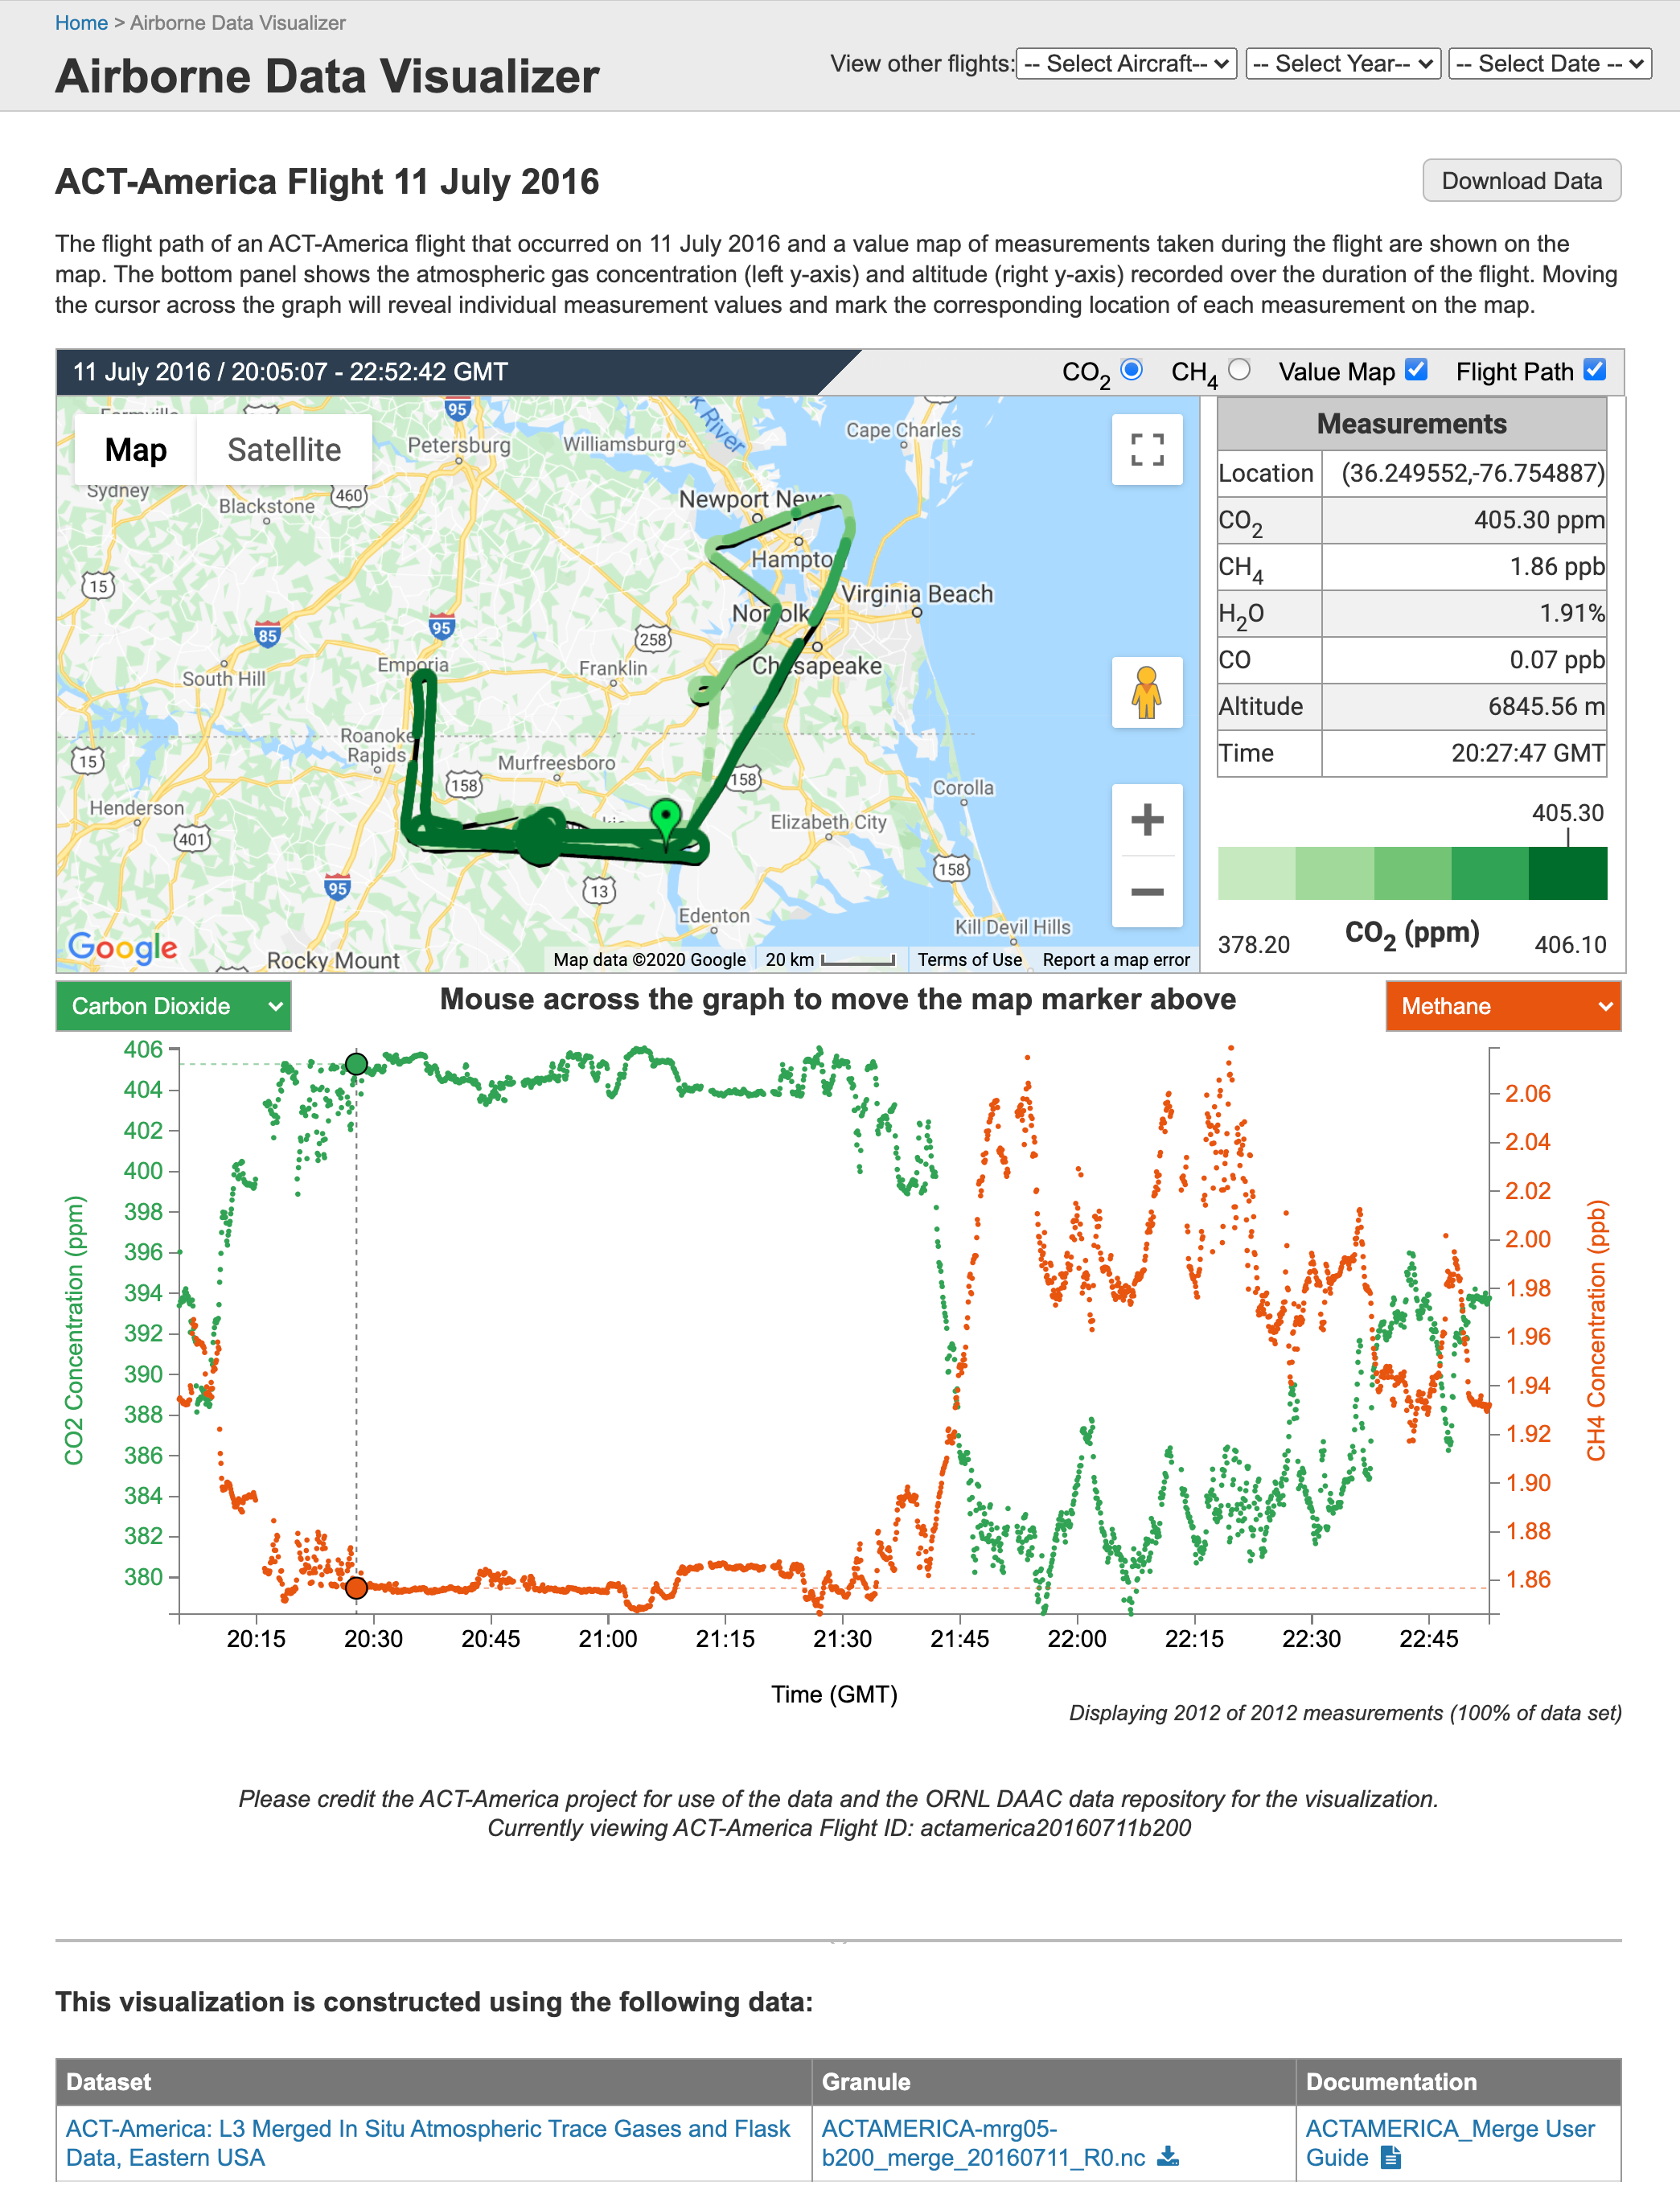
Figure 1. Screenshot of the Airborne Data Visualizer showing CO2 and CH4 concentrations from a flight of the B-200 aircraft on July 11 2016 as part of the ACT-America mission.
Citation
ORNL DAAC. 2020. ORNL DAAC Airborne Data Visualizer. ORNL DAAC, Oak Ridge, Tennessee, USA. https://doi.org/10.3334/ORNLDAAC/1860
Table of Contents
- Dataset Overview
- Data Characteristics
- Application and Derivation
- Quality Assessment
- Data Acquisition, Materials, and Methods
- Data Access
- References
- Dataset Revisions
Dataset Overview
The Airborne Data Visualizer (ADV) is a tool for the exploration of in-situ measurements from multiple airborne missions. The ADV is a Python-based web application with menus for selecting individual flights and variables to view interactively on a map or on a series of plots within a web browser. Users can compare the geographic scope of measurements from multiple missions, explore the spatial and temporal variation of measurements, determine which data meet their needs, follow the links on the page to download individual data files, or view the dataset landing page to download larger amounts of data. The ADV tool is currently available for three NASA airborne missions: the Atmospheric Carbon and Transport - America (ACT-America), the Atmospheric Tomography Mission (ATom), and the Carbon in Arctic Reservoirs Vulnerability Experiment (CARVE).
Flight path data are available for each flight, and a combination of atmospheric gas concentrations (e.g., CO2, CO, CH4, and ozone) and other chemical and physical measurements are available for each mission. The data were collected with instrumentation such as infrared cavity ring-down spectrometer systems, a dual beam differential UV absorption ozone monitors, and Programmable Flask Packages (PFP) onboard several aircraft including the NASA DC-8, C-130, B-200, and C-23 Sherpa aircraft.
Acknowledgements:
Initial development of this tool was completed by Zoey Werbin during her internship with the Earth Venture Suborbital-2 funded ACT-America project at ORNL DAAC.
Data Characteristics
Spatial Coverage: Global. Each mission has a specific spatial coverage.
Temporal Coverage: 2012-05-23 to 2019-07-27. Each mission has different temporal coverage within this overall time period.
- ACT-America: Periodic flights took place during five intensive campaigns from July 2016 through July 2019.
- ATom: Four campaigns from July 2016 through May 2018.
- CARVE: Periodic flights occurred during the growing season of 2012 through 2015.
Temporal Resolution:
Merged data for each flight were used for the Visualizer to allow variables to be compared despite differences in temporal resolution (ex., the Picarro instrument measures gas variables sequentially rather than simultaneously, so merged data are necessary to allow for the comparison of CO2 and CH4). Note that measurements may be resampled at a coarser temporal resolution prior to being displayed in the visualizer to improve loading time. Users can download full-resolution data from the data pool links.
Spatial Resolution:
Latitude/longitude coordinates are available from temporally merged files for each mission. Specifically, the spatial resolution of each flight differs based on aircraft speed.
Application and Derivation
These airborne in-situ data can be used to calibrate and validate other atmospheric measurements and to better understand carbon fluxes, air quality, and their associated uncertainties on a continental and global scale. The Airborne Data Visualizer can help users discern which of the ORNL DAAC's airborne data are most appropriate for their needs, and it can help users discover data from similar missions.
Quality Assessment
Refer to the documentation for each individual data product for quality assessment information.
Data Acquisition, Materials, and Methods
The Airborne Data Visualizer (ADV) is a Python-based web application with menus for selecting individual flight dates and variables to view on a map or on a series of plots. The tool is available for three NASA airborne missions at the following links:
- The Atmospheric Carbon and Transport - America (ACT-America): https://actamerica.ornl.gov/visualize/
- The Atmospheric Tomography Mission (ATom): https://daac.ornl.gov/ATOM/campaign/visualize/
- The Carbon in Arctic Reservoirs Vulnerability Experiment (CARVE): https://carve.ornl.gov/visualize/
Flight path data are available for each flight, and a combination of CO2, CO, CH4, ozone, other trace gas measurements are available for each mission. The data were collected with instrumentation such as infrared cavity ring-down spectrometer systems, a dual beam differential UV absorption ozone monitors, and Programmable Flask Packages (PFP) onboard several aircraft including the NASA DC-8, C-130, B200, and C-23 Sherpa aircraft.
Merged data for each flight were used for the Visualizer to allow variables to be compared despite differences in temporal resolution (ex. the Picarro instrument measures gas variables sequentially rather than simultaneously, so merged data are necessary to allow for the comparison of CO2 and CH4). The lowest-resolution merge was selected whenever sufficient for visualizing data to improve loading times. Users can download higher-resolution data from the data pool links.
Data can be explored via an interactive map, a time-series plot, and a scatterplot. Additional information on the data products and data acquisition for each mission are also available at the above links.
Data Access
These data are available through the Oak Ridge National Laboratory (ORNL) Distributed Active Archive Center (DAAC).
ORNL DAAC Airborne Data Visualizer
Contact for Data Center Access Information:
- E-mail: uso@daac.ornl.gov
- Telephone: +1 (865) 241-3952
References
Dataset Revisions
Version 2: Current version. For Version 2, the ADV web application was re-coded in Python. Major functionalities remain the same and as in Version 1, there are three different implementations -- one each for CARVE, ACT-America, and ATom missions. Version 2 replaces V1.
Version 1: ORNL DAAC. 2018. Airborne Data Visualizer. ORNL DAAC, Oak Ridge, Tennessee, USA. https://doi.org/10.3334/ORNLDAAC/1585
In Version 1, the ADV web application was coded in R Shiny. Now superseded by Version 2.