Get Data
Summary:
This data set consists of 15-km-resolution land cover data for the land area of the Former Soviet Union (FSU). There are sixty land cover classes distinguished in this data set, thirty-eight of which are forest cover classes. The data set is useful for stratification of the FSU into general sub-regions of land cover for subsequent study using higher resolution satellite data.
The data are provided in several different file formats, including binary raster data in Idrisi format, ASCIIGRID raster data in ASCII format (easily imported into ArcInfo), and a graphic map in JPEG format (see Figure 1). Please read all documentation before using these files.
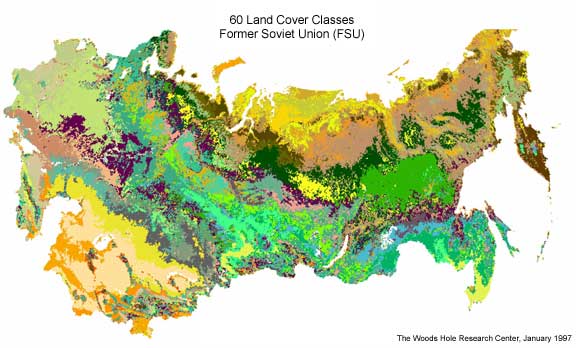
Figure 1. Land cover map, 15-km-resolution, for the land area of the FSU
Data Citation:
Cite this data set as follows:
Stone, T. A., and P. Schlesinger. 2003. RLC AVHRR-Derived Land Cover, Former Soviet Union, 15-km, 1984-1993. Data set. Available on-line [http://www.daac.ornl.gov] from Oak Ridge National Laboratory Distributed Active Archive Center, Oak Ridge, Tennessee, U.S.A. doi:10.3334/ORNLDAAC/689.
Table of Contents:
- 1 Data Set Overview
- 2 Data Characteristics
- 3 Applications and Derivation
- 4 Quality Assessment
- 5 Acquisition Materials and Methods
- 6 Data Description and Access
- 7 References
- 8 Glossary and Acronyms
- 9 Document Information
1. Data Set Overview:
Data Set Contents:
This data set consists of 15-km-resolution land cover data for the land area of the FSU. Sixty land cover classes are distinguished.
Related Data Sets:
See other Russian Land Cover data sets.
Title of Investigation:
Measuring Changes to Russian Forest Over the Last 25 Years
Investigator(s) Name and E-mail:
| Name | |
|---|---|
| Stone, T.A. | tstone@whrc.org |
| Schlesinger, P. | pschles@whrc.org |
Technical Contact(s) Name, Telephone, and E-mail:
| Name | Phone | |
|---|---|---|
| Schlesinger, P. | pschles@whrc.org | (508)540-9900 |
Future Modifications and Plans:
Not available.
2. Data Characteristics:
Study Area:
Spatial Coverage:
Min. X: 19.816
Max. X: 190.096
Min. Y: 35.2389
Max. Y: 75.0
In degrees west longitude and north latitude
Spatial Resolution:
1000 meters
Projection:
Lambert Azimuthal Equal Area
Grid Description:
Cols: 626
Rows: 1637
Resolution: 1000 meters
Temporal Coverage:
Not applicable
Parameter or Variable:
Table for: dlcmap.img
Variable Description Units Instrument Range LAND COVER land cover classes Unitless AVHRR Not applicable
LAND COVER footnote: See companion file [ http://daac.ornl.gov/daacdata/russian_land_cover/land_cover/comp/dlcmap_legend.txt ] for text file of table contents.
Table for: dlcmap.dat
Variable Description Units Instrument Range LAND COVER land cover classes Unitless AVHRR Not applicable
LAND COVER footnote: The sixty land cover classes distinguished in this data set are listed above. See companion file [http://daac.ornl.gov/daacdata/russian_land_cover/land_cover/comp/dlcmap_legend.txt] for text file of table contents.
Data Organization
Please read all documentation before using these files: http://daac.ornl.gov/daacdata/russian_land_cover/land_cover/comp/dlcmap_readme.txt
Granule Name or Description:
dlcmap.img
Data Format:
A binary raster image depicting land cover in Idrisi format. Note: must be converted to an *rst file when using version 3.2 of Idrisi. Use the Idrisi File Conversion (16/32) utility available in the file pulldown menu to convert to the new format. Also note that the Idrisi v. 2 image documentation file, dlcmap.doc, MUST be present for the binary data to be read by Idrisi.
Sample Data Record:
Not applicable.
Granule Name or Description:
dlcmap.dat
Data Format:
ASCIIGRID version of the binary raster data (dlcmap.img). This data file was created by converting the Idrisi binary file (dlcmap.img) using Idrisi export utilities. Note: it was necessary to first convert the *.img file to a *rst file and the *doc file to a *rdc file to match the new file format and naming convention of raster data supported by Idrisi 3.2.
Sample Data Record:
Not applicable.
3. Application and Derivation:
Typical Application of Data
Regional-, national-, and sub-national-level forest and land use change assessments. Stratification of the FSU into general sub-regions of land cover for subsequent study using higher resolution satellite data.
Theory of Measurements
Not available
Derivation Techniques and Algorithms
Formulae:
Not available
Processing Steps:
We assembled a ten-year Global Vegetation Index (GVI) time series data set covering 1984 to 1993 for the region of the FSU. Data from the NOAA First Generation Weekly Composite products were re-mapped from a Polar Stereographic to a Platte Carree map projection. These data, with data from the NOAA second-generation weekly composite product, were read into both Idrisi and ERDAS software formats.
The inverse of the standard GVI equation (Kidwell 1990) was used to convert the scaled Normalized Difference Vegetation Index (NDVI) data values to the bright-land byte range. For instance, the transformation converted an NDVI value of 0.0 to a new value of 100, creating a minimum and maximum range from 90 to 163. Thus, a pixel with a value of 163 is equivalent to an NDVI of 0.63.
We then created a matrix with a common Platte Carree map projection and resolution (2,500 x 904 cells or pixels). Data from spring 1984 through the first week of April 1985 were re-projected using the algorithms in Kidwell (1990). The resulting data set had 48 to 53 weeks for each of the 10 years from 1984 to 1993. The data in these 510 weeks were then averaged into 120 months (12 months/yr for 10 years). The 120 monthly data were used to create a continuous FSU land surface, which crossed the international dateline (E. and W. longitude 180o) and had a size of 1183 columns by 277 rows.
A 12-month data set was created from the 10-year, 120-month data set by averaging together, for example, all of the January data to create a 10-year January average. Then, all of the February data and data for the following months were averaged to create an image with 12 bands. Averaging with maximum monthly GVI values reduces the effects of inter-satellite mis-calibration, sensor drift, orbital slippage, and noise in the data. These degrading effects upon AVHRR data have been thoroughly documented and are well known (Goward et al. 1991, 1993, Tateishi and Kajiwara 1991, Eastman and Fulk 1993). In general, using a long time series and a long averaging period reduces the amount of noise in the data.
Water pixels were deleted with a mask created from a re-projected hydrographic data set digitized from a 1:8,000,000 scale Russian base map (Main Geodesy and Cartography Organization for Ministries of the USSR 1990). This hydrographic data set, containing coastlines, islands, and major inland water bodies, was selected because of its size and ease of use. A comparison of coastlines between the Digital Chart of the World (DCW) by Environmental Systems Research Institute (ESRI) (1993) and the 1:8,000,000 scale map yielded an areal difference of less than 0.1 (10%) of a GVI pixel.
Because most of the degrading effects in the data were related to low winter sun angles for this boreal region, we chose to eliminate from the analysis December, January, and February. These months are the times of extreme cold for the vast majority of the region of the FSU, during which vegetation is inactive.
Processing Changes:
Not available
Special corrections/Adjustments:
Not available
Calculated Variables:
Not available
Graphs and Plots Used in Analysis:
Not available
4. Quality Assessment:
Data Usage Guidance:
Errors and Limitations:
Error Sources:
Not available
Limitations of the Data:
Not available
Known Problems with the Data:
Not available
Quality Assessment Activities:
Not available
Other Relevant Information about the Study:
Not available
5. Acquisition Materials and Methods:
Source or Platform Collection Environment:
NOAA satellites carrying AVHRR sensor
Source or Platform Program Management:
Not available
Source or Platform Mission Objectives:
Coverage Information:
Not available
Attitude Characteristics:
Not available
Data Collection System:
Not available
Communication Links:
Not available
List of Sensors or Instruments:
AVHRR
Ground Segment Information:
Data Acquisition and Processing:
Not available
Latitude Crossing Times:
Not available
Sensor or Instrument Descriptions
Key Variables:
Not available
Principles of Operation:
Not available
Sensor or Instrument Measurement Geometry:
Not available
Manufacturer of Sensor or Instrument:
Not available
Calibration:
Specifications:
Not applicable
Tolerance:
Not applicable
Frequency of Calibration:
Not applicable
Other Calibration Information:
Not applicable
Data Acquisition Methods:
The source satellite imagery data were acquired from the USGS/EROS Data Center, Sioux Falls, South Dakota, U.S.A. A USSR forest map was used to aid in classification of these data (Garsia 1990) (See section REFERENCES).
Observations
Data Notes:
Not available
6. Data Description and Access:
Data Access:
This data set is available from the Oak Ridge National Laboratory (ORNL) Distributed Active Archive Center (DAAC).
Data Archive Center:
Contact for Data Center Access Information:
E-mail: uso@daac.ornl.gov
Telephone: +1 (865) 241-3952
FAX: +1 (865) 574-4665
Product Availability:
Data can be accessed electronically on the ORNL DAAC's anonymous HTTP site or from the DAAC's search and order system. Data files are also available by request from uso@daac.ornl.gov.
Reading the Media:
Not available
Software and Analyses Tools:
Idrisi
7. References:
The published reference for the source data is as follows:
Stone, T. A., R. A. Houghton, and P. Schlesinger. 2000. Map of the Former Soviet Union Based Upon a Time Series of 15 km Resolution NOAA AVHRR Data. In Disturbance in Boreal Forest Ecosystems: Human Impacts and Natural Processes, USDA Gen. Tech Report NC-209. International Boreal Forest Research Association 1997, Duluth, Symposium Proceedings. pp. 67-80.
Other references used here includa the followinge:
Eastman, R. J., and M. Fulk. 1993. Long Sequence Time Series Evaluation using Standardized Principal Components. Photogr. Eng. and Remote Sensing 49(8):1307-1312.
ESRI. 1993. Digital Chart of the World for use with Arc Info Software. Redlands, California.
Garsia, M. G (ed.). 1990. "Forests of the USSR," Scale 1: 2,500,000, Forest Cartography Department of All-Union State Planning - Research Institute "Sojuzgiprolezhoz" GUGK: Moscow, USSR.
Goward, S. N., B. Markham, D. G. Dye, W. Dulaney, and J. Yang. 1991. Normalized Difference Vegetation Index Measurements from the Advanced Very High Resolution Radiometer, Remote Sens. of the Environ. 35:257-277.
Goward, S. N., D. G. Dye, S. Turner, and J. Yang. 1993. Objective assessment of the NOAA Global Vegetation Index Data Product. International Journal of Remote Sensing 14(18):3365-3394.
Kidwell, K.D. (ed.). 1990. Global Vegetation Index Users Guide. NOAA/NESDIS, Nat. Climatic Data Center, Washington, D.C.
Main Geodesy and Cartography Organization for Ministries of the USSR. 1990. Physical Geography of the Soviet Union. Map at 1:8,000,000 scale.
Tateishi, R. and K. Kajiwara. 1991. Landcover Monitoring in Asia by NOAA GVI Data. Geocarto Intl. 6(4):53-64.
8. Glossary and Acronyms:
Glossary:
Not applicable
Acronyms:
| Acronym | Definition |
| ASCII | American Standard Code for Information Interchange |
| AVHRR | Advanced Very High Resolution Radiometer |
| DCW | Digital Chart of the World |
| ESRI | Environmental Systems Research Institute |
| GVI | Global Vegetation Index |
| JPEG | Joint Photographic Experts Group |
| NDVI | Normalized Difference Vegetaion Index |
| NOAA | National Oceanic and Atmospheric Administration |
9. Document Information:
2003/11/26
Document Review Date:
2003/11/26
Document Curator:
webmaster@www.daac.ornl.gov