Get Data
Summary:
This data set contains three ASCII data files (.txt format), one for net primary production (NPP) component data and two for climate data. The NPP studies were conducted in a tropical montane forest in the Sierra de Merida at San Eusebio (8.62 N 71.35 W) in northwestern Venezuela. The forest is mostly primary in character, with some selective logging having taken place in the past. Biomass, litterfall, and nutrient content of above- and below-ground vegetation and soil were determined in 1973-1974.
Standing stocks of biomass and nutrients are reported as the mean of 13 plots with contrasting soil types, slope, and relief. Litterfall is reported as the mean determined for 3 of these plots, measured bi-weekly over the course of one year. Root turnover was estimated by correlation with leaf litter turnover (13%), and woody turnover was estimated by assuming the system to be in steady-state. A minimum estimate of total NPP (1,497 g/m2/year) may be obtained by summing total litterfall (697 g/m2/year), woody turnover (480 g/m2/year), and fine root turnover (320 g/m2/year). The forest contains high mineral stores, accumulated especially in the woody compartment. N and P values are very high in the soil compartment.
Long-term climate data are available for Merida (8.60 N 71.18 W), about 30 km southeast of the study site. Mean annual temperature is 18.9 C and mean annual precipitation is 1,752 mm, giving a humid/sub-humid climate. Short-term weather observation recorded at the study site are also provided in the data set.
Revision Notes:Only the documentation for this data set has been modified. The data files have been checked for accuracy and are identical to those originally published in 2001.
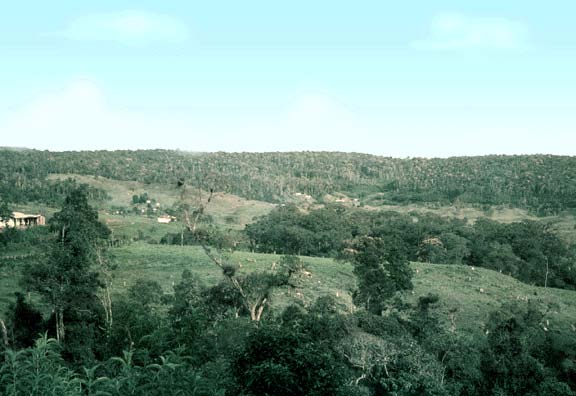
Figure 1. General overview of the San Eusebio tropical montane forest study area, Venezuela. (Photograph taken 1973-74 by Dr. H. W. Fassbender, Fachhochschule Hildesheim/Holzminden, Goettingen, Germany). (SES1-1.jpg)
Additional Documentation:
The Net Primary Productivity (NPP) data collection contains field measurements of biomass, estimated NPP, and climate data for terrestrial grassland, tropical forest, boreal forest, and tundra sites worldwide. Data were compiled from the published literature for intensively studied and well-documented individual field sites and from a number of previously compiled multi-site, multi-biome data sets of georeferenced NPP estimates. The principal compilation effort (Olson et al., 2001) was sponsored by the NASA Terrestrial Ecology Program. For more information, please visit the NPP web site at http://daac.ornl.gov/NPP/npp_home.html.
Data Citation:
Cite this data set as follows:
Grimm, U., and H.W. Fassbender. 2013. NPP Tropical Forest: San Eusebio, Venezuela, 1973-1974, R1. Data set. Available on-line [http://daac.ornl.gov] from Oak Ridge National Laboratory Distributed Active Archive Center, Oak Ridge, Tennessee, U.S.A.doi:10.3334/ORNLDAAC/480.
Grimm, U., and H.W. Fassbender. 1999. NPP Tropical Forest: San Eusebio, Venezuela, 1970-1971. Data set. Available on-line [http://daac.ornl.gov] from Oak Ridge National Laboratory Distributed Active Archive Center, Oak Ridge, Tennessee, U.S.A.
Table of Contents:
- 1 Data Set Overview
- 2 Data Description
- 3 Applications and Derivation
- 4 Quality Assessment
- 5 Acquisition Materials and Methods
- 6 Data Access
- 7 References
1. Data Set Overview:
Project: Net Primary Productivity (NPP)
Biomass, litterfall, and nutrient content of above- and below-ground vegetation and soil were determined in 1973-1974 for a tropical montane forest at San Eusebio, Venezuela, with the support of the German Research Society and the University of Los Andes, Venezuela. Some components of net primary productivity (NPP) were estimated.
The San Eusebio study site (8.62 N 71.35 W) is in the Sierra de Merida in northwestern Venezuela, about 30 km northwest of the city of Merida. The experimental site belongs to the Faculty of Forest Science at the University of Los Andes, Merida. The forest appeared to be mostly primary in character, with some selective logging having taken place in the past. The landscape is somewhat heterogeneous, so 13 sample plots (each 50 m x 50 m) were chosen to cover the full range of height and size of all species present. Trees <10 cm diameter were measured only within a circle of 15 m radius in the center of each plot, and the understory was measured within smaller quadrats (2 m x 2 m). Fine roots (< 5 mm) were determined inside these quadrats with the use of corers 20 cm in diameter. Coarse roots were determined by excavation for a total of 30 trees.
A minimum estimate of total net primary productivity (TNPP) is presented here as the sum of total litterfall + woody turnover (ANPP) and fine root turnover (BNPP) (Grimm and Fassbender (1981); Fassbender and Grimm (1981); Lamprecht (1977; Scurlock and Olson, 2003). ANPP, BNPP, and TNPP values for San Eusebio reported in Olson et al. (2012a, b) and Clark et al. (2001a, b) differ from the values presented herein due to different calculation methods (Table 1).
Table 1. ANPP, BNPP, and TNPP values reported by various published data sources
| File Name or Description | Data Source(s) | Sub-Site | ANPP | BNPP | TNPP |
|---|---|---|---|---|---|
| gC/m2/year | |||||
| ses_npp.txt | Grimm and Fassbender (1981); Fassbender and Grimm (1981); Lamprecht (1977)1
|
ses meanof3 (average of 3 sub-sites; see text for details)
|
589 | 160 | 749 |
NPP_Multibiome_EnvReview | Scurlock and Olson (2012) based on Grimm and Fassbender (1981); Fassbender and Grimm (1981); Lamprecht (1977) |
ses (average of 3 sub-sites) |
589 | 160 | 749 |
| GPPDI_ClassA_NPP_162_R2.csv | Olson et al. (2012a, b); Clark et al. (2001a)2Grimm and Fassbender (1981); Fassbender and Grimm (1981)
|
Class A 49 (MI 48) |
606 | 423 | 1,029
|
| EMDI_ClassA_NPP_81_R2.csv | Class A 49 |
606 | 423 | 1,029
|
|
| Table 1 in Clark et al. (2001a) | Clark et al. (2001a)2 based on Grimm and Fassbender (1981); Fassbender and Grimm (1981) |
San Eusebio(average of 3 sub-sites) |
610 | 120-730 (av 425) | 730-1,330 (av 1,030) |
| tropfornpp.csv | Clark et al. (2001b)3 based on Grimm and Fassbender (1981); Fassbender and Grimm (1981) |
Venezuela-San Eusebio |
464 | NA | NA |
Notes: NA = Not available. MI = Measurement ID number. The differences in NPP values reported in this table are mainly due to differences in calculation methods, as explained in these notes. Please consult original references for details. Revised data sets (R1, R2, etc) are accompanied by ORNL DAAC Data Set Change Information files. Please see the corresponding documentation for reasons why the data values were revised. 1For this table, NPP data from the original data source were converted from grams of dry weight per meter square per year to grams of carbon per meter square per year using a conversion factor of 0.5. The NPP estimates are based on field measurement of total litterfall accumulation, wood mortality, and root turnover. 2Clark et al. (2001a) used a different approach to calculate net primary production values. ANPP was calculated by summing reported above-ground biomass increment + reported fine litterfall + estimated losses to consumers + estimated VOC emissions. BNPP was calculated by summing 0.2 x estimated ANPP for a low BNPP estimate + 1.2 x estimated ANPP for a high BNPP estimate. TNPP was calculated as the range between the low and high values of ANPP + BNPP. Average BNPP and TNPP estimates were also calculated. See Clark et al. (2001a) for a discussion of calculation methods, including how unmeasured components of ANPP were estimated and the basis for setting bounds on BNPP. 3ANPP estimate is the sum of litterfall + branch fall + above-ground biomass increment.
2. Data Description:
Spatial Coverage
Site: San Eusebio, Venezuela
Site Boundaries: (All latitude and longitude given in decimal degrees)
| Site (Region) | Westernmost Longitude | Easternmost Longitude | Northernmost Latitude | Southernmost Latitude | Elevation (m) |
|---|---|---|---|---|---|
| San Eusebio, Venezuela | -71.35 | -71.35 | 8.62 | 8.62 | 2,000-2,500 |
Site Information
The study site is located in a humid tropical montane forest (modified Bailey ecosystem #M420). The stands of the forest reserve are considered primary. The landscape is quite heterogeneous. The major forest species include Podocarpus rospigliosii, P. oleifilius, Graffenrieda latifolia, Myrcia fallax, Eschweilera monosperma, and Beilschmiedia sulcata. Bamboo plants are found in areas with open canopies. There are a large number of epiphytes in the forest stands, especially bromeliads and orchids.
Climate data are available from weather stations in the primary forest and in a clearing at San Eusebio (elevation 2,300 m) as well as from nearby Merida (8.60 N 71.18 W elevation 1,479 m).
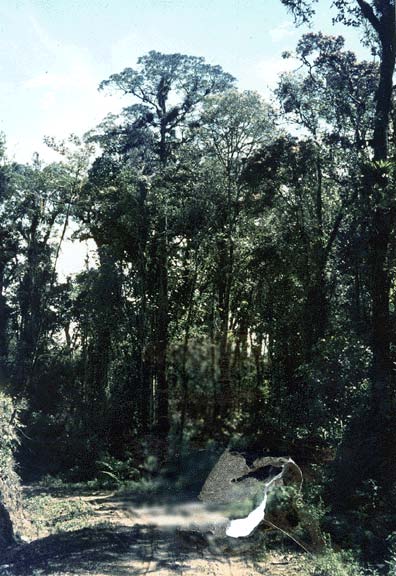
Figure 2. View near one of the research plots, San Eusebio tropical forest study site, Venezuela. (N.B. damage to photograph bottom center: taken 1973-74 by Dr. H. W. Fassbender, Fachhochschule Hildesheim/Holzminden, Goettingen, Germany). (SES3-1.jpg)
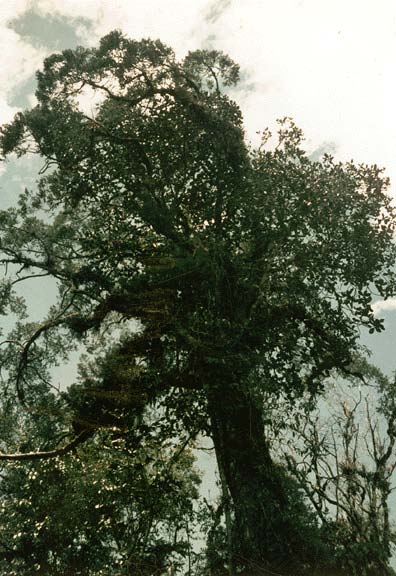
Figure 3. Crown of Podocarpus rospigliosi at the San Eusebio tropical forest study site, Venezuela. (Photograph taken 1973-74 by Dr. H. W. Fassbender, Fachhochschule Hildesheim/Holzminden, Goettingen, Germany). (SES4-1.jpg)
Spatial Resolution
The study plots were 50 x 50 m. Inventory subplots were 4 m2 in size, litter collectors were 1 m2, and decomposition frames were 40 x 40 cm.
Temporal Coverage
Biomass measurements were made in 1974. Litter was collected from December 1973 through November 1974. Decomposition was studied from December 1973 through January 1975 (data not included in this data set but reported in Fassbender and Grimm, 1981). Climate data are available from 1915/01/01 through 1996/12/31.
Temporal Resolution
Biomass measurements were made once. Litter was collected bi-weekly. Decomposition rates were calculated monthly. Biomass and NPP estimates are expressed as g/m2 and g/m2/year (dry matter weight), respectively.
Climate data are expressed as monthly and annual precipitation amounts (mm) and monthly and annual average temperature (C). Six and seven year mean precipitation records are reported. Monthly and annual mean precipitation are available from a weather station located at the San Eusebio study site. Monthly and annual mean maximum/minimum temperatures measured in the primary forest and in a clearing are also available. Monthly and annual climatic means are provided for the 1921-1996 period for precipitation and 1915-1993 for average temperature from the Merida weather station near San Eusebio.
Data File Information
Table 2. Data files in this data set archive
FILE NAME |
FILE SIZE |
TEMPORAL COVERAGE | FILE CONTENTS |
ses_npp.txt |
8.9 KB |
1973/12/01-1974/11/30 | Biomass, NPP, and nutrient data for tropical montane forest at San Eusebio, Venezuela |
ses1_cli.txt |
4 KB
|
Mean of 6 years (dates not specified) 1963/01/01-1964/12/31 | Mean precipitation data from weather station at San Eusebio, Venezuela |
| Mean of 7 years (1963-1964; 1970-1974) | |||
| 1973/11/01-1974/12/31 | Precipitation, and maximum/minimum temperature data for primary forest and nearby clearing at San Eusebio, Venezuela | ||
ses2_cli.txt |
19.4 KB
|
1921/01/01-1996/12/31 | Mean monthly and annual precipitation data from Merida weather station near San Eusebio, Venezuela. |
| 1915/01/01-1993/12/31 | Mean monthly and annual average temperature data from Merida weather station near San Eusebio, Venezuela. |
NPP Data. NPP estimates for the San Eusebio site are provided in one file (Table 2). The data set is an ASCII file (.txt format). The variable values are delimited by semi-colons. The first 18 lines are metadata; data records begin on line 19. The value -999.9 is used to denote missing values. Biomass and NPP estimates are based on plant dry matter accumulation, expressed as g/m2 and g/m2/year, respectively.
Table 3. Column headings in NPP file
COLUMN HEADINGS |
DEFINITION |
UNITS |
Site |
Site where data were gathered (code refers to site identification) | Text |
Treatmt |
Code refers to treatment of data when calculating results | Text |
Year |
Year in which data were collected | Numeric |
Month |
Month in which data were collected | |
Day |
Day on which data were collected | |
parameter |
Parameters measured (see definitions in Table 3) | Text |
amount |
Data values | Numeric |
| units | Unit of measure | Text |
| References/Comments | Reference to primary and secondary data sources and/or explanatory comments | Text |
Table 4. Parameter definitions in NPP file
PARAMETER |
DEFINITION |
UNITS |
SOURCE |
trunks |
Stem biomass | g/m2 |
Table 21 |
branches |
Branch biomass | ||
leaves |
Leaf biomass | ||
climbers+others |
Biomass of lianas and other vegetation (small trees < 10 cm diameter, epiphytes, bromeliads, orchids, and bamboos) | ||
AGbiomass |
Above-ground live biomass | g/m2 |
Table 11 |
Stdead |
Standing dead wood | Table 11 |
|
AGTotmatter |
Total above-ground biomass (sum of above) | by addition |
|
litter |
Litter biomass (recently accumulated) | g/m2 |
Table 21 |
orglayer |
Surface organic matter biomass (decomposed) | g/m2 |
Table 21 |
litter+orglayer |
Total organic mulch layer (litter + surface organic matter) | g/m2 |
Table 11 |
fineroots |
Fine root biomass (< 5 cm) | g/m2 |
Table 21 |
largeroots |
Large root biomass (> 5 cm) | g/m2 |
Table 21 |
Totroots |
Total root biomass (fine + large roots) | g/m2 |
Table 11 |
Soilorgmatter |
Soil organic matter biomass (0-20 cm depth) | g/m2 |
Table 21 |
Soilorgmatter |
Soil organic matter biomass (0-120 cm depth) | g/m2 |
Table 11 |
trunks-N |
Nitrogen concentration in stems | g/m2 |
Table 11 |
branches-N |
Nitrogen concentration in branches | ||
leaves-N |
Nitrogen concentration in leaves | ||
Stdead-N |
Nitrogen concentration in standing dead wood | ||
litter-N |
Nitrogen concentration in litter layer | ||
orglayer-N |
Nitrogen concentration in decomposed organic layer | ||
litter+orglayer-N |
Nitrogen concentration in mulch layer (litter + decomposed) | ||
fineroots-N |
Nitrogen concentration in fine roots | ||
largeroots-N |
Nitrogen concentration in large roots | ||
Totroots-N |
Nitrogen concentration in total roots (fine + large) | ||
Soilorgmatter-N |
Nitrogen concentration in mineral soil (0-20 cm depth) | ||
Soilorgmatter-N |
Nitrogen concentration in mineral soil (0-120 cm depth) | ||
trunks-P |
Phosphorus concentration in stems | g/m2 |
Table 11 |
branches-P |
Phosphorus concentration in branches | ||
leaves-P |
Phosphorus concentration in leaves | ||
Stdead-P |
Phosphorus concentration in standing dead wood | ||
litter-P |
Phosphorus concentration in litter layer | ||
orglayer-P |
Phosphorus concentration in decomposed organic layer | ||
litter+orglayer-P |
Phosphorus concentration in mulch layer (litter + decomposed) | ||
fineroots-P |
Phosphorus concentration in fine roots | ||
largeroots-P |
Phosphorus concentration in large roots | ||
Totroots-P |
Phosphorus concentration in total roots (fine + large) | ||
Soilorgmatter-P |
Phosphorus concentration in mineral soil (0-20 cm depth) | ||
Soilorgmatter-P |
Phosphorus concentration in mineral soil (0-120 cm depth) | ||
trunks-N |
Proportion of nitrogen in stem compartment | percent |
Table 31 |
branches-N |
Proportion of nitrogen in branch compartment | ||
leaves-N |
Proportion of nitrogen in leaf compartment | ||
trunks-P |
Proportion of phosphorus in stem compartment | ||
branches-P |
Proportion of phosphorus in branch compartment | ||
leaves-P |
Proportion of phosphorus in leaf compartment | ||
leaflittfall |
Annual leaf litterfall | g/m2/year |
Table 12 |
woodlittfall |
Annual branch litterfall | ||
otherlittfall |
Annual flower, fruit, and epiphyte litterfall | ||
Totlittfall |
Annual total litterfall | ||
wood_mortality |
Wood mortality rate | g/m2/year |
Table 42, 3 |
root_turnover |
Root production biomass (turnover rate) | g/m2/year |
Table 42, 3 |
Totlittfall |
Monthly total litterfall | g/m2/mo |
Table 12 |
leaflittfall |
Monthly leaf litterfall | ||
woodlittfall |
Monthly branch litterfall | ||
otherlittfall |
Monthly flower, fruit, and epiphyte litterfall |
Notes: 1Grimm and Fassbender (1981). 2Fassbender and Grimm (1981). 3Lamprecht (1977).
Sample NPP Data Record
Site; Treatmt; Year; Month; Day; parameter; amount; units; Reference/ comments ses; meanof13; 1974; -999.9; -999.9; trunks; 26970; g/m2; All data from |
Climate Data. The climate data are provided in two ASCII files (.txt format) (Table 1). The first 23 lines of <ses1_cli.txt> are metadata; data records begin on line 24. The first 18 lines of <ses2_cli.txt> are metadata; data records begin on line 19. The variable values are delimited by semi-colons. The value -999.9 is used to denote missing values.
Sample Climate Data Record <ses1_cli.txt>
Site;Temp;Parm; Jan; Feb; Mar; Apr; May; Jun; Jul; Aug; Sep; Oct; Nov; Dec; Year ses ;men6;prec; 55.0; 30.2; 54.3; 210.1; 189.9; 135.6; 148.0; 171.2; 170.7; 147.6; 104.1; 34.6; 1453.3 Where, |
Sample Climate Data Record <ses2_cli.txt>
Site;Temp;Parm; Jan; Feb; Mar; Apr; May; Jun; Jul; Aug; Sep; Oct; Nov; Dec; Year mrd ;mean;prec; 48.0; 46.3; 62.8; 169.2; 247.2; 163.5; 120.9; 142.3; 195.4; 265.1; 203.9; 85.7; 1752.0 Where, |
3. Data Application and Derivation:
The accumulation of biomass, or NPP, is the net gain of carbon by photosynthesis that remains after plant respiration. While there are many fates for this carbon, this data set accounts for total litterfall, woody turnover, and fine root turnover. These are considered the major components of NPP.
The biomass dynamics data for the San Eusebio site are provided for comparison with models and estimation of NPP. Climate data are provided for use in driving ecosystem/NPP models.
4. Quality Assessment:
Data for biomass, litter production, and nutrient content of litter at San Eusebio were compared to values for other tropical montane forests (Table 4, Grimm and Fassbender, 1981; Table 2, Fassbender and Grimm, 1981).
Sources of Error
Information not available.
5. Data Acquisition Materials and Methods:
The organic matter and stored elements (N, P, K, Ca, Mg, Fe, Mn, Al, and Na) were measured in 13 stands of a montane forest ecosystem in the Sierra de Merida, northwestern Venezuela,
The 13 study plots were 50 x 50 m in size. All living and dead trees > 10 cm in diameter were measured; smaller trees were mapped in a radius 15 m from center of the plot. Subplots were 2 x 2 m with 12 replications distributed radially from the center of the plot. Fine roots (< 5 cm diameter) were sampled to 20 cm depth.
Eighty-six trees representing the 33 most important species were felled. Volume was calculated based on height and diameter. Dry weight was calculated. Branches, leaves and epiphytes were weighed separately and two aliquots were collected in bags for plastic in a drying oven at 105 C for 24 hours. Large roots (> 5 cm diameter) of 30 trees were sampled, dried, and weighed. Samples were prepared for chemical analysis. The results are presented as the mean of the 13 plots.
In each of the 13 plots, soil organic matter was sampled in 0.25 m2 subplots to depths of 0-20, 20-40, 40-60, 60-90, and 90-120 cm. Soil samples were dried and analyzed as for vegetation above.
Litter production (tree stands, each 12 collectors; sampling every two weeks) and litter decomposition (samples of leaves and branches exposed to environment, collection every two months) were also studied. Three of the 13 plots were selected for studying litter production and decomposition. Litter collectors, 1 m2 in size, were emptied bi-weekly. Samples were separated into leaves, branches, fruits, flowers and epiphytes (bromeliads and orchids) compartments and dried at 105 C for 24 hours. Monthly average dry weight was determined. The results are presented as the mean of the 3 plots.
Litter decomposition was studied using a 40 x 40 wooden frame with 1 cm mesh containing leaf and branch samples. Samples were examined bi-monthly for 7 sampling dates to determine decomposition rate. Samples were dried and analyzed as for vegetation above. Decomposition data are reported in the literature (Fassbender and Grimm, 1981).
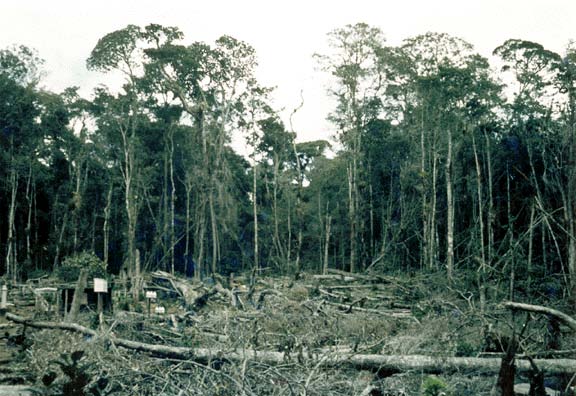
Figure 4. One of the research plots clear-cut for biomass determination at the San Eusebio tropical forest study site, Venezuela. (A profile of the natural forest may be seen in the background. Photograph taken 1973-74 by Dr. H. W. Fassbender, Fachhochschule Hildesheim/Holzminden, Goettingen, Germany). (SES2-1.jpg)
6. Data Access:
This data set is available through the Oak Ridge National Laboratory (ORNL) Distributed Active Archive Center (DAAC).
Data Archive:
Web Site: http://daac.ornl.gov
Contact for Data Center Access Information:
E-mail: uso@daac.ornl.gov
Telephone: +1 (865) 241-3952
7. References:
Grimm, U., and H. W. Fassbender. 1981. Ciclos bioquimicos en un ecosistema forestal de los Andes Occidentales de Venezuela. I. Inventario de las reservas organicas y minerales (N, P, K, Ca, Mg, Fe, Al, Na). Turrialba 31: 27-37.
Fassbender, H. W., and U. Grimm. 1981. Ciclos bioquimicos en un ecosistema forestal de los Andes Occidentales de Venezuela. II. Produccion y descomposicion de los residuos vegetales. Turrialba 31: 39-47.
Lamprecht, H. 1977. Waldkundliche Research Projects and Results. Archives Forestry 48(1): 226-231.
Olson, R.J., K.R. Johnson, D.L. Zheng, and J.M.O. Scurlock. 2001. Global and Regional Ecosystem Modeling: Databases of Model Drivers and Validation Measurements. ORNL Technical Memorandum TM-2001/196. Oak Ridge National Laboratory, Oak Ridge, Tennessee, U.S.A.
Additional Sources of Information:
Clark, D. A., S. Brown, D. W. Kicklighter, J. Q. Chambers, J. R. Thomlinson, J. Ni, and E. A. Holland. 2001a. Net primary production in tropical forests: an evaluation and synthesis of existing field data. Ecological Applications, 11(2): 371-384.
Clark, D.A., S. Brown, D.W. Kicklighter, J.Q. Chambers, J.R. Thomlinson, J. Ni, and E.A. Holland. 2001b. NPP Tropical Forest: Consistent Worldwide Site Estimates, 1967-1999. Data set. Available on-line [http://daac.ornl.gov] from the Oak Ridge National Laboratory Distributed Active Archive Center, Oak Ridge, Tennessee, U.S.A. doi:10.3334/ORNLDAAC/616
Olson, R.J., J.M.O. Scurlock, S.D. Prince, D.L. Zheng, and K.R. Johnson (eds.). 2012a. NPP Multi-Biome: Global Primary Production Data Initiative Products, R2. Data set. Available on-line [http://daac.ornl.gov] from the Oak Ridge National Laboratory Distributed Active Archive Center, Oak Ridge, Tennessee, U.S.A. doi:10.3334/ORNLDAAC/617
Olson, R.J., J.M.O. Scurlock, S.D. Prince, D.L. Zheng, and K.R. Johnson (eds.). 2012b. NPP Multi-Biome: NPP and Driver Data for Ecosystem Model-Data Intercomparison, R2. Data set. Available on-line [http://daac.ornl.gov] from the Oak Ridge National Laboratory Distributed Active Archive Center, Oak Ridge, Tennessee, U.S.A. doi:10.3334/ORNLDAAC/615
Scurlock, J.M.O., and R J. Olson. 2002. Terrestrial net primary productivity - A brief history and a new worldwide database. Environ. Rev. 10(2): 91-109. doi:10.1139/a02-002
Scurlock, J.M.O., and R.J. Olson. 2012. NPP Multi-Biome: Grassland, Boreal Forest, and Tropical Forest Sites, 1939-1996, R1. Data set. Available on-line [http://daac.ornl.gov] from Oak Ridge National Laboratory Distributed Active Archive Center, Oak Ridge, Tennessee, U.S.A. doi:10.3334/ORNLDAAC/653