Get Data
Summary:
This data set contains two ASCII files (.txt format). One file contains monthly productivity data measured on an arid dwarf-shrub steppe in northern Patagonia, Argentina from August 1980 to March 1982. The second file contains climate data recorded at a weather station set up onsite for the duration of the NPP study.
Dynamics of above-ground biomass, dead matter, and litter were monitored at Pampa de Leman (-45.43 S, -69.83 W, Elevation 400 m) at monthly or bi-monthly intervals in a 1.5-hectare exclosure area protected from sheep grazing. The vegetative community is dominated by the dwarf shrub Nassauvia glomerulosa, with two grasses (Poa dusenii and Hordeum comosum).
Annual above-ground net primary productivity (ANPP) of 78 g/m2/yr was estimated from the sum of the increase in above-ground biomass, dead matter, and litter.
Revision Notes: Only the documentation for this data set has been modified. The data files have been checked for accuracy and are identical to those originally published in 1998.Additional Documentation:
The NPP data collection contains field measurements of biomass, estimated NPP, and climate data for terrestrial grassland, tropical forest, temperate forest, boreal forest, and tundra sites worldwide. Data were compiled from the published literature for intensively studied and well-documented individual field sites and from a number of previously compiled multi-site, multi-biome data sets of georeferenced NPP estimates. The principal compilation effort (Olson et al., 2001) was sponsored by NASA’s Terrestrial Ecology Program. For more information, please visit the NPP web site at http://daac.ornl.gov/NPP/npp_home.html.
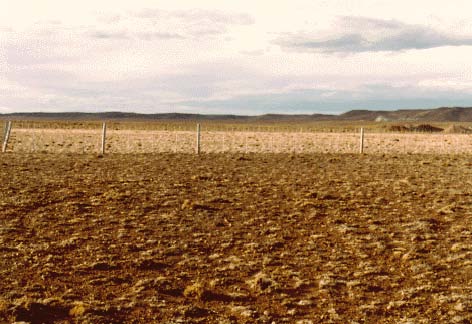
Figure 1. Close-up view of the Pampa de Leman study site, Argentina. (Grazed area in the foreground; exclosure where the study was carried out in the background. Photograph taken 6th August 1982 by Dr. M.B. Bertiller, Centro Nacional Patagonico, Argentina).
Data Citation:
Cite this data set as follows:
Bertiller, M.B. 2014. NPP Grassland: Pampa de Leman, Argentina, 1980-1982, R1. Data set. Available on-line [http://daac.ornl.gov] from Oak Ridge National Laboratory Distributed Active Archive Center, Oak Ridge, Tennessee, USA. doi:10.3334/ORNLDAAC/212
This data set was originally published as:
Bertiller, M.B. 1998. NPP Grassland: Pampa de Leman, Argentina, 1980-1982. Data set. Available on-line [http://daac.ornl.gov] from Oak Ridge National Laboratory Distributed Active Archive Center, Oak Ridge, Tennessee, U.S.A.
Table of Contents:
- 1 Data Set Overview
- 2 Data Description
- 3 Applications and Derivation
- 4 Quality Assessment
- 5 Acquisition Materials and Methods
- 6 Data Access
- 7 References
1. Data Set Overview:
Project: Net Primary Productivity (NPP)
Pampa de Leman is located on an alluvial terrace of the Senguerr river (-45.43 S, -69.83 W, Elevation 400 m) near Estancia Külper, in Chubut (Northern Patagonia), Argentina. This arid region is characterized by continental dry westerly winds that tend to produce soil erosion. Erosion has been exacerbated by the introduction of domestic sheep to the area around 1900, upsetting the equilibrium that previously existed between vegetation and native herbivores.
An area of 1.5 hectares was protected from sheep grazing for this study site. The dominant vegetation comprises a community of prostrate vegetation with low ground cover (10-20%) dominated by the dwarf shrub Nassauvia glomerulosa and two grasses (Poa dusenii and Hordeum comosum).
Monthly/bi-monthly meaurements of above-ground live biomass (>90% of which is accounted for by the dominant shrub species), together with measurments of recent standing dead matter (yellow), standing dead (gray) and litter, are available for two growing seasons from 1980 to 1982 (N.B.: Southern Hemisphere growing seasons).
Annual above-ground net primary productivity (ANPP) of 78 g/m2/yr was estimated from the sum of the increase in above-ground biomass, dead matter, and litter (Scurlock and Olson, 2013).
Climate data for this site are limited to measurements made for the duration of the study.
2. Data Description:
Site: Pampa de Leman, Argentina
Site Boundaries: (All latitude and longitude given in decimal degrees)
| Site (Region) | Westernmost Longitude | Easternmost Longitude | Northernmost Latitude | Southernmost Latitude | Elevation (m) |
|---|---|---|---|---|---|
| Pampa de Leman, Argentina | -69.83 | -69.83 | -45.43 | -45.43 | 400 |
Spatial Resolution: The study area is an exclosure area of 1.5 hectares.
Temporal Coverage: Above-ground biomass measurements were made from 1980/08/04 through 1982/03/24. Climate data are available from 1980/09/01 through 1982/03/31.
Temporal Resolution: Above-ground biomass measurements were made monthly or bi-monthly. All biomass estimates are based on plant dry matter accumulation, expressed as g/m2. Climate data are expressed as monthly and annual precipitation amounts (mm) and monthly and annual mean temperature ( degrees C).
Table 1. File names
| FILE NAME | TEMPORAL COVERAGE | FILE CONTENTS |
|---|---|---|
| pmp_npp.txt | 1980/08/04 - 1982/03/24 | Above-ground biomass data for an ungrazed grasslands at Pampa de Leman, Argentina |
| pmp_cli.txt | 1980/09/01 - 1982/03/31 | Climate data from a weather station at Pampa de Leman, Argentina |
NPP data: Biomass estimates for the Pampa de Leman site are provided in one file (Table 1). The data set is an ASCII file (.txt format). The first 18 lines are metadata; data records begin on line 19. The variable values are delimited by semi-colons. There are no missing values. All biomass units are in g/m2 (dry matter weight).
Table 2. Column headings in NPP file pmp_npp.csv
| COLUMN HEADING | DEFINITION | UNITS |
|---|---|---|
| Site | Site where data were gathered (code refers to site identification) | Text |
| Yr | Year in which data were collected | Numeric |
| Mon | Month in which data were collected | |
| Day | Day on which data were collected | |
| Jdate | Date in Julian year | |
| Tyear | Date in decimal year (year plus the Julian date divided by 365) | |
| AGbiomass | Monthly above-ground living biomass | g/m2 |
| Newdead | Monthly above-ground standing recent dead matter | |
| Olddead | Monthly above-ground standing old dead matter | |
| litter | Monthly above-ground litter | |
| AGtotclip | Monthly above-ground standing plant biomass (living plus recent and old dead material) | |
| AGtotmatter | Monthly total above-ground standing biomass (living + dead material + litter) |
Sample NPP Data Record <pmp_npp.csv>
| Site; Yr; Mon; Day; Jdate; Tyear; AGbiomass;
Newdead; Olddead; litter; AGtotclip; AGtotmatter pmp; 1980; 8; 4; 217; 1980.595; 56.23; 16.69; 5.13; 5.68; 78.05; 83.73 pmp; 1980; 9; 2; 246; 1980.674; 63.86; 10.13; 7.32; 7.33; 81.31; 88.64 pmp; 1980; 10; 13; 287; 1980.786; 74.30; 10.78; 5.93; 8.85; 91.01; 99.86 pmp; 1980; 11; 11; 316; 1980.866; 60.70; 9.69; 5.48; 5.55; 75.87; 81.42 pmp; 1980; 12; 1; 336; 1980.921; 62.81; 4.40; 4.14; 0.87; 71.35; 72.22 ... |
Climate Data. The climate data set is an ASCII file (.txt format). The first 18 lines are metadata; data records begin on line 19. The variable values are delimited by semicolons. The value -999.9 is used to denote missing values.
| COLUMN HEADINGS | DEFINITION |
|---|---|
| Site | Unique 3-character code for each site based on the first three consonants in the site name (e.g., pmp for Pampa de Leman) |
| Temp (Temporal) |
Indicates whether the values in that row are either long-term (i.e, mulit-year) or annual data for the specified parameter. For multi-year, the values are: mean=mean values (monthly and annual) calculated for the years of data as noted in the documentation numb=number of years of data included in a reported mean value stdv=standard deviation of a mean value Annual data: 19XX=monthly and annual parameter values for the specified year (e.g., 1972) |
| Parm | Parameter, indicates the meteorological data reported in that row. prec-total precipitation for the month or year tmax=maximum temperature for the month or year reported in degrees C tmin=minimum temperature for the month or year reported in degrees C |
|
Description of specific Temp and Parm data values: Long-term data: site;mean;prec; Multi-year mean of total precipitation for each month [Jan, Feb, Mar, …, Dec] and mean of total annual precipitation across all years [Year] (mm) site;mean;tmax; Multi-year mean of maximum temperature for each month [Jan, Feb, Mar, …, Dec] and mean of annual maximum temperature across all years [Year] (C) site;mean;tmin; Multi-year mean of minimum temperature for each month [Jan, Feb, Mar, …, Dec] and mean of annual minimum temperature across all years [Year] (C) … site; numb and stdv; repeat for prec, tmax, and tmin; Annual data: site;19XX;prec; Total precipitation for each month [Jan, Feb, Mar,.....Dec] and total precipitation for the year 19XX [Year] (mm) site;19XX;tmax; Maximum temperature for each month [Jan, Feb, Mar,.....Dec] and maximum for the year 19XX [Year] (C) site;19XX;tmin; Minimum temperature for each month [Jan, Feb, Mar,.....Dec] and minimum for the year 19XX [Year] (C) … site;19XX;(prec, tmax, and tmin); repeat for reported years. Annual data missing value note: If a monthly parm value is missing, the parm value for [Year] is also set to missing (-999.9). |
Sample Climate Data Record
| Site;Temp;Parm; Jan; Feb; Mar; Apr; May; Jun; Jul; Aug; Sep; Oct; Nov; Dec; Year pmp; 1980;tmen; -999.9; -999.9; -999.9; -999.9; -999.9; -999.9; -999.9; -999.9; 7.6; 8.8; 13.8; 14.0; -999.9 pmp; 1980;prec; -999.9; -999.9; -999.9; -999.9; -999.9; -999.9; -999.9; -999.9; 2.6; 1.0; 0.5; 8.0; -999.9 pmp; 1981;tmen; 16.3; 15.1; 11.7; 8.0; 4.5; 2.5; 2.0; 4.1; 4.0; 7.5; 12.2; 16.2; 8.7 pmp; 1981;prec; 12.8; 2.5; 4.0; 1.5; 11.7; 26.2; 1.0; 0.5; 5.0; 2.1; 0.5; 0.0; 67.8 … Where, Temp (temporal) - specific year or long-term statistic: Parm (parameter): tmen = average mean temperature for month or year (C) prec = total precipitation for month or year (mm) |
3. Data Application and Derivation:
The accumulation of biomass, or NPP, is the net gain of carbon by photosynthesis that remains after plant respiration. While there are many fates for this carbon, the ANPP value presented here is the sum of the increase in above-ground biomass, dead matter, and litter.
Above-ground plant production in this desert dwarf shrub steppe was studied in order to improve strategies for herbivore grazing management.
Monthly grassland biomass dynamics data for Pampa de Leman are provided for comparison with models and estimation of NPP. Climate data are provided for use in driving ecosystem/NPP models.
4. Quality Assessment:
None available.
5. Data Acquisition Materials and Methods:
Site Information
Pampa de Leman is located on an alluvial terrace of the Senguerr river in Chubut (Northern Patagonia), Argentina (-45.43 S, -69.83 W, Elevation 400 m). The desert dwarf-shrub steppe is classified as a modified Bailey ecoregion temperate dry steppe, #331/332. The site is dominated by the dwarf shrub Nassauvia glomerulosa and two grasses (Poa dusenii and Hordeum comosum). The soil type is Typic haplargids. Pampa de Leman was grazed by native herbivores until 1900, then sheep afterwards. An area of 1.5-hectares was protected from sheep grazing during the study. The climate of the region is arid with continental dry westerly winds that tend to produce soil erosion. Erosion is exacerbated by sheep grazing. Climate data are available from a weather station set up at the study site for the duration of the study (1980-1982).
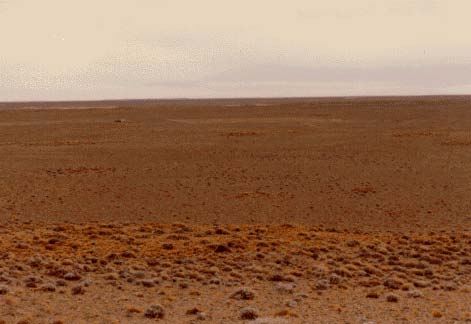
Figure 2. General view of the study area near the Pampa de Leman site, Argentina, looking from North-East to South-West. (Photograph taken 6th August 1982 by Dr. M.B. Bertiller, Centro Nacional Patagonico, Argentina).
Above-ground biomass was determined by harvest technique. Harvested samples were separated into living material, recent standing dead matter (yellow), and standing old dead matter (gray). Litter was also collectd. A biomass dynamics model was fitted to the field data to describe the dynamics of above-ground compartments of dominant plant species. Quantification of a number of plant ecophysiological characteristics like productivity, senescence, etc. and their relation with key environmental factors was achieved by exploring a number of ad hoc regression models in order to improve strategies for herbivore management.
Climate data
Climate data are limited to precipitation and temperature measurements made for the duration of the study at the research site (1980-1982).
The climate data accompanying this NPP data set was compiled from daily observations of Tmax, Tmin, and precip amount.
For a given month, the maximum value of the daily Tmax for that month and the minimum value of the Tmin for that month is provided. For the year, the maximum value of the monthly Tmax is the annual Tmax and for the year the minimum value of the monthly Tmin values is the annual Tmin. Daily precipitation amount is summed to yield a monthly precipitation amount and the monthly precipitation is summed to provide an annual precipitation amount.
The multi-year mean monthly Tmax is the average of the Tmax values for that month for each year of the record. For example the mean monthly Tmax for April is the mean of each April’s Tmax for the observation period of record. Mean monthly Tmin and Mean monthly precip amount are calculated similarly.
6. Data Access:
This data is available through the Oak Ridge National Laboratory (ORNL) Distributed Active Archive Center (DAAC).
Data Archive Center:
Contact for Data Center Access Information:
E-mail: uso@daac.ornl.gov
Telephone: +1 (865) 241-3952
7. References:
Bertiller, M.B. 1984. Specific primary productivity dynamics on arid ecosystems: a case study in Patagonia, Argentina. Acta Oecologica: Oecologia Generalis 5: 365-381.
Olson, R.J., K.R. Johnson, D.L. Zheng, and J.M.O. Scurlock. 2001. Global and Regional Ecosystem Modeling: Databases of Model Drivers and Validation Measurements. ORNL Technical Memorandum TM-2001/196. Oak Ridge National Laboratory, Oak Ridge, Tennessee, U.S.A.
Additional Sources of Information:
Scurlock, J.M.O., and R.J. Olson. 2002. Terrestrial net primary productivity - A brief history and a new worldwide database. Environ. Rev. 10(2): 91-109. doi:10.1139/a02-002
Scurlock, J.M.O., and R.J. Olson. 2012. NPP Multi-Biome: Grassland, Boreal Forest, and Tropical Forest Sites, 1939-1996, R1. Data set. Available on-line [http://daac.ornl.gov] from Oak Ridge National Laboratory Distributed Active Archive Center, Oak Ridge, Tennessee, U.S.A. doi:10.3334/ORNLDAAC/653
Scurlock, J.M.O., K. Johnson, and R.J. Olson. 2002. Estimating net primary productivity from grassland biomass dynamics measurements. Global Change Biology 8(8): 736-753. DOI: 10.1046/j.1365-2486.2002.00512.x